Abstract
Aberrant glycosylation plays a pivotal role in a diverse set of diseases including cancer. A microfluidic lectin blotting platform is introduced to enable and expedite the identification of protein glycosylation based on protein size and affinity for specific lectins. The integrated multi-stage assay eliminates manual intervention steps required for slabgel lectin blotting, increases total assay throughput, limits reagent and sample consumption, and completes using one instrument. The assay is comprised of non-reducing sodiumdodecyl sulfate polyacrylamide gel electrophoresis (SDS-PAGE) followed by on-line post-sizing SDS filtration and lectin-based affinity blotting. Important functionality is conferred through both device and assay advances that enable integration of nanoporous membranes flanking a central microchamber to create sub-nanoliter volume compartments which trap SDS-protein complexes and allow electrophoretic SDS removal with buffer exchange. Recapitulation of protein binding for lectin was optimized through quantitative assessment of SDS-treated green fluorescent protein (GFP). Aberrantly glycosylated IgA1 with galactose-deficient O-glycans was probed in ~6 min from ~3 μL of sample. This new microfluidic lectin blotting provides a rapid and automated assay for assessment of aberrant glycosylation.
Glycosylation is a post-translational protein modification associated with cell differentiation and normal cellular functions. Abnormal glycosylation of specific glycoproteins has been described in cancer and autoimmune diseases1. Aberrant glycosylation has also been associated with disease progression2. Despite the potential of glycans as reliable clinical biomarkers, development has been slow. Major delaying factors stem, in part, from shortcomings of conventional analytical technology and the natural complexity and heterogeneity of glycosylation3. Although lectin-based blots are powerful tools, the labor-intensive, time-intensive, low-throughput nature of the workflow is limiting4. While lectin arrays are a promising high-throughput alternative approach for analyzing glycosylation patterns5, arrays do not provide information about protein molecular weight (MW). Due to the structural complexity and diversity of glycoproteins, next-generation protein assays would benefit from an automated, high-throughput approach to provide information about glycosylation, as well as protein MW6.
Recently, bioanalytical technology advances have streamlined and automated blotting techniques. Capillary electrophoresis formats show promise with reduced reagent and time requirements7, with fully automated operation (e.g., fluid exchange, sample transfer) and scale-up underway. Other efforts have focused on scale-up of conventional slab-gel technologies, including polymer gasket technology introduced to create flow channels for applying blocking solutions and multiple antibody probe solutions to polyvinylidene fluoride (PVDF) membranes8. Although multiplexing is enhanced, the separation and membrane transfer steps still rely on slow, sample-consuming macro-scale slab gel formats with manual integration of steps. Consequently, unified, automated protein immunoblot techniques would fill a broad and currently unmet analytical need9.
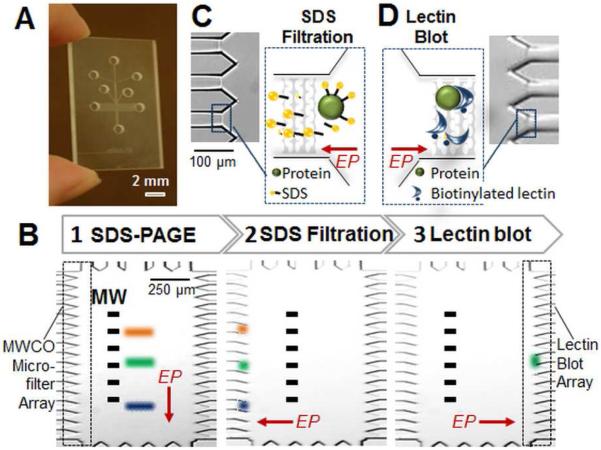
Thus, we introduce a unified, fully automated multidimensional assay that integrates sizing (SDS-PAGE) under non-reducing conditions with on-line full or partial recovery of protein binding capacity and subsequent in-chip lectin blotting (Figure 1). The assay is performed in a glass microfluidic device housing a micro-chamber and microchannel network (Figure 1A). Two major considerations need be made for sizing of glycoproteins. First, non-reducing SDS-PAGE retains the global glycoprotein structure and avoids nonspecific (false) lectin binding sometimes observed under reducing conditions10. Second, SDS treatment of proteins in SDS-PAGE has a significant impact on the native protein structure and can reduce binding affinities11. Consequently, washing steps to dilute and remove SDS after SDS-PAGE are included as part of slab-gel lectin blot workflows12. Microscale handling provides an avenue for efficient protein renaturation in terms of time, materials consumption and losses (e.g., associated with dilution). Nevertheless, while microchannel networks offer design strategies13 for reagent metering, mixing, denaturant diffusion and removal, no effort has been reported regarding such on-chip protein manipulation after SDS-PAGE. In order to address this challenge, we integrate microscale molecular weight cut off (MWCO) filters to dilute and remove SDS from resolved protein peaks after non-reducing SDS-PAGE and prior to antibody/lectin blotting (Figure 1B). SDS removal is hypothesized to underpin recapitulation the binding affinity of previously sized protein species; we use the short-hand ‘renaturation’ to refer to this process. Using the integrated workflow we demonstrate rapid lectin blotting (~6 min) with limited consumption of sample materials (~3 L) and reagents. Introduction of such unified assays advances protein measurement capabilities to meet a broad range of protein analysis challenges spanning from basic sciences to clinical needs.
Figure 1.
Microfluidic integration of protein separation, intra-assay sample manipulation, and probing with immobilized lectin yields an automated lectin blot. (A) Glass microfluidic device with microchamber at center. (B) A schematic illustrates the three assay stages: SDS-PAGE, SDS-dilution via microfiltration during protein renaturation, and probing of renatured proteins using biotinylated lectin immobilized to streptavidin acrylamide. “MW” indicates molecular weight. (C) Micrograph of MWCO microfilters used for post-sizing SDS removal. The microfilters exclude transport of species >20 kDa, thus allowing buffer and SDS to exit the chamber, indicated in schematic inset. (D) Biotinylated lectin (or antibody) is housed in streptavidin-acrylamide in a microchannel array flanking the right hand side of the microchamber. Analytes with affinity for immobilized species are retained. All other species electromigrate out of array. “EP” indicates the direction of electrophoresis.
The MWCO microfilters are polyacrylamide (PA) gel membranes located in a microchannel array flanking the central microchamber. The MWCO microfilters are fabricated using one-step photopatterning of a 45%T PA gel in the channel array (Figure 1C). Owing to placement in channels, the filters define compartments that allow electrophoresis-assisted lateral buffer exchange and SDS filtration (Figure S1 and Table S1). After SDS removal, species are driven to a blotting region flanking the opposite side of the microchamber (Figure 1D). The PA blotting gels incorporate streptavidin-acrylamide, which is decorated with biotinylated antibody or lectin. Directed electrophoresis through the 3D reactive ‘pores’ in the blotting region is hypothesized to enhance transport by reducing diffusion distances and confer improved binding owing to controlled orientation of capture reagent.14 (See Figure S2). Use of 2D electric field control in the 0.5×2-mm2 gel-patterned microfluidic chamber9 allows the total blotting workflow to be conducted in one unified microdevice in an automated format (Figure S1 and Table S1).
The MWCO microfilters offer a low-molecular-weight cut-off that allows buffer ions and SDS monomers (MW=288) to pass out of the microchamber, while excluding larger species, such as proteins (>20 kDa). The critical micelle concentration (CMC) of SDS is 6-8 mM (~ 0.23%; w/v). Above the CMC, SDS micelles form with a maximum MW of 16 kDa and break up into monomers upon dilution15. Both SDS-treated trypsin inhibitor (21 kDa) and green fluorescent protein (GFP, 27 kDa) were empirically determined to be excluded from electromigration through the microfilters (Figure S1). The electrophoretic mobility of SDS micelles is higher than that of the model proteins (μ = −6.0 × 10 −4 cm2 V−1 s−1 SDS compared to μTI = −2.0 × 10 −4 cm2 V−1 s−1, both at pH 7.0)16, thus SDS micelles are expected to electromigrate more quickly under the same applied electric field with other conditions held constant. Therefore, the SDS removal process is not expected to be a rate-limiting step for protein renaturation. Note that during the MWCO microfilter sample treatment process, an oscillating voltage was applied to minimize protein entanglement or adsorption to the PA gel comprising the MWCO microfilters (Table S1, Figure S3).
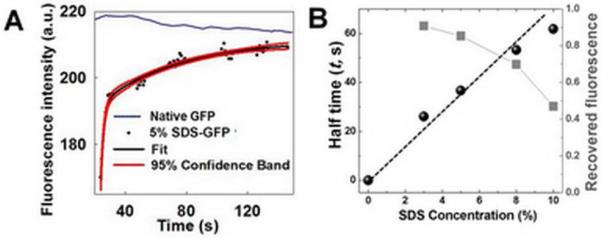
GFP fluorescence has been correlated with structure suggesting that monitoring fluorescence signal of SDS-treated GFP at the microfilters during buffer exchange and SDS removal (recovered fluorescence) provides one means to evaluate GFP renaturation. To assess the fluorescence recovery of SDS-GFP during manipulation by the MWCO microfilters, a stream (not a zone) of 5% SDS-treated GFP was electrophoresed into the microchamber then manipulated at the MWCO microfilters (Figure S1b). Monitoring of fluorescence recovery for native GFP yielded a gradual decrease in fluorescence signal (Figure 2A). In contrast, the same handling used on 5% SDS-GFP yielded a notable increase in fluorescence signal suggesting some degree of GFP renaturation. Fitting the recovered fluorescence of handling time courses for GFP treated with a range of SDS concentrations to double-exponential functions yielded estimates of both the renaturation rate constant and half time (t) (see Figure 2B and Table S2)17. Recovered fluorescence was inversely related to the SDS concentration in the sample, suggesting that less SDS in the initial sample leads to a more effective renaturation process. Here, GFP-renaturation kinetics agree with literature reports of conventional dilution-based GFP renaturation18. The consistent performance of GFP handling at the MWCO microfilter array is shown in Figure S4. The intra-assay sample handling introduced here allows time-dependent characterization of the renaturation process while incurring minimal sample dilution and material losses. Such characteristics are important for optimization of assays that combine SDS-PAGE with subsequent probing. Further, this strategy provides the first demonstration for monitoring protein refolding kinetics using a microfilter to our knowledge, potentially relevant for precious samples.
Figure 2.
Characterization of renaturation for 5% SDS-treated GFP during treatment at on-chip MWCO microfilters. (A) Time evolution of fluorescence signal during treatment and fit to double-exponential function. GFP concentration is 200 nM. (B) Renaturation half time and fluorescence recovery are SDS concentration dependent.
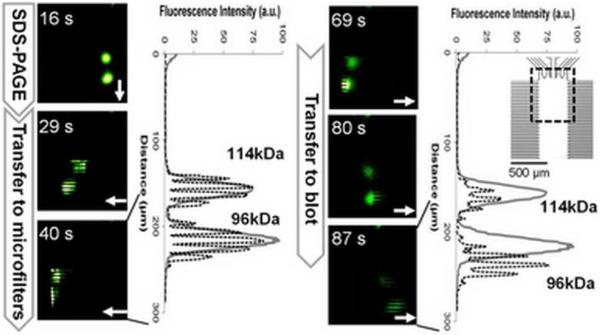
Information losses inherent to intra-assay sample handling were assessed for the MWCO microfilter approach introduced here, informing both assay and chip design. Here, the channel array housing the microfilters was fabricated with both 10 um and 50 um pitch between channel centerlines. MW protein ladders transferred from the SDS-PAGE separation axis to the lateral microchannel arrays (Figure S5, Table S3) with both designs allowing reconstruction of the separation profile from the SDS-PAGE axis. Figure 3 illustrates that oversampling of protein zones minimizes de-separation and MW information losses19 (Figure S6, SI movie, Table S3). In this case, losses in MW information are ~5 kDa with SR losses <4%.
Figure 3.
Characterization of transfer losses arising from intra-assay sample handling and treatment. Fluorescence micrographs report time evolution of integrated assay for two model proteins (phosphorylase B 96 kDa, β-galactosidase 114 kDa, 5% SDS treatment). Plots of fluorescence intensity distribution on separation axis (gray lines) are compared to fluorescence intensity distribution in both MWCO microfilter array (dashed black line at 40 s) and blotting array (dashed black line at 87 s). Arrows indicate the direction of electrophoresis. Array channel spacing is ~10 um. Chip design and imaging region are shown in inset.
The unified on-chip lectin blotting assay was used to assess an aberrantly glycosylated glycoprotein, human IgA1 with galactose-deficient O-glycans. This IgA1 glycosylation aberrancy is typical for IgA nephropathy (IgAN). IgAN is the most common primary glomerulonephritis, frequently leading to end-stage renal disease20. Specifically, O-glycans attached to serine and threonine residues in the hinge region of the α1 heavy chain in IgA1 are deficient in galactose and, thus, have terminal N-acetylgalactosamine (GalNAc) exposed (Figure S7). In contrast, normal IgA1 O-glycans consist of GalNAc and galactose. Based on these observations, aberrantly glycosylated serum IgA1 has been proposed as a glycosylation-associated IgAN biomarker20.
Towards this end, we assessed lectin binding to naturally galactose-deficient IgA1 myeloma protein that mimics the aberrancy found in IgA1 from patients with IgAN (See supplementary information). Lectin from Helix aspersa (HAA) is specific for terminal GalNAc on galactose-deficient IgA121 and was thus immobilized in the blotting region. Normally glycosylated IgA1 purified from the serum of a healthy individual was used as a negative control (i.e., no interaction with HAA was expected). Conventional HAA lectin slab-gel blotting was performed (Figure S7) with HAA binding to the IgA1 myeloma protein, thus confirming that the O-glycans of IgA1 are galactose-deficient. HAA did not bind to IgA1 from normal human serum, supporting the assertion that this IgA1 is normally glycosylated. Note that a non-specific (false) response under reducing condition was observed.
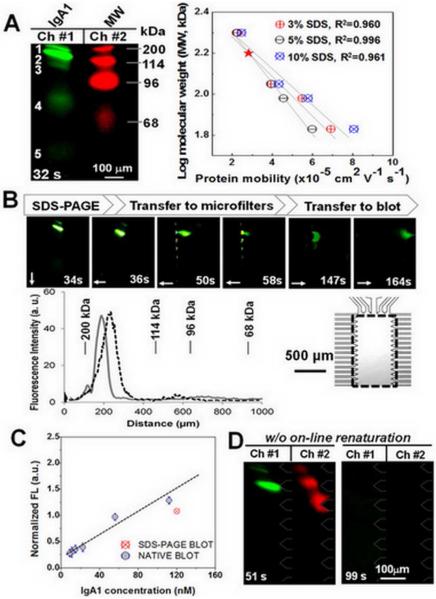
On-chip non-reducing SDS-PAGE of fluorescently-labeled galactose-deficient IgA1 myeloma protein (green) was conducted and yielded an average SR of 1.3 (Figure 4A) for the five species present. The on-chip analysis is consistent with the slab gel (Figure S7), yet required 32 s of separation time. An SDS-PAGE protein ladder (68-200 kDa, labeled with a red fluorophore) was separated simultaneously and observed in a second optical channel (Figure 4A). Two-color monitoring enabled MW calibration for unknown proteins and provided size information via a linear calibration curve (R2 >0.96). Size-to-mobility calibration curves were generated for three SDS treatment conditions (3%, 5%, and 10% SDS, Figure 4A). The 5% SDS treatment was applied for sizing of the galactose-deficient IgA1 myeloma protein. The calibration relation [log (MW) = (-0.13 × mobility) + 2.6] suggests an IgA1 MW of 160 kDa (Figure 4A), consistent with the expected MW of monomeric IgA1. Species 3 and 4 were assigned to be 141 kDa and 85 kDa in size, respectively, and were hypothesized to be fragments of IgA. Species 3 is consistent with the 141 kDa monomer lacking one light chain (L), whereas the 85 kDa species 4 is consistent with H (heavy chain)1+L1. Species 3 and 4 were observed with slab gel sizing (Figure S7). Species 5 was assigned as free dye (<1 kDa).
Figure 4.
Microfluidic HAA lectin blot of galactose-deficient IgA1 myeloma protein. (A) Fluorescence micrographs show two-color monitoring of MW ladders and myeloma IgA1 sizing. The linear calibration curves (right) were obtained using varied concentrations of SDS for calculating unknown protein MW (myosin heavy chain 200 kDa, β-galactosidase 114 kDa, phosphorylase B 96 kDa, and human serum albumin 68 kDa). The red star indicates the size of monomeric IgA1. (B) Fluorescence micrographs report time evolution of HAA lectin blot of galactose-deficient IgA1 myeloma protein. Plot of fluorescence intensity distribution on separation axis (gray line) is compared to intensity distribution in blotting array (dashed black line at 164 s). Arrows indicate the direction of electrophoresis. Array channel spacing is ~50 um. Imaging region is shown in inset. (C) Evaluation of the recovered activity by comparison of captured myeloma IgA1 amount in blotting region under native and SDS conditions. (D) HAA blot of 5% SDS-treated myeloma IgA1 (green) and MW ladders (68-200 kDa, red) without on-line renaturation, as negative control.
After non-reducing SDS-PAGE, species were laterally transferred into the flanking MWCO microfilters for SDS removal and buffer exchange by applying a transfer potential for 100 s, as described previously. Treated protein species were then electrophoresed across the chamber and to the blotting region (Figure 4B). Losses in MW information from the SDS-PAGE axis to final blot axis was ~7 kDa, and SR losses were <5%.
The role of on-chip renaturation and SDS removal in recapitulating lectin-recognition of sized proteins was estimated by comparing on-chip lectin blotting of native IgA1 (no SDS present) to blotting of SDS-treated and subsequently renatured IgA1(Figure 4C). Protein fluorescence signal retained on the HAA blotting region suggests ~75% recovery of lectin-binding capacity for SDS-treated proteins using the MWCO microfilter approach (Figure 4C). This binding capacity performance is sufficient for assays of serum IgA1, which is the dominant subclass of total serum IgA (>2 mg/mL)22.
To assess the role of SDS dilution in recapitulating lectin binding affinity, we performed lectin blotting of SDS-treated IgA1 without on-chip renaturation and SDS-dilution (Figure 4D). Here 5% SDS-myeloma IgA1 was directly transferred to the blotting region after on-chip SDS-PAGE, with no treatment at the MWCO microfilters. As expected, no detectable binding was observed. Likewise, transfer of a MW ladder (68 kDa to 200 kDa) to the HAA blotting region showed no appreciable binding, suggesting negligible non-specific adsorption and size-exclusion effects (Figure 4D). The microfluidic HAA lectin blot allowed a rapid (~6 min) assessment of IgA1O-linked galactose deficiency that mimics serum IgA1 from patients with IgAN.
We demonstrate a rapid and automated assay comprised of: SDS-PAGE, in-situ renaturation and SDS-dilution, electrophoretic transfer between stages, and subsequent affinity blotting in a single microfluidic device. An array of MWCO microfilters enables SDS removal between the sizing and blotting stages, and allows recapitulation of binding affinity for proteins after SDS sizing. Subsequent antibody probing of lectin-captured glycosylated proteins (labeled or unlabeled) is feasible and would yield a lectin-glycoprotein-antibody sandwich reporting protein size, glycosylation status, and immunoreactivity23. While the targeted proteomic assay detailed here has been developed for analysis of IgA1, the assay format makes both operational (separation field strength, buffer constituents) and device (separation length, separation gel pore-size distribution, geometry and length scales of flanking arrays) parameters24 readily adjustable to other assays of interest. Analysis of purified and fluorescently labeled targets enabled performance characterization during development (i.e., total assay losses and the on-chip renaturation process), application to unlabeled and crude samples is promising and currently underway. Previous studies have demonstrated compatible formats for onchip sandwich probing with free-labeling of antigen targets and robust analysis of minimally processed complex biological fluids (i.e., serum, tear fluid, and saliva), thus pointing to maturation paths for total integration of sample preparation25. Multiplexing and throughput scale up – both in parallel and serial workflows – is also under development23. The assay and device advances detailed in the present study form a foundation for maturation of the approach to aid in investigation of a diverse set of diseases where glycosylation is suspected of playing an important role.
Supplementary Material
ACKNOWLEDGMENT
The authors acknowledge financial support from the UC Discovery program and the Industry-University Cooperative Research Program (IUCRP). Partial infrastructure support was provided by the QB3 Biomolecular Nanofabrication Center (BNC). JN and BAJ were supported in part by NIH grants DK078244, DK082753, DK083663, DK075868, GM098539, and DK071802. AEH is an Alfred P. Sloan Research Fellow (chemistry).
Footnotes
ASSOCIATED CONTENT
Supporting Information. The PA gel photopatterning, assay protocol, online renaturation profiling, and sample preparation are detailed. A movie of three-directional assay process was included. See complete Ref. 7(b) in supporting information. This material is available free of charge via the Internet at http://pubs.acs.org.
REFERENCES
- (1).Fuster MM, Esko JD. Nat. Rev. Cancer. 2005;5:526–542. doi: 10.1038/nrc1649. [DOI] [PubMed] [Google Scholar]
- (2).Reis CA, Osorio H, Silva L, Gomes C, David L. J. Clin. Pathol. 2010;63:322. doi: 10.1136/jcp.2009.071035. [DOI] [PubMed] [Google Scholar]
- (3).Lebrilla CB, An HJ. Mol. BioSyst. 2009;5:17. doi: 10.1039/b811781k. [DOI] [PubMed] [Google Scholar]
- (4).Hirabayashi J. J. Biochem. 2008;144:139. doi: 10.1093/jb/mvn043. [DOI] [PubMed] [Google Scholar]
- (5).(a) Pilobello KT, Slawek D, Mahal LK. Proc. Natl. Acad. Sci. Vol. 104. USA: 2007. p. 10534. [DOI] [PMC free article] [PubMed] [Google Scholar]; (b) Kuno A, Uchiyama N, Koseki-Kuno S, Ebe Y, Takashima S, Yamada M, Hirabayashi J. Nat. Methods. 2005;2:851–856. doi: 10.1038/nmeth803. [DOI] [PubMed] [Google Scholar]
- (6).Bosques CJ, Raguram S, Sasisekharan R. Nat. Biotechnol. 2006;24:1100. doi: 10.1038/nbt0906-1100. [DOI] [PubMed] [Google Scholar]
- (7).(a) Anderson GJ, Cipolla CM, Kennedy RT. Anal. Chem. 2011;83:1350. doi: 10.1021/ac102671n. [DOI] [PMC free article] [PubMed] [Google Scholar]; (b) O’Neill RA, et al. Proc. Natl. Acad. Sci. USA. 2006;103:16153. [Google Scholar]; (c) Lu JJ, Zhu Z, Wang W, Liu S. Anal. Chem. 2011;83:1784. doi: 10.1021/ac103148k. [DOI] [PMC free article] [PubMed] [Google Scholar]
- (8).Pan W, Chen W, Jiang X. Anal. Chem. 2010;82:3974. doi: 10.1021/ac1000493. [DOI] [PubMed] [Google Scholar]
- (9).(a) He M, Herr AE. J. Am. Chem. Soc. 2010;132:2512. doi: 10.1021/ja910164d. [DOI] [PubMed] [Google Scholar]; (b) He M, Herr AE. Nat. Protoc. 2010;5:1844. doi: 10.1038/nprot.2010.142. [DOI] [PubMed] [Google Scholar]
- (10).Kuizenga A, Haeringen AJV, Kijlstra A. Invest. Ophthalmol. Vis. Sci. 1991;32:3277. [PubMed] [Google Scholar]
- (11).Jaenicke R. Angew. Chem. Int. Ed. 1984;23:395. [Google Scholar]
- (12).Walker JM. The protein protocols handbook. Humana Press; 2002. pp. 779–793. Part VI. [Google Scholar]
- (13).(a) Kondapalli S, Kirby BJ. Microfluid. Nanofluid. 2009;7:275. [Google Scholar]; (b) Zaccai NR, Yunus K, Matthews SM, Fisher AC, Falconer RJ. Eur. Biophys. J. 2007;36:581. doi: 10.1007/s00249-006-0125-z. [DOI] [PubMed] [Google Scholar]; (c) Yamaguchi H, Miyazaki M, Briones-Nagata MP, Maeda H. J. Biochem. 2010;147:895. doi: 10.1093/jb/mvq024. [DOI] [PubMed] [Google Scholar]
- (14).Propheter DC, Hsu K, Mahal LK. ChemBioChem. 2010;11:1203. doi: 10.1002/cbic.201000106. [DOI] [PubMed] [Google Scholar]
- (15).Bales BL, Messina L, Vidal A, Peric M. J. Phys. Chem. B. 1998;102:10347. [Google Scholar]
- (16).Takeda K, Sasaokaa H, Sasab K, Hiraia H, Hachiya K, Moriyama Y. J. Colloid Interface Sci. 1992;154:385. [Google Scholar]
- (17).Enoki S, Saeki K, Maki K, Kuwajima K. Biochemistry. 2004;43:14238. doi: 10.1021/bi048733+. [DOI] [PubMed] [Google Scholar]
- (18).Pédelacq J, Cabantous S, Tran T, Terwilliger TC, Waldo GS. Nat. Biotechnol. 2006;24:79. doi: 10.1038/nbt1172. [DOI] [PubMed] [Google Scholar]
- (19).Murphy RE, Schure MR, Foley JP. Anal. Chem. 1998;70:1585. [Google Scholar]
- (20).Suzuki H, Moldoveanu Z, Hall S, Brown R, Vu HL, Novak L, Julian BA, Tomana M, Wyatt RJ, Edberg JE, Alarcón GS, Kimberly RP, Tomino Y, Mestecky J, Novak J. J. Clin. Invest. 2008;118:629–639. doi: 10.1172/JCI33189. [DOI] [PMC free article] [PubMed] [Google Scholar]
- (21).Moore JS, Kulhavy R, Tomana M, Moldoveanu Z, Suzuki H, Brown R, Hall S, Kilian M, Poulsen K, Mestecky J, Julian BA, Novak J. Mol. Immunol. 2007;44:2598. doi: 10.1016/j.molimm.2006.12.011. [DOI] [PMC free article] [PubMed] [Google Scholar]
- (22).Jones C, Mrmelstein N, Smith PK, Powell H, Roberton D. Clin. Exp. Immunol. 1988;72:344. [PMC free article] [PubMed] [Google Scholar]
- (23).Tia SM, He M, Kim D, Herr AE. Anal.Chem. 2011;83:3581. doi: 10.1021/ac200322z. [DOI] [PubMed] [Google Scholar]
- (24).Lerch MA, Hoffman MD, Jacobson SC. Lab Chip. 2008;8:316. doi: 10.1039/b713500a. [DOI] [PubMed] [Google Scholar]
- (25).(a) Yamada M, Mao P, Fu J, Han J. Anal. Chem. 2009;81:7067. doi: 10.1021/ac901226z. [DOI] [PMC free article] [PubMed] [Google Scholar]; (b) Karns K, Herr AE. Anal. Chem. 2011 doi: 10.1021/ac202061v. ASAP. [DOI] [PubMed] [Google Scholar]; (c) Herr AE, Hatch AV, Throckmorton DJ, Tran HM, Brennan JS, Giannobile WV, Singh AK. Proc Natl Acad Sci USA. 2007;104:5268. doi: 10.1073/pnas.0607254104. [DOI] [PMC free article] [PubMed] [Google Scholar]
Associated Data
This section collects any data citations, data availability statements, or supplementary materials included in this article.


