Abstract
We report the demonstration of an optofluidic surface enhanced Raman spectroscopy (SERS) device that leverages a nanoporous microfluidic matrix to improve the SERS detection performance by more than two orders of magnitude as compared to a typical open microfluidic channel. Although it is a growing trend to integrate optical biosensors into microfluidic channels, this basic combination has been detrimental to the sensing performance when applied to SERS. Recently, however, synergistic combinations between microfluidic functions and photonics (i.e., optofluidics) have been implemented that improve the detection performance of SERS. Conceptually, the simplest optofluidic SERS techniques reported to date utilize a single nanofluidic channel to trap nanoparticle-analyte conjugates as a method of preconcentration before detection. In this work, we leverage this paradigm while improving upon the simplicity by forming a 3D nanofluidic network with packed nanoporous silica microspheres in a microfluidic channel; this creates a concentration matrix that traps silver nanoclusters and adsorbed analytes into the SERS detection volume. With this approach, we are able to achieve a detection limit of 400 attomoles of Rhodamine 6G after only 2 min of sample loading with high chip-to-chip repeatability. Due to the high number of fluidic paths in the nanoporous channel, this approach is less prone to clogging than single nanofluidic inlets, and the loading time is decreased compared to previous reports. In addition, fabrication of this microsystem is quite simple, as nanoscale fabrication is not necessary. Finally, integrated multimode fiber optic cables eliminate the need for optical alignment, and thus the device is relevant for portable and automated applications in the field, including point-of-sample and point-of-care detection. To illustrate a relevant field-based application, we demonstrate the detection of 12 ppb of the organophosphate malathion in water using the nanofluidic SERS microsystem.
INTRODUCTION
Surface enhanced Raman spectroscopy (SERS) has proven to be a powerful tool for chemical and biomolecule detection. In this technique, noble metal nanostructures or nanoparticles provide a tremendous enhancement to the Raman scattering process.1, 2, 3, 4, 5 This enhancement can be up to 14 orders of magnitude, which places the sensitivity of SERS at a comparable level to the sensitivity of fluorescence-based detection.6 In fact, single molecule identification using SERS was reported over a decade ago.6, 7, 8, 9 In contrast to fluorescence-based detection, SERS detection produces a fingerprint spectrum of the detected analyte, which enables molecules to be detected without labelling. Furthermore, this narrowband spectral fingerprint enables multi-analyte detection with a single laser source and filter set,10 which is generally not feasible using fluorescence detection.
Nonetheless, SERS continues to be limited to applications in research labs today. An emerging trend to enable practical applications of SERS is to integrate photonic-based detection into a microfluidic system. However, in the case of SERS, this can hurt the detection limit as compared to conventional techniques because of the reduced sample volume and the diffusion-limited transport of analyte molecules within the channel.10, 11 To overcome these barriers, a number of reports have demonstrated improved performance of SERS in microsystems by leveraging the principles of optofluidics, which is defined by the synergistic integration of photonics and microfluidics.12, 13, 14, 15 In one example of an optofluidic SERS technique, photonic crystal waveguides maximize the interaction of the excitation laser light with nanoparticle-analyte conjugates.16, 17, 18 In another form of optofluidic SERS, active concentration of the nanoparticle-analyte conjugates into the SERS detection volume has been demonstrated using a number of methods, including a spinning microfluidic compact disk platform,19 electro-kinetic forces across a microfluidic channel,20, 21, 22 and magnetic concentration of nanostructured silver-coated microbeads in a microfluidic channel.23
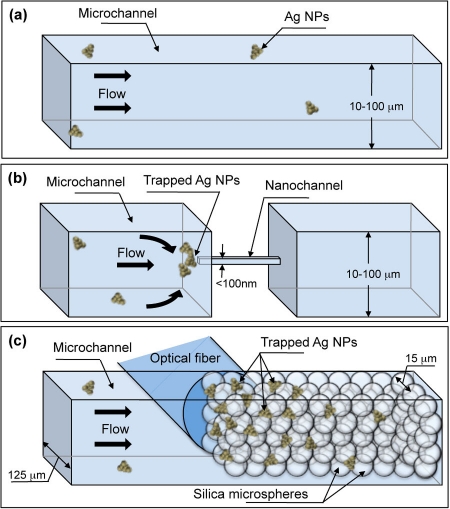
A simpler optofluidic SERS approach is to employ a fluidic design that passively concentrates analyte-nanoparticle conjugates into the detection volume. Nanoparticles and adsorbed/bound analyte in the sample are concentrated as they flow into the channel; there is no need for additional active components in the device to concentrate the sample. Figure 1b illustrates this concentration effect at the nanofluidic channel inlet; this effect is contrasted with an open microfluidic channel in Fig. 1a, in which no concentration occurs and thus the number of SERS-active regions in the detection volume at any given moment is relatively low. Passive concentration has been accomplished by fabricating a single nanofluidic channel to accumulate nanoparticle-analyte conjugates.24, 25, 26 These reports show excellent detection performance. However, transport through a single nanochannel potentially limits the throughput and creates opportunities for clogging the channel. Moreover, fabrication of a single nanochannel is complex and may not be as repeatable as typical microfabrication.
Figure 1.
Nanofluidic trapping vs. open-channel microfluidics. (a) In an open channel, nanoparticles are poorly concentrated. (b) A nanochannel traps silver nanoparticles (Ag NPs) into the detection volume. (c) Packed silica spheres form a nanofluidic matrix, which is capable of trapping a high number of Ag NPs into a relatively large detection volume without clogging. An optical fiber can be aligned to the nanoporous matrix.
In this work, we utilize a three-dimensional nanoporous matrix to concentrate silver nanoparticles with adsorbed analyte molecules for SERS detection. The concept is illustrated in Fig. 1c. This device is simpler and more robust to create, as nanofabrication is not required. A microchannel is partially packed by nanoporous silica microspheres against a narrowing section of the microfluidic channel. As the sample is loaded through the nanoporous matrix, analyte-nanoparticle conjugates are trapped, leading to an increase in the number of SERS-active hot spots and analyte molecules in the detection volume (Fig. 1c), which results in an increased Raman signal. Numerous nanoporous channels, inherently created within the matrix of packed silica microspheres, enable high throughput and reduced sample-loading time as compared to a single nanochannel. Moreover, the 3D nanoporous matrix is less prone to clogging due to the high number of available nanochannels within the matrix. Additionally, our design incorporates integrated fiber optic cables. Two channels are created for locating the fiber optic cables into the device, aligned to the detection volume. By using large-core multimode fiber optic cables, we create a relatively large detection volume as compared to typical microfluidic SERS devices. This greatly improves the chip-to-chip detection repeatability of the device because a large number of nanoclusters are concentrated into the detection volume, which decreases the randomness that is historically associated with SERS-based sensors that rely on a small detection volume. Furthermore, as a result of integrating fiber optic cables, the device requires no optical alignment, which can lead to portable applications and on-site detection.
EXPERIMENTAL
Materials
Silicon wafers were purchased from University Wafer (South Boston, MA). AZ 4620 photoresist from AZ electronic materials (Branchbug, NJ) was used to pattern and mask the wafer for deep reactive ion etching (DRIE). Sylgard 184 was acquired from Dow Coring (Midland, MI) and used to create polydimethylsiloxane (PDMS) devices in the standard 10:1 ratio. Tridecafluoro-1,1,2,2-tetrahydrooctyl-1-trichlorosilane was purchased from Pflatz and Bauer (Waterbury, CT). Porous silica microspheres (15 μm diameter, 6 nm pore size) were obtained from Kisker Biotech GmbH & Co. (Steinfurt, Germany) to form the nanoporous matrix. Silver nitrate, sodium citrate, and trizma base were obtained from Sigma-Aldrich (St. Louis, MO). Rhodamine 590 chloride, also known as Rhodamine 6G (R6G), was purchased from Exciton (Dayton, OH). Malathion was purchased from Cerilliant (Round rock, TX). All materials were used as received.
Preparation of silver colloid
Silver nanoparticles were synthesized by the commonly used method of Lee and Meisel.27 Briefly, 90 mg of silver nitrate was added to 500 ml of deionized water. The solution was heated in a flask while stirring. Upon boiling, sodium citrate (100 mg) was added, and the solution was boiled for 10 min. After the color of the solution became greenish brown, it was removed from heat. 10 mM Tris-HCl (pH 8.2) was added to the silver nanoparticle solution to promote aggregation before running each experiment. To determine the nanoparticle size and clustering density, the colloid was dried onto a wafer and imaged with a scanning electron microscope (SEM). According to the images, the typical silver nanoparticle size is 50 nm, and typical clusters contain tens of nanoparticles.
Fabrication of the optofluidic device
The PDMS microfluidic device was fabricated with typical soft lithography methods. PDMS is selected for the optofluidic device because of its optical transparency and low auto-fluorescence.28, 29 A silicon wafer was patterned using standard photolithography and channels were etched by DRIE to a depth of 125 μm. AZ 4620 photoresist was selected as the mask during DRIE because of its relatively high thickness. The channel height is set to be 125 μm to match the standard size of fiber optic cables. PDMS was cast onto the silicon wafer following vapor-phase silanization with fluoro-silane. After casting PDMS, vacuum was applied to remove air bubbles; the PDMS was then cured at 60 °C for 4 h. Finally, the PDMS channels were sealed onto a piranha-cleaned glass substrate through corona treatment and stored overnight at 60 °C.
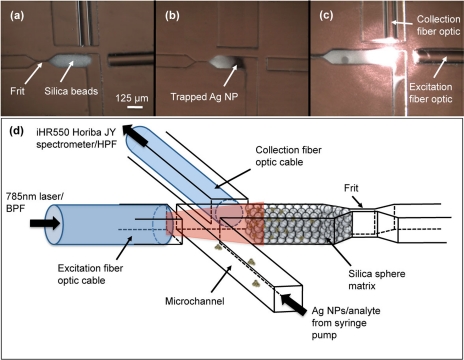
Micrographs of the assembled device are presented in Fig. 2. To trap silica spheres, a frit structure is designed into the channel. The 125 μm channel narrows to a width of 7 μm at the frit (this is thinner than necessary; we designed it as thin as possible to enable us to attempt a range of silica sphere sizes). The 15 μm silica microspheres were diluted in deionized water to 5 mg/ml. A 1 μl droplet of silica microspheres was placed at the channel inlet and the vacuum was applied from the outlet. This volume has been selected because it packs the microspheres just within the detection volume, as shown in Fig. 2. Chips were used within 1 day of assembly.
Figure 2.
(a) Micrograph showing packed microspheres and integrated fiber optic cables. (b) Silver nanoparticles (AgNPs) are trapped in the silica microsphere matrix. (c) Excitation and collection is performed by integrated fiber optic cables. (d) Experimental setup: the sample is loaded with a syringe pump. The fiber optic cables are connected to a diode laser and a Raman spectrometer.
Two multimode fiber optic cables (Thorlabs, Newton, NJ) were inserted into the device through channels created for this purpose. The fiber optic cables have a 105 μm core diameter and a 125 μm cladding diameter; the ends of the fibers were cleaved (Fujikura CT-04B fiber optic cleaver) to minimize light scattering. The distance from the fiber optic tips to the detection zone in the microfluidic channel was set to be 80 μm; this is the minimum distance that can prevent sample leakage from the microfluidic channel into the fiber optic channels.
Scanning electron microscopy
We recorded SEM images of silver nanoparticles in the matrix of silica microspheres. Silica microspheres were packed into the microfluidic channel and then the silver colloid (described above) was loaded into the channel. The PDMS was then peeled from the glass base; the packed microspheres remained in the channel. Carbon was sputtered onto the device, including the exposed beads in the channel.
SERS measurements
One of the integrated fiber optic cables carries excitation light from a diode laser (785 nm, 15 mW, Ocean Optics, Dunedin, FL), while the other collects the Raman-scattered photons (Fig. 2d). Different angles between the two fiber optic cables (from 0° to 180°) were investigated using various device designs to optimize the collection of Raman photons; 90° proved to be the most efficient angle, which is in agreement with a previous report by Ashok et al.30 As illustrated in Fig. 2d, excitation and collection fiber optics were connected, respectively, to the 785 nm diode laser and the Raman spectrometer (iHR550 Horiba JY). A band pass filter and a high pass filter (Omega Optical, Brattleboro, VT) used to reduce the optical background were located at the excitation and collection, respectively. For each experiment, the aggregated silver nanoparticles were mixed with selected concentrations of R6G for 15 min. The solution was then introduced into the channel at a flow rate of 2 μl/min for 2 min (consuming 4 μl) using a digital syringe pump (Fischer Scientific, Inc.). R6G concentrations of 100 pM, 1 nM, 10 nM, and 100 nM were each tested on three devices. A 1-s exposure time was used for 10 nM and 100 nM R6G. For the two lower concentrations, a 5-s exposure time was used. In all cases, the software automatically translated the measured optical intensity to counts/second. SERS measurements were also performed in the microsystem using the organophosphate malathion. Malathion was diluted in silver colloid solution down to 12 ppb and introduced into the channel at a flow rate of 2 μl/min for 5 min. A 5-s exposure time was used to collect Raman scattered photons.
RESULTS AND DISCUSSION
A micrograph of the trapped microspheres within the microfluidic channel is shown in Fig. 2a. The packed porous silica microspheres act as a three-dimensional nanoporous matrix to concentrate silver nanoparticles and adsorbed analyte molecules. Figure 2b shows the silica matrix after loading silver nanoparticles into the channel; the darkened region is the trapped nanoparticles. Scattered light from the microsphere matrix due to the excitation light from the fiber optic cable is shown in Fig. 2c.
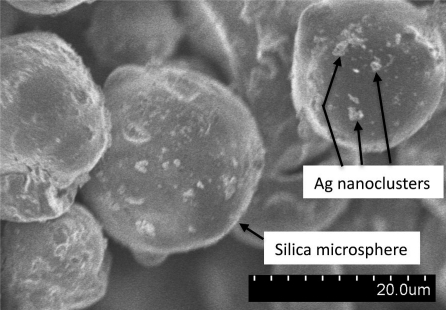
An SEM of the silica microsphere matrix inside the channel is presented in Fig. 3. As shown in the micrograph, silver nanoclusters are coating the surface of the silica beads with relatively high density. The clusters range in size from a few nanoparticles to a few tens of nanoparticles or on the order of 100 nm–1 μm. It is clear from this image that a relatively large number of SERS-active hot spots exist within the detection region as compared to the case of an open-channel system (i.e., Fig. 1c versus Fig. 1a).
Figure 3.
SEM micrograph of the silica microspheres packed into the microfluidic channel after running silver nanoclusters through the channel. The bright spots on the silica spheres are silver nanoclusters that became trapped in the matrix.
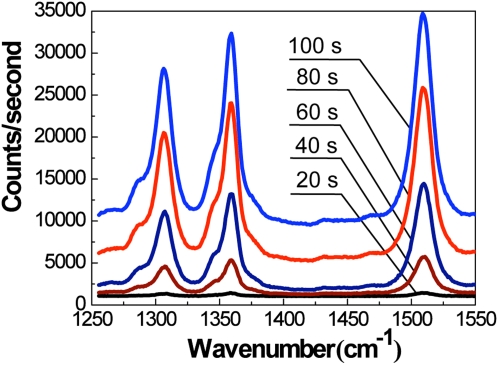
To illustrate the capability of the device to effectively concentrate silver nanoparticles and adsorbed analyte, we recorded the Raman spectra at 20-s time intervals while loading the sample (Fig. 4). The well known Raman peaks of R6G at 1310, 1363, and 1509 cm−1 are visible after only a few seconds of loading; within 2 min, the R6G spectral bands increase dramatically.
Figure 4.
Time-dependent accumulation of SERS signal as silver nanoparticles with adsorbed R6G are trapped and concentrated within the nanofluidic matrix. R6G concentration in colloid = 100 nM. Spectra are shifted vertically for visual clarity.
After 2 min of sample loading time, the signal exhibits saturation; even after 15 min of sample loading, the signal did not increase further. Thus, 2 min was determined to be the optimal sample loading time for the parameters used here. In all subsequent experiments with R6G, the sample is loaded for 2 min before the measurements are taken.
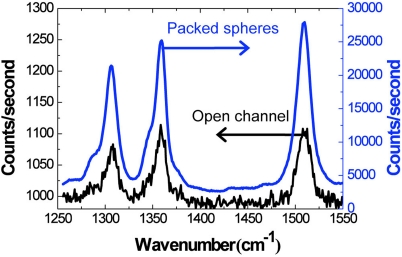
Intuitively, the trapping of silver nanoparticles with adsorbed R6G molecules provides a performance improvement as compared to an open microfluidic channel because of the increase in the number of analyte molecules in SERS-active hot spots within the detection volume. To quantify the performance increase as compared to open-channel microfluidic SERS, the respective spectra of 100 nM R6G in silver colloid were measured in an open microfluidic channel and in the packed-microsphere matrix. In both cases, the sample was loaded for 2 min at 2 μl/min. As shown in Fig. 5, the signal is more than 250 times stronger when using the packed microsphere matrix due to accumulation of analyte molecules and the additional formation of hot spots.
Figure 5.
Within the nanoporous matrix, the SERS signal is greater than 250 times more intense as compared to the open channel. R6G concentration in colloid = 100 nM.
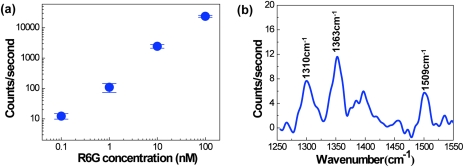
To determine the detection limit, the chip-to-chip repeatability, and the quantitative capabilities of the SERS device, we loaded various concentrations of R6G (100 pM–100 nM) in silver colloid into packed-microsphere matrices for 2 min. Each concentration test was performed on three separate chips. Figure 6 displays the mean intensity and standard deviation of the 1509 cm−1 Raman peak for each concentration of R6G. The Raman intensity is linearly proportional to the R6G concentration as depicted in Fig. 6a. The linear trend and the low standard deviation demonstrate that this optofluidic SERS device is repeatable and can be utilized for quantitative detection of analytes. The high chip-to-chip repeatability is likely a result of the use of integrated multimode fiber optic cables. A high number of silver nanoclusters are concentrated into the relatively large detection volume defined by the fiber optic cables, which reduces the statistical variation that is common for SERS techniques that use a small detection area or volume. Furthermore, the integrated fiber optic cables ensure that the detection volume is exactly the same from chip to chip and measurement to measurement; this may not be the case for measurements with typical Raman microscopes, which require manual focusing and alignment.
Figure 6.
(a) Mean intensity of the 1509 cm−1 Raman peak for various R6G concentrations. Error bars represent standard deviation, N = 3. (b) Measured SERS signal after 4 μl of 100 pM R6G (400 attomoles) is loaded into the microchannel.
The recorded Raman spectrum for a concentration of 100 pM R6G is presented in Fig. 6b. The sample was loaded at 2 μl/min for 2 min, which implies that only 400 attomoles of R6G molecules were loaded into the device. Nonetheless, the 1310, 1363, and 1509 cm−1 Raman peaks are clearly visible in the recorded spectra. Thus, we can conclude that the use of the nanoporous channel results in a detection limit of 400 attomoles of R6G in silver colloid solution.
Although R6G is a common model analyte for characterizing the performance of SERS analytical devices, it may not be representative of typical analytes that must be detected in practical measurements. R6G is positively charged in water, causing it to readily adsorb to negatively charged silver nanostructures; additionally, it has a large Raman scattering cross section. To demonstrate the use of the nanofluidic device studied in this work for practical samples, we detected the pesticide malathion in water. Malathion is a widely used organophosphate insecticide that can contaminate waterways after application in agricultural areas.
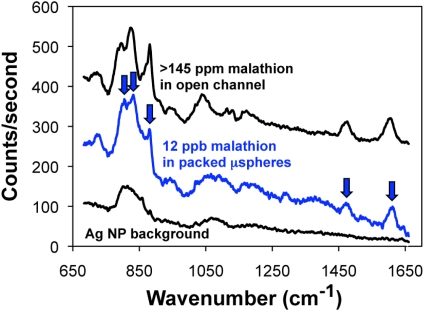
Figure 7 presents the malathion detection results in the microsystem. For an open microfluidic channel, we had to exceed the solubility of malathion in water (145 ppm) before we could detect a SERS signal (i.e., no signal was detected for less than 145 ppm). This is a drastic reduction in performance as compared to the result for R6G in an open microfluidic channel (Fig. 5), in which less than 100 nM (47 ppb) can be detected. This difference in detection performance is due to malathion’s lower affinity for the silver nanocluster surfaces and its decreased Raman cross-section.
Figure 7.
Recorded SERS spectra for greater than 145 ppm malathion in water (the solubility limit) in an open microfluidic channel and for 12 ppb malathion in water in the 3D nanofluidic channel. Arrows indicate the Raman peaks for malathion. The background signal is also shown to enable the clear identification of the malathion Raman peaks.
However, our nanofluidic device recorded a SERS signal with only 12 ppb malathion in water after loading only 10 μl of sample. The SERS signal for 12 ppb malathion in the nanofluidic channel is similar in intensity to the signal for greater than 145 ppm in the open microfluidic channel. This result demonstrates that the nanofluidic SERS microsystem enables detection of the popular insecticide malathion, which is not detectable under practical conditions in a traditional microfluidic SERS device.
CONCLUSION
Collectively, the results presented here demonstrate that our easily fabricated optofluidic SERS device has a significantly improved performance as compared to conventional microfluidic SERS approaches. The nanoporous matrix provides greater than two orders of magnitude signal enhancement due to sample concentration after only a few minutes of loading. This enables a detection limit of 100 pM R6G, even with only 4 μl of sample volume (i.e., 400 attomoles of analyte loaded into the microchannel). Furthermore, the device shows high linearity over a wide range of sample concentrations, and the measured results are highly repeatable from chip-to-chip. In addition, the three-dimensional nanoporous matrix exhibits stable fluidic transport; it was observed that the silver colloid solution could be loaded through the matrix of silica microspheres for hours without clogging, which shows its capability to be used in assays requiring long reaction times. Finally, the use of a laser diode and alignment-free integrated fiber optic cables implies the potential for the device to be used in portable applications in the field. To illustrate one possible application for field-based SERS analysis in our microsystem, we detected the popular organophosphate insecticide malathion in water down to a concentration of 12 ppb.
There are a number of opportunities for improvement of our optofluidic SERS device that can be pursued in the immediate future. First, the simple fabrication and the reliable, clog-free performance of the nanofluidic matrix implies that it can be integrated with other microfluidic functions such as on-chip mixing and on-chip silver nanoparticle synthesis as a part of a lab-on-a-chip to improve sensitivity and automation. Second, the potential exists to combine the enhancement of the nanofluidic trapping with optical resonance, which can increase the optical intensity. In this work, commercially available porous silica microspheres were used. Instead, solid silica spheres of similar size (15 μm) can be fabricated and used as the trapping matrix; these spheres may exhibit resonant whispering gallery modes, which would result in high optical intensities at the microsphere surfaces where the nanoparticle-analyte conjugates are trapped. These improvements, coupled with commercially available higher-power laser sources, offer the potential to drive the detection limit of our optofluidic device into the zeptomole range.
ACKNOWLEDGMENTS
Funding for this work was provided by the National Institute for Biomedical Imaging and Bioengineering (5K25EB006011). The authors also acknowledge the support of the Maryland NanoCenter and its NispLab for the use of the Hitachi SU-70 Analytical UHR FEG-SEM. The NispLab is supported in part by the NSF as a MRSEC Shared Experimental Facility.
References
- Albrecht M. G. and Creighton J. A., J. Am. Chem. Soc. 99, 5215 (1977). 10.1021/ja00457a071 [DOI] [Google Scholar]
- Jeanmaire D. L. and Van Duyne R. P., J. Electroanal. Chem. 84, 1 (1977). 10.1016/S0022-0728(77)80224-6 [DOI] [Google Scholar]
- Moskovits M., J. Chem. Phys. 69, 4159 (1978). 10.1063/1.437095 [DOI] [Google Scholar]
- Moskovits M., Rev. Mod. Phys. 57, 783 (1985). 10.1103/RevModPhys.57.783 [DOI] [Google Scholar]
- Kneipp K., Kneipp H., Itzkan I., Dasari R. R., and Feld M. S., Chem. Rev. 99, 2957 (1999). 10.1021/cr980133r [DOI] [PubMed] [Google Scholar]
- Nie S. and Emory Sr., Science 275, 1102 (1997). 10.1126/science.275.5303.1102 [DOI] [PubMed] [Google Scholar]
- Kneipp K., Wang Y., Kneipp H., Perelman L., Itzkan I., Dasari R., and Feld M., Phys. Rev. Lett. 78, 1667 (1997). 10.1103/PhysRevLett.78.1667 [DOI] [PubMed] [Google Scholar]
- Kneipp K., Kneipp H., Kartha V., Manoharan R., Deinum G., Itzkan I., Dasari R., and Feld M., Phys. Rev. E 57, R6281 (1998). 10.1103/PhysRevE.57.R6281 [DOI] [Google Scholar]
- Michaels A. M., Nirmal M., and Brus L. E., J. Am. Chem. Soc. 121, 9932 (1999). 10.1021/ja992128q [DOI] [Google Scholar]
- Schwarz M. and Hauser P. C., Lab Chip 1, 1 (2001). 10.1039/b103795c [DOI] [PubMed] [Google Scholar]
- Chen L. and Choo J., Electrophoresis 29, 1815 (2008). 10.1002/elps.v29:9 [DOI] [PubMed] [Google Scholar]
- Psaltis D., Quake S. R., and Yang C., Nature 442, 381 (2006). 10.1038/nature05060 [DOI] [PubMed] [Google Scholar]
- Monat C., Domachuk P., and Eggleton B. J., Nature Photon. 1, 106 (2007). 10.1038/nphoton.2006.96 [DOI] [Google Scholar]
- Optofluidics: Fundamentals, Devices, and Applications, edited by Fainman Y., Lee L., Psaltis D., and Yang C. (McGraw-Hill, New York, 2010). [Google Scholar]
- Handbook of Optofluidics, edited by Hawkins A. R. and Schmidt H. (CRC, Boca Raton, 2010). [Google Scholar]
- Measor P., Seballos L., Yin D., Zhang J. Z., Lunt E. J., Hawkins A. R., and Schmidt H., Appl. Phys. Lett. 90, 211107 (2007). 10.1063/1.2742287 [DOI] [Google Scholar]
- Khaing Oo M. K., Han Y., Kanka J., Sukhishvili S., and Du H., Opt. Lett. 35, 466 (2010). 10.1364/OL.35.000466 [DOI] [PubMed] [Google Scholar]
- Yang X., Shi C., Wheeler D., Newhouse R., Chen B., Zhang J. Z., and Gu C., J. Opt. Soc. Am. A 27, 977 (2010). 10.1364/JOSAA.27.000977 [DOI] [PubMed] [Google Scholar]
- Choi D., Kang T., Cho H., Choi Y., and Lee L. P., Lab Chip 9, 239 (2009). 10.1039/b812067f [DOI] [PubMed] [Google Scholar]
- Huh Y. S., Chung A. J., Cordovez G., and Erickson D., Lab Chip 9, 433 (2009). 10.1039/b809702j [DOI] [PMC free article] [PubMed] [Google Scholar]
- Cho H., Lee B., Liu G. L., Agarwal A., and Lee L. P., Lab Chip 9, 3360 (2009). 10.1039/b912076a [DOI] [PubMed] [Google Scholar]
- Chrimes A. F., Kayani A. A., Khoshmanesh K., Stoddart P. R., Mulvaney P., Mitchella A., and Kalantar-zadeh K., Lab Chip 11, 921 (2011). 10.1039/c0lc00481b [DOI] [PubMed] [Google Scholar]
- Han B., Choi N., Kim K. H., Lim D. W., and Choo J., J. Phys. Chem. C 115, 6290 (2011). 10.1021/jp112265e [DOI] [Google Scholar]
- Wang M., Jing N., Chou I.-H., Cote G. L., and Kameoka J., Lab Chip 7, 630 (2007). 10.1039/b618105h [DOI] [PubMed] [Google Scholar]
- Park S-M., Huh Y. S., Craighead H. G., and Erickson D., Proc. Natl. Acad. Sci. 106, 15549 (2009). 10.1073/pnas.0904004106 [DOI] [PMC free article] [PubMed] [Google Scholar]
- Choi I., Huh Y. S., and Erickson D., Lab Chip 11, 632 (2011). 10.1039/c0lc00383b [DOI] [PubMed] [Google Scholar]
- Lee P. C. and Meisel D., J. Phys. Chem. 86, 3391 (1982). 10.1021/j100214a025 [DOI] [Google Scholar]
- Ng J. M. K., Gitlin I., Stroock A. D., and Whitesides G. M., Electrophoresis 23, 3461 (2002). [DOI] [PubMed] [Google Scholar]
- McDonald J. C., Duffy D. C., Anderson J. R., Chiu D. T., Wu H., Schueller O. J. A., and Whitesides G. M., Electrophoresis 21, 27 (2000). [DOI] [PubMed] [Google Scholar]
- Ashok P. C., Singh G. P., Rendall H., Krauss T. F., and Dholakia K., Lab Chip 11, 1262 (2011). 10.1039/c0lc00462f [DOI] [PubMed] [Google Scholar]


