

Abstract
Cachexia is a severe muscle-wasting syndrome associated with several chronic diseases such as cancer and AIDS. Muscle mass loss significantly decreases prognosis and survival. The mechanisms of muscle atrophy and the specific proteins targeted for degradation have been intensely studied and are potential therapeutic targets. Published reports that myosin heavy chain (MyHC), the most abundant protein by mass in skeletal muscle, is selectively targeted for degradation in cancer cachexia remain controversial. Here we show that the results of previous studies showing a selective decrease in MyHC are likely an artifact resulting from muscle lysis methods which do not solubilize myosin out of myofibrils. We show that MyHC decreases in parallel with other myofibrillar proteins in cachectic skeletal muscle, which has mechanistic and therapeutic implications. These findings should lead to mechanistic insight into the stoichiometry of sarcomeric disassembly and degradation during cancer cachexia.
Introduction
Muscle comprises 40% of the human body and is an important amino acid reservoir during times of starvation and disease. Muscle protein breakdown is initially beneficial to the organism because it provides the liver with amino acids for gluconeogenesis and acute phase protein synthesis, and serves as an energy source for other cell types.1 However, chronic muscle catabolism is detrimental and causes profound muscle weakness and fatigue, decreased respiratory function, decreased overall prognosis, and increased mortality.2 Accelerated skeletal muscle mass loss in the context of disease is known as cachexia, which occurs in patients with chronic heart failure, AIDS, and cancer. Approximately one-half of cancer patients suffer from cachexia and it contributes to greater than one-third of cancer deaths.2
Myofibrillar proteins comprise at least 60% of all muscle proteins, and they decrease significantly in both humans and rodents with cachexia.3, 4 Myosin is the motor component of muscle and causes contraction upon actin binding and ATP hydrolysis. Each myosin molecule is composed of two heavy chains and four light chains. Myosin heavy chain (MyHC) contains three protein domains: the head, neck, and rod. The N-terminal head domain is globular, has ATPase activity, and associates with actin. There is a short α-helical neck region that extends from the head and binds the myosin light chains. This neck extends into the rod domain, which is the highly conserved C-terminal portion of the molecule, and is responsible for myosin assembly by dimerizing to form an α–helical coiled-coil.5 The rod is composed of 40 amino acid repeats, each of which is arranged into alternating bands of positive and negative charges leading to differentially charged zones along the outer surface of the rod.6, 7 Electrostatic interactions between oppositely charged portions of two rods likely provide the driving force for assembly of the α–helical coiled-coil and higher order oligomers and filaments. Myosin solubility is therefore dependent on salt concentration, and MyHC assembles into filaments in low ionic strength solutions (≤ 200 mM) and disassembles as ionic strength increases (≥ 300 mM).8, 9
Several groups have shown that MyHC is selectively targeted for degradation in skeletal muscle and is decreased by up to 80% during catabolic conditions, including cancer,10–13 but we were unable to reproduce those results. Selective degradation of MyHC implies a very different mechanism underlying muscle cachexia compared to total myofibrillar degradation and therefore, it is important to consider which of these scenarios is correct. Interestingly, the studies showing a selective decrease in MyHC used very low ionic strength lysis buffers for their MyHC analysis. Low-salt lysis buffers do not solubilize myosin from thick filaments, resulting in artificially low MyHC levels in the soluble fraction (supernatant) of the lysate, and an inaccurate representation of sarcomeric MyHC quantities. We propose that accurate quantification of MyHC can only be achieved when muscles are homogenized in a high-salt (≥ 300 mM) buffer. Using a colon-26 adenocarcinoma mouse model, we show that all myofibrillar proteins decrease in parallel and that MyHC is not selectively degraded in cachectic muscles.
Materials and Methods
Animal studies
CD2F1 male mice (Balb/c × DBA/2, The Jackson Laboratory) were used in the colon-26 adenocarcinoma cachexia (C-26) studies. C-26 (5 × 10⁵ cells in 100 μL PBS) was injected subcutaneously into the right flank of 8-week old mice. Mice were weighed and cervically dislocated 27 days post-tumor cell inoculum. Tissues were rapidly excised, weighed, flash-frozen in liquid nitrogen and stored at −80 °C for further analysis. All animal studies were reviewed and approved by the Institutional Animal Care and Use Committee at the University of Colorado at Boulder.
Muscle homogenization and lysis buffers
For MyHC analysis, muscles were homogenized in myosin extraction buffer (MEB)14 which is composed of 300 mM NaCl, 0.1 M NaH2PO4, 0.05 M Na2HPO4, 0.01 M Na4P2O7, 1 mM MgCl2, 10 mM EDTA, and 1 mM DTT, pH 6.5 and complete protease inhibitor cocktail (Roche). Conventional low-salt lysis buffer (LB) is composed of 50 mM Tris, 150 mM NaCl, 50 mM NaF, 1 mM EDTA, 0.5% Triton X-100, pH 7.5 and complete protease inhibitor cocktail. Lysates were centrifuged at 12,000 rpm for 15 min at 4 °C. The supernatant was removed, and protein concentration determined (Bio-Rad DC protein assay). In certain cases, the insoluble pellet was resuspended in 0.5 M NaOH.
Myofibrillar gels and western blots
Tissue lysates were boiled in SDS loading buffer in order to dissociate individual MyHC molecules from myosin. The myofibrillar resolving gels (10% acrylamide) were stained with Imperial Protein Stain (Thermo Scientific) and scanned and analyzed with ImageJ. Western blots (7.5% acrylamide) were transferred to polyvinylidene difluoride (PVDF) membranes overnight. Primary antibodies were: MyHC (MF20 Developmental Studies Hybridoma Bank, 1:5), α-actin (Sigma clone 5C5). Immunoreactivity was visualized using a Western Lighting chemiluminescence detection system (Perkin Elmer) and quantified using ImageJ. The range of protein for optimal detection of MyHC in MEB lysates is 0.25 – 0.5 μg for immunoblots and 0.5 μg – 1 μg for Coomassie-stained SDS-PAGE gels. The protein range for MyHC detection in LB is 5–10 μg for immunoblots and 20–100 μg for Coomassie-stained SDS-PAGE gels, but this may vary due to variable extraction of myosin in LB.
Data and statistical analysis
Data are presented as mean ± SEM. Differences between groups were evaluated for statistical significance using Student’s t-test. P values less than 0.05 were considered significant.
Results
In order to accurately quantify MyHC in muscle, we first determined the relative solubilities of myosin in conventional low-salt LB (150 mM NaCl) and high-salt MEB (300 mM NaCl) lysis buffers in control tibialis anterior (TA) muscles of mice. It is important to note that we are referring to the extent of myosin extraction from the highly ordered myofibril, not the solubility of the MyHC monomer itself, which dissociates from myosin upon SDS-PAGE analysis. When equal amounts of the soluble fraction (supernatant) from each lysate were loaded, SDS-PAGE revealed that lysis in LB results in 94% less MyHC in the soluble fraction than lysis in MEB (Figure 1A). Because myosin is insoluble in low salt, we reasoned that most of the MyHC would be found in the insoluble (pellet) fraction of the LB lysate. To determine the ratio of MyHC in the soluble vs. insoluble fractions of each buffer, equal amounts of protein were loaded from the supernatant and pellet respectively, on the same SDS-PAGE gel. Muscle lysis in MEB results in 10-fold higher levels of MyHC in the supernatant compared to the pellet (Figure 1B), while lysis in LB results in greater than 5-fold levels of MyHC in the pellet versus the supernatant (Figure 1C). Conventional low-salt buffers therefore solubilize less than 20% of sarcomeric myosin, which agrees with solubility studies in vitro.8 Thus, MyHC levels are not accurately represented in the supernatant fractions of LB lysates, and should be interpreted with caution.
Figure 1.
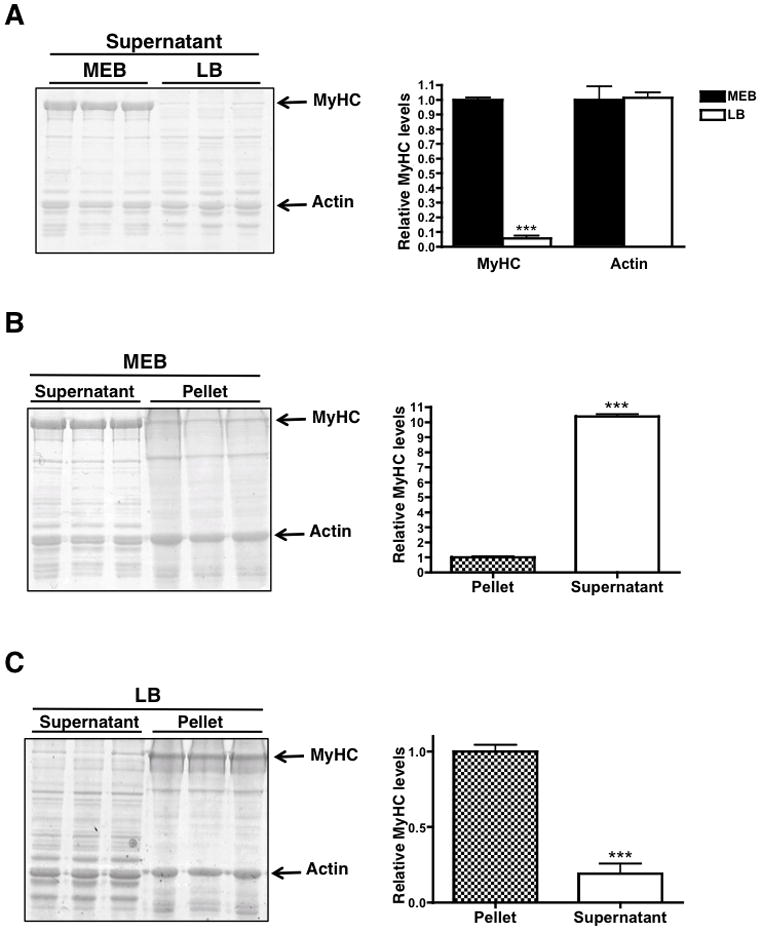
MyHC solubility in high salt myosin extraction buffer (MEB) and low salt lysis buffer (LB). (A) Coomassie-stained myofibrillar gel of the supernatant fraction of tibialis anterior muscle lysed in MEB and LB. 10 μg of protein was loaded for each sample. (B) Coomassie-stained myofibrillar gel of 10 μg of the supernatant and pellet fractions of tibialis anterior muscle lysed in MEB or LB (C). Histograms to the right of each figure represent MyHC and actin quantities in each sample. * p < 0.05, *** p < 0.0001. Graphs are mean ± SEM.
To address the extent of MyHC loss in cachectic muscles, we used a murine colon-26 adenocarcinoma (C-26) model, which induces a rapid and severe cachexia.15 Others have reported that MyHC is selectively decreased in the muscles of C-26 tumor-bearing mice,10 but we were unable to reproduce those results using extracts from muscles lysed in high salt. We therefore determined the effect of lysis buffer ionic strength on the quantification of MyHC in cachectic muscle by analyzing MyHC levels in the same muscle using MEB or LB. All samples were homogenized at the same time using identical protocols. Although tumor-bearing mice lose greater than 50% of their gastrocnemius muscle mass,16 we did not observe a decrease in MyHC levels in the MEB lysate from cachectic muscles (Figure 2). We observed significant variability in MyHC levels when we lysed the same muscles in LB (Figure 2, Supplementary Figure 1 for Western blot equivalent). Both the control and cachectic groups showed variability in MyHC levels such that there was not a statistically significant difference between cancer and control groups. This experiment was repeated with TA muscles and the same results were obtained (data not shown).
Figure 2.
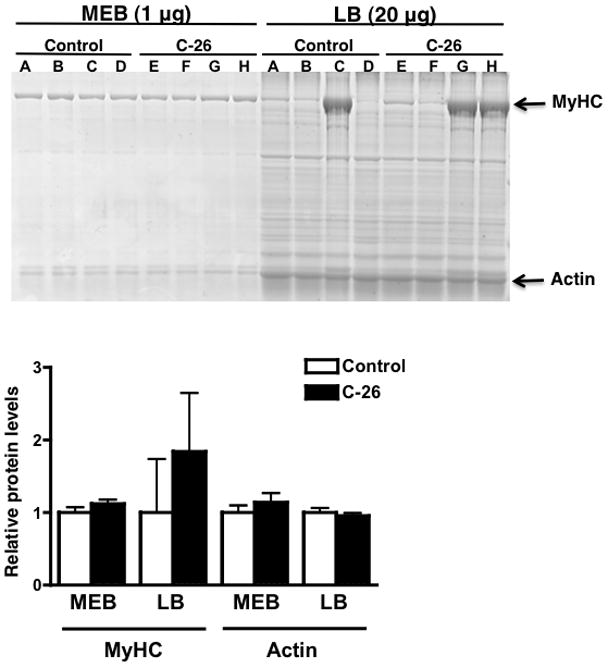
Comparison of MyHC levels between control and cachectic (C-26) gastrocnemius muscle using MEB and LB in the same muscle. Portions of each muscle were lysed in both MEB and LB for direct comparison (the letter above a sample corresponds to a muscle). Due to the inefficiency of MyHC extraction in LB, 20 μg of LB lysate was analyzed, as opposed to 1 μg of MEB lysate. The histogram represents MyHC and actin levels in each disease and buffer condition. Graphs are mean ± SEM.
Many published studies also show a large variation in MyHC levels in cachectic muscles,10–12 but still report that there is an overall decrease. Our results seem to indicate that the extent of myosin extraction in LB is not only inefficient and incomplete, but also highly variable, which makes quantification difficult and prone to error. We found it necessary to load 20-fold more protein in the LB group than in the MEB group because myosin extraction in LB is so inefficient. Because most other cellular proteins are soluble in LB, MyHC appears to be decreased relative to other proteins, leading to the conclusion that MyHC is selectively decreased. Our results show that this conclusion is likely based upon an artifact resulting from the tissue lysis procedure.
The myosin to actin ratio is physiologically relevant because it determines the contractile function of the muscle. The suggestion that MyHC is selectively decreased implies that other myofibrillar proteins, such as sarcomeric actin, do not decrease in cachectic muscles. Because only sarcomeric α-actin is physiologically relevant to muscle contraction, we immunoblotted control muscle lysates in each buffer for both sarcomericα-actin and total MyHC. We found 70% higher levels of sarcomeric α-actin in the MEB lysate, implying that this buffer is also better for solubilizing and quantifying sarcomeric actin and MyHC to actin ratios (Figure 3A and Supplementary Figure 2A).
Figure 3.
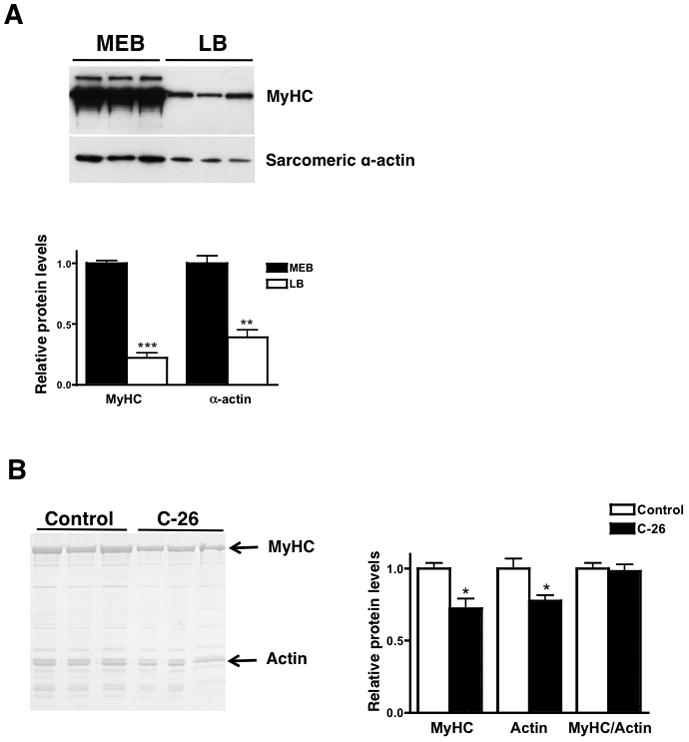
(A) A western blot for MyHC and α-sarcomeric actin in control left ventricular muscles lysed in MEB or LB. 10 μg of protein was loaded for each sample. (B) MyHC decreases in parallel with actin in cachectic gastrocnemius muscle lysed in MEB. 0.002% of final muscle weight was analyzed per sample. * p < 0.05, ** p < 0.01, *** p < 0.0001. Graphs are mean ± SEM.
We have determined the appropriate conditions for optimal myosin and actin solubilization and quantification, but an accurate method for comparing sarcomeric protein levels between control and atrophic muscles remains a controversial issue. Muscles lysed in MEB contain a very high concentration of MyHC, requiring less than 1 μg of total protein for analysis. Thus loading the same amount of protein on a gel results in artificially high levels of MyHC in the cachectic samples, erroneously suggesting that MyHC levels do not change in atrophic conditions (refer to Figure 2). We reasoned that loading gels based upon percent of final muscle weight would allow us to better quantify the relative amounts of MyHC and other myofibrillar proteins since the number of myocytes does not change in atrophic muscle.17
We analyzed 0.002% of final gastrocnemius muscle weight in MEB by SDS-PAGE and found a 27% decrease in MyHC and a 22% decrease in actin in the cachectic muscles (Figure 3B). The MyHC/actin ratio does not change, implying that MyHC and actin decrease in parallel during cancer cachexia. Similar analysis in atrophic cardiac muscle also revealed a parallel decrease in MyHC and actin.16 This result provides insight into the mechanisms of muscle atrophy as it implies that whole sarcomeres are degraded during cachexia, as opposed to MyHC alone.
Discussion
We have described the optimal lysis conditions and analytical method to compare MyHC levels in control and cachectic muscle. Additionally, our results more accurately reflect the extent of MyHC loss. Some groups have shown greater than an 80% reduction in MyHC, which is not realistic.10, 11, 18 If muscle mass decreases by 50% and myosin comprises 30% of total muscle protein, then MyHC should decrease only by 15%, which is 5-fold less than what has been reported. The results we obtained with high-salt myosin extraction showed a ~20% decrease in MyHC in cachectic muscle, which is near the expected value. Our results are therefore a more physiologically accurate approximation of the changes in myofibrillar proteins during cachexia.
The ubiquitin proteasome pathway mediates myofibrillar protein degradation19 but how sarcomeric proteins, including MyHC, are removed from the sarcomere and ubiquitinated is unknown. MyHC is embedded in the sarcomere and it has been proposed that during atrophy, components of the thick filament are lost from the myofibril first, which increases the susceptibility of MyHC to ubiquitination and dissociation from the sarcomere.20 This group also found a decrease in all myofibrillar proteins in a denervation atrophy model, which agrees with our results. Therefore, the claim that MyHC is selectively decreased in atrophic muscles is likely incorrect given that MyHC cannot be targeted for degradation while associated with the actomyosin complex.19, 20
If myosin is insoluble in low salt regardless of disease state, why do some studies show a consistent decrease in MyHC levels in atrophic muscles? There is evidence that the MyHC present in the soluble fraction of low-salt lysates is newly synthesized protein that has not yet been incorporated into sarcomeres. “Easily releasable myofilaments” are elements of the sarcomere that easily dissociate in a low-salt, ATP-containing relaxing solution.21 Less than 3% of total myofibrillar protein is “easily releasable” but analysis of this population revealed that MyHC and actin are the two predominant proteins. Moreover, this MyHC was shown to be newly synthesized, which indicates that it had not yet been incorporated into a sarcomere.21 Additionally, a low concentration of MyHC remains unassembled at equilibrium with filaments,22 suggesting the existence of a small, unincorporated and soluble pool of myosin. Thus the soluble MyHC in low salt that we, and others, have observed may represent newly synthesized myosin. Because protein synthesis often decreases in cachectic muscle,23 it would be logical to find less of this soluble MyHC in the muscles of tumor-bearing mice.
There is also evidence that this easily releasable pool represents an intermediate in the breakdown of myofibrils since these filaments increase during muscle atrophy induced by fasting and cancer.24, 25 This implies that there is an initial cleavage step that releases MyHC and actin from the surface of the sarcomere during normal protein turnover and in catabolic states. If the soluble pool of MyHC represents cleaved protein, it would be counterintuitive to find less of this in cachectic muscle where rates of myofibrillar proteolysis are increased. However, analysis of time points later in atrophy may reveal decreased levels of free MyHC if the muscle is protecting itself from further mass loss by decreasing myofilament cleavage. However, regardless of the identity of the low-salt soluble MyHC pool, we have shown that it does not accurately represent sarcomeric myosin and therefore does not indicate physiological MyHC levels.
The solubility properties of myosin have been known for decades but have been largely ignored in many studies of muscle atrophy, likely because one tissue lysate was used to quantify all proteins in the cell. It is important to consider the biochemical properties and solubilities of proteins during analysis as lack of awareness of this could lead to erroneous results. Importantly, high-salt lysis buffer should only be used to solubilize and quantify myosin. Other proteins should be solubilized in conventional, low-salt buffers for accurate analysis. We have shown that muscle lysis in high salt and final analysis based upon percent muscle mass provide an accurate way to quantify MyHC in the context of catabolic disease. Most importantly, we have shown that MyHC is not selectively decreased in cachectic skeletal muscle. This provides insight into the mechanisms of muscle atrophy and indicates that entire sarcomeres are degraded simultaneously, which has several important therapeutic implications.
Supplementary Material
A western blot for MyHC and α-sarcomeric actin showing the comparison of MyHC levels between control and cachectic (C-26) gastrocnemius muscle using MEB and LB in the same muscle. This blot corresponds to the SDS-PAGE gel in Figure 2.
(A) A western blot for MyHC and α-sarcomeric actin in control tibialis anterior muscles lysed in MEB or LB. 10 μg of protein was loaded for each sample. (B) MyHC decreases in parallel with actin in cachectic gastrocnemius muscle lysed in MEB. 0.002% of final muscle weight was analyzed per sample. This western blot corresponds to the SDS-PAGE gel in Figure 3B.
Acknowledgments
This work was supported by an NIH grant (2RO1HL050560 to L.A. Leinwand), a pre-doctoral fellowship from the American Heart Association (0810037Z to P.F. Cosper) and a grant from the National Heart Lung and Blood Institute (3T32GM008497-S1 to P.F. Cosper).
References
- 1.Hasselgren PO, Fischer JE. Muscle cachexia: current concepts of intracellular mechanisms and molecular regulation. Ann Surg. 2001;233:9–17. doi: 10.1097/00000658-200101000-00003. [DOI] [PMC free article] [PubMed] [Google Scholar]
- 2.Tisdale MJ. Cachexia in cancer patients. Nat Rev Cancer. 2002;2:862–71. doi: 10.1038/nrc927. [DOI] [PubMed] [Google Scholar]
- 3.Lecker SH, Solomon V, Mitch WE, Goldberg AL. Muscle protein breakdown and the critical role of the ubiquitin-proteasome pathway in normal and disease states. J Nutr. 1999;129:227S–37S. doi: 10.1093/jn/129.1.227S. [DOI] [PubMed] [Google Scholar]
- 4.Mitch WE, Goldberg AL. Mechanisms of muscle wasting. The role of the ubiquitin-proteasome pathway. N Engl J Med. 1996;335:1897–905. doi: 10.1056/NEJM199612193352507. [DOI] [PubMed] [Google Scholar]
- 5.Weiss A, Leinwand LA. The mammalian myosin heavy chain gene family. Annu Rev Cell Dev Biol. 1996;12:417–39. doi: 10.1146/annurev.cellbio.12.1.417. [DOI] [PubMed] [Google Scholar]
- 6.Parry DA. Structure of rabbit skeletal myosin. Analysis of the amino acid sequences of two fragments from the rod region. J Mol Biol. 1981;153:459–64. doi: 10.1016/0022-2836(81)90290-4. [DOI] [PubMed] [Google Scholar]
- 7.McLachlan AD, Karn J. Periodic charge distributions in the myosin rod amino acid sequence match cross-bridge spacings in muscle. Nature. 1982;299:226–31. doi: 10.1038/299226a0. [DOI] [PubMed] [Google Scholar]
- 8.Szent-Gyorgyi AG. Meromyosins, the subunits of myosin. Arch Biochem Biophys. 1953;42:305–20. doi: 10.1016/0003-9861(53)90360-9. [DOI] [PubMed] [Google Scholar]
- 9.Trinick J, Cooper J. Sequential disassembly of vertebrate muscle thick filaments. J Mol Biol. 1980;141:315–21. doi: 10.1016/0022-2836(80)90183-7. [DOI] [PubMed] [Google Scholar]
- 10.Acharyya S, Ladner KJ, Nelsen LL, Damrauer J, Reiser PJ, Swoap S, Guttridge DC. Cancer cachexia is regulated by selective targeting of skeletal muscle gene products. J Clin Invest. 2004;114:370–8. doi: 10.1172/JCI20174. [DOI] [PMC free article] [PubMed] [Google Scholar]
- 11.Eley HL, Skipworth RJ, Deans DA, Fearon KC, Tisdale MJ. Increased expression of phosphorylated forms of RNA-dependent protein kinase and eukaryotic initiation factor 2alpha may signal skeletal muscle atrophy in weight-losing cancer patients. Br J Cancer. 2008;98:443–9. doi: 10.1038/sj.bjc.6604150. [DOI] [PMC free article] [PubMed] [Google Scholar]
- 12.Schmitt TL, Martignoni ME, Bachmann J, Fechtner K, Friess H, Kinscherf R, Hildebrandt W. Activity of the Akt-dependent anabolic and catabolic pathways in muscle and liver samples in cancer-related cachexia. J Mol Med. 2007;85:647–54. doi: 10.1007/s00109-007-0177-2. [DOI] [PubMed] [Google Scholar]
- 13.Paul PK, Gupta SK, Bhatnagar S, Panguluri SK, Darnay BG, Choi Y, Kumar A. Targeted ablation of TRAF6 inhibits skeletal muscle wasting in mice. J Cell Biol. 2010;191:1395–411. doi: 10.1083/jcb.201006098. [DOI] [PMC free article] [PubMed] [Google Scholar]
- 14.Butler-Browne GS, Whalen RG. Myosin isozyme transitions occurring during the postnatal development of the rat soleus muscle. Dev Biol. 1984;102:324–34. doi: 10.1016/0012-1606(84)90197-0. [DOI] [PubMed] [Google Scholar]
- 15.Tanaka Y, Eda H, Tanaka T, Udagawa T, Ishikawa T, Horii I, Ishitsuka H, Kataoka T, Taguchi T. Experimental cancer cachexia induced by transplantable colon 26 adenocarcinoma in mice. Cancer Res. 1990;50:2290–5. [PubMed] [Google Scholar]
- 16.Cosper PF, Leinwand LA. Cancer causes cardiac atrophy and autophagy in a sexually dimorphic manner. Cancer Res. 2011;71:1710–20. doi: 10.1158/0008-5472.CAN-10-3145. [DOI] [PMC free article] [PubMed] [Google Scholar]
- 17.Temparis S, Asensi M, Taillandier D, Aurousseau E, Larbaud D, Obled A, Bechet D, Ferrara M, Estrela JM, Attaix D. Increased ATP-ubiquitin-dependent proteolysis in skeletal muscles of tumor-bearing rats. Cancer Res. 1994;54:5568–73. [PubMed] [Google Scholar]
- 18.Zu L, Bedja D, Fox-Talbot K, Gabrielson KL, Van Kaer L, Becker LC, Cai ZP. Evidence for a role of immunoproteasomes in regulating cardiac muscle mass in diabetic mice. J Mol Cell Cardiol. 2010;49:5–15. doi: 10.1016/j.yjmcc.2010.02.007. [DOI] [PMC free article] [PubMed] [Google Scholar]
- 19.Solomon V, Goldberg AL. Importance of the ATP-ubiquitin-proteasome pathway in the degradation of soluble and myofibrillar proteins in rabbit muscle extracts. J Biol Chem. 1996;271:26690–7. doi: 10.1074/jbc.271.43.26690. [DOI] [PubMed] [Google Scholar]
- 20.Cohen S, Brault JJ, Gygi SP, Glass DJ, Valenzuela DM, Gartner C, Latres E, Goldberg AL. During muscle atrophy, thick, but not thin, filament components are degraded by MuRF1-dependent ubiquitylation. J Cell Biol. 2009;185:1083–95. doi: 10.1083/jcb.200901052. [DOI] [PMC free article] [PubMed] [Google Scholar]
- 21.van der Westhuyzen DR, Matsumoto K, Etlinger JD. Easily releasable myofilaments from skeletal and cardiac muscles maintained in vitro. Role in myofibrillar assembly and turnover. J Biol Chem. 1981;256:11791–7. [PubMed] [Google Scholar]
- 22.Saad AD, Pardee JD, Fischman DA. Dynamic exchange of myosin molecules between thick filaments. Proc Natl Acad Sci U S A. 1986;83:9483–7. doi: 10.1073/pnas.83.24.9483. [DOI] [PMC free article] [PubMed] [Google Scholar]
- 23.Smith KL, Tisdale MJ. Increased protein degradation and decreased protein synthesis in skeletal muscle during cancer cachexia. Br J Cancer. 1993;67:680–5. doi: 10.1038/bjc.1993.126. [DOI] [PMC free article] [PubMed] [Google Scholar]
- 24.Neti G, Novak SM, Thompson VF, Goll DE. Properties of easily releasable myofilaments: are they the first step in myofibrillar protein turnover? Am J Physiol Cell Physiol. 2009;296:C1383–90. doi: 10.1152/ajpcell.00022.2009. [DOI] [PMC free article] [PubMed] [Google Scholar]
- 25.Dahlmann B, Rutschmann M, Reinauer H. Effect of starvation or treatment with corticosterone on the amount of easily releasable myofilaments in rat skeletal muscles. Biochem J. 1986;234:659–64. doi: 10.1042/bj2340659. [DOI] [PMC free article] [PubMed] [Google Scholar]
Associated Data
This section collects any data citations, data availability statements, or supplementary materials included in this article.
Supplementary Materials
A western blot for MyHC and α-sarcomeric actin showing the comparison of MyHC levels between control and cachectic (C-26) gastrocnemius muscle using MEB and LB in the same muscle. This blot corresponds to the SDS-PAGE gel in Figure 2.
(A) A western blot for MyHC and α-sarcomeric actin in control tibialis anterior muscles lysed in MEB or LB. 10 μg of protein was loaded for each sample. (B) MyHC decreases in parallel with actin in cachectic gastrocnemius muscle lysed in MEB. 0.002% of final muscle weight was analyzed per sample. This western blot corresponds to the SDS-PAGE gel in Figure 3B.