

Abstract
Background
Nutrition Facts labels can keep consumers better informed about their diets' nutritional composition, however, consumers currently do not understand these labels well or use them often. Thus, modifying existing labels may benefit public health.
Objective
The present study tracked the visual attention of individuals making simulated food-purchasing decisions to assess Nutrition Facts label viewing. Primary research questions were how self-reported viewing of Nutrition Facts labels and their components relates to measured viewing and whether locations of labels and specific label components relate to viewing.
Design
The study involved a simulated grocery shopping exercise conducted on a computer equipped with an eye-tracking camera. A post-task survey assessed self-reported nutrition information viewing, health behaviors, and demographics.
Subjects/setting
Individuals 18 years old and older and capable of reading English words on a computer (n=203) completed the 1-hour protocol at the University of Minnesota during Spring 2010.
Statistical analyses
Primary analyses included χ2, analysis of variance, and t tests comparing self-reported and measured viewing of label components in different presentation configurations.
Results
Self-reported viewing of Nutrition Facts label components was higher than objectively measured viewing. Label components at the top of the label were viewed more than those at the bottom, and labels positioned in the center of the screen were viewed more than those located on the sides.
Conclusions
Nutrition Facts label position within a viewing area and position of specific components on a label relate to viewing. Eye tracking is a valuable technology for evaluating consumers' attention to nutrition information, informing nutrition labeling policy (eg, front-of-pack labels), and designing labels that best support healthy dietary decisions.
Obesity is a substantial and growing public health threat; it has been estimated that by 2030, >85% of all Americans will be overweight and >50% of US adults will be obese (1). Energy imbalance (greater caloric intake than expenditure) is the primary contributor to obesity (2). Although most individuals report that it is important to them to eat nutritious meals and snacks (3), Americans continue to consume more calories, saturated fat, sodium, and other nutrients than is healthy (4). A primary policy measure aimed at helping individuals make healthy eating choices is nutrition labeling. Individuals make more than 225 diet-related decisions daily (5); Nutrition Facts labels can help individuals make more of these decisions in an informed manner. Indeed, Nutrition Facts label use has been found to decrease daily intake of calories, total fat, saturated fat, cholesterol, and sodium, and to increase intake of fiber (6). Recent research suggests, however, that consumers often do not read Nutrition Facts labels when grocery shopping and that even when they do, labels are frequently misunderstood (7). Research findings such as these beg the question: Are current Nutrition Facts labels optimally designed to help consumers make healthier food choices?
The present study investigated how the locations of components on Nutrition Facts labels and of labels themselves on a computer screen designed for a simulated grocery shopping experience relate to individuals' viewing of Nutrition Facts labels and individual components by utilizing eye-tracking technology to precisely and objectively measure viewing. Previous research suggests that simply asking consumers whether they read Nutrition Facts labels may not produce accurate information (7). Eye tracking provides a way to directly measure visual attention; its use with adults scanning Nutrition Facts labels could inform design of labels that are more readily viewed and understood. Use of eye tracking in labeling research is in its early stages; existing research has been limited to investigating technical aspects of label structure and the effects of consumer motivation and experience in label reading on comprehension (8-10).
The present study builds on existing research by investigating unique questions related to label use among individuals making purchasing decisions for multiple food items in the context of a simulated shopping exercise using a computer screen display as depicted in the Figure. The present study utilizes a very rapid and precise eye tracker, representing technological advancement over previous eye trackers used in labeling research. The goal of this study was to determine whether and how Nutrition Facts labels and their constituent parts are viewed by consumers making simulated purchasing decisions. The two primary research questions in this study were: how does self-reported Nutrition Facts label viewing compare with viewing precisely measured via eye tracker? And how is location related to viewing of nutrition information?
Figure.
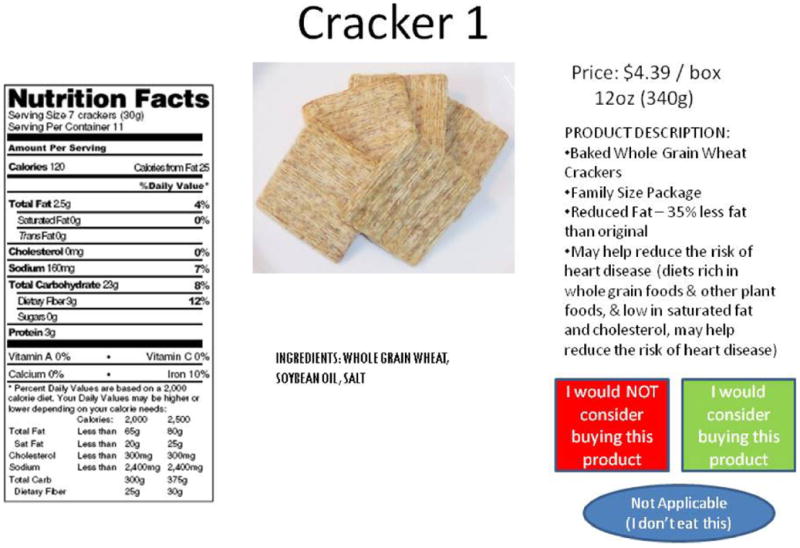
Sample screen (1 of 64) seen by American adult participants (n=203, mean age=42.3 years) during simulated shopping task.
Methods
Setting
This study was conducted at the University of Minnesota's Epidemiology Clinical Research Center between February and May 2010. This study was deemed exempt from full committee review by the University of Minnesota Institutional Review Board due to the low risk to participants.
Participants
Participants (n=208) were recruited through a local magazine. Participants were screened by phone and excluded if under 18 years of age or unable to read English words on a computer 30 inches away. Five participants were unable to complete the eye-tracking portion of the visit because they were wearing hard contact lenses, which are incompatible with the EyeLink 1000 (SR Research, Mississauga, Ontario, Canada). Final sample size was 203 participants.
During the telephone screening, potential participants were informed that their eye movements would be monitored while they engaged in simulated grocery shopping; for those willing and able to participate, a laboratory visit was scheduled. Participants came to the laboratory once, for approximately 1 hour, and provided verbal consent to participate before beginning the simulated shopping.
Procedures
The simulated grocery shopping program was created using SR Research's Experiment Builder software (version 1.6.1, 2009), which is compatible with the EyeLink 1000 eye tracker. The EyeLink 1000 can be used with a chin- or forehead-rest or without any head support. In the present study, a chin-rest was used to ensure the highest levels of accuracy (0.25 degrees) and resolution (0.01 degrees). The EyeLink 1000 was positioned below the computer screen on which participants completed the shopping task. Before beginning, participants were informed that they would see 64 different foods and that they should indicate whether they would buy each of the items by clicking on: “would buy,” “would not buy,” or “not applicable.” Participants were instructed to select “not applicable” only if dietary restrictions preventing them from eating a particular food. They were also instructed to consider each item on its own merits, independent of the other items; to facilitate this, participants were not able to go back and see previously viewed foods.
Participants saw 64 foods including meal items (eg, pizza, soup), snack items (eg, crackers, peanuts), and dessert items (eg, ice cream, cookies). The 64 foods were selected to represent a variety of healthfulness options within 15 categories of foods commonly purchased by American consumers (eg, cereals, crackers, soups). Within each of these 15 categories, individual foods were selected to represent differing nutritional profiles within the category. All products were familiar foods and national brands; however, brand names were not included on the computer screens during the simulated shopping task. Pilot testing indicated that individuals could complete the simulated shopping task and survey within the 1 hour time frame when the number of foods included was 64, thus this was the number of foods included in the task.
The simulated grocery shopping computerized interface was designed with the computer screen divided into three equal-sized vertical columns. One column contained the food's price and description, another column contained a photograph of the food and the ingredient list, and a third column contained the Nutrition Facts label. The contents of the columns were counterbalanced by location so that one third of the participants each saw the Nutrition Facts label on the left, right, and center. In addition, the order in which the 64 foods were presented was randomized.
After the simulated shopping, participants completed a survey describing their typical grocery shopping and health behaviors. The survey included 64 questions (12 demographic items, 36 diet questions taken from three National Cancer Institute dietary screeners [the Percentage of Energy from Fat Screener, the All-Day Fruit and Vegetable Screener in the Eating at America's Table Study, and the Five Factor Screener in the 2005 National Health Interview Survey (NHIS) Cancer Control Supplement; instruments available at (11), validation information available at (12)]); 7 physical activity items from the reliable and valid Paffenbarger College Alumnus Physical Activity Questionnaire (13); for validity information see (14); and 9 questions about specific grocery shopping and Nutrition Facts label use behaviors created for this survey). Participants were provided two $20 gift cards as compensation for participating.
Measures
Self-Reported
Participants supplied demographic information (sex, race, ethnicity, height, weight, age, education, marital status, income, number of children; see Table 1), and indicated how often they typically look at nutrition information by responding to the following question: “How often do you read the nutrition information on food labels before purchasing foods or beverages?” (Response options included: never or rarely, sometimes, often, and always or almost always). Participants also responded to five similarly structured questions with the same four response options regarding the frequency with which they usually look at selected label components (calories, total fat, sugar, trans fat, and serving size).
Table 1. Sociodemographic and lifestyle factors for American adult participants (n=203) in simulated online food selection task.
| Mean±SDa | |
|---|---|
| Age (y) | 42.29±12.59 |
| BMIb | 27.20±6.82 |
|
| |
| n (%) | |
|
| |
| Female sex | 176 (87) |
| White race | 182 (90) |
| Hispanic ethnicity | 8 (4) |
| Education | |
| Less than 4-y college | 65 (32) |
| 4-y college degree | 91 (45) |
| More than 4-y college | 47 (23) |
| Income ($) | |
| <25,000 | 27 (13) |
| 25,000-50,000 | 53 (26) |
| 50,001-75,000 | 41 (20) |
| 75,001-100,000 | 32 (16) |
| 100,001-125,000 | 23 (11) |
| 125,001-150,000 | 16 (8) |
| >150,000 | 11 (5) |
| Marital status | |
| Married | 124 (61) |
| Never married | 48 (24) |
| Other (separated, divorced, widowed, not married but living with significant other) | 31 (15) |
| No. of children | |
| 0 | 89 (44) |
| 1 | 38 (19) |
| 2 | 47 (23) |
| 3 or more | 29 (14) |
| Primary food shopper for household | |
| Yes | 182 (90) |
| No | 21 (10) |
SD=standard deviation.
BMI=body mass index (calculated as kg/m2).
Measured
The EyeLink 1000 eye tracker precisely measured time participants spent viewing each piece of information on the “shopping” screens. For the present analyses, relevant amounts of time were those spent looking at the Nutrition Facts label as a whole as well as each of the label's components, ie, serving size, calories, total fat, saturated fat, trans fat, cholesterol, sodium, carbohydrate, fiber, sugar, protein, vitamins, minerals, and percent daily values. Although the EyeLink 1000 records eye position 1,000 times per second, ≥50 ms are required to actually read a piece of information (15,16). Therefore, ≥50 ms of viewing were required for a component to be considered “viewed.”
Analyses
Analyses were conducted in 2010 using SPSS 17.0.3 (2009, PASW Statistics, Chicago, IL).
Self-Reported vs Eye-Tracker–Measured Label Viewing
To address the question of whether participants view Nutrition Facts labels and their constituent parts at comparable levels to those they report, goodness-of-fit χ2 analyses were conducted to determine whether the distribution of self-reported categories (ie, percentages of participants saying that they never/rarely, sometimes, often, or always/almost always look at labels and specific components) matched the eye-tracker–measured distribution. Because survey response options were non-numeric (ie, percentages were not included alongside rarely, sometimes, often, or almost always) and measured data were strictly numeric, comparison between self-reported and measured label viewing was facilitated via a priori selection of percentages to correspond with self-report response options: never/rarely viewing a Nutrition Facts label or label component was defined as viewing <10% of items; sometimes was defined as 10% to 40% of items; often was defined as 41% to 80% of items; and always/almost always was defined as >80% of items. Hereafter, always/almost always will be referred to as almost always and never/rarely will be referred to as rarely. Goodness-of-fit comparisons of self-reported and measured distributions were conducted for the entire Nutrition Facts label and for a selected subset of individual label components (serving size, calories, total fat, trans fat, and sugar) about which participants were asked to indicate their viewing frequency.
Viewing Comparisons by Label Component
In addition to analyses comparing self-reported to measured viewing for the same label component, χ2 goodness-of-fit analyses were also conducted comparing distributions of the same type (self-reported viewing or measured viewing) for different label components. Distributions of self-reported viewing (rarely, sometimes, often, almost always) for each label component were compared to the self-reported viewing distributions for each of the other specific components participants were asked about in the survey (ie, serving size, total fat, trans fat, and sugar). These comparisons were conducted to determine which, if any, label components were self-reported to be viewed more than others. Similarly, distributions of measured viewing preferences for these five label components were compared using χ2 analyses, again to determine whether any of these components were viewed substantially more than others during the grocery shopping task. Power analyses conducted using G*Power 3 (17) indicated that χ2 analyses had low power to detect small effects (0.29), but high power to detect medium to large effects (0.96 and 1.00, respectively).
Location and Label Use
To investigate whether participants were equally likely to look at nutrition information in each of the three (left, center, right) positions on the screen, an analysis of variance was conducted evaluating Nutrition Facts label viewing by location. In addition, t tests were conducted comparing viewing of individual label components with one another (eg, calories vs sugar). G*Power 3 (17) indicated that analysis of variance and t tests had low power to detect small effects (0.26), but high power to detect medium or large effects (0.91 and 1.00, respectively).
Results
Self-Reported vs Eye-Tracker–Measured Label Use
Most consumers viewed at least one component of the average Nutrition Facts label. More than 70% of participants viewed one or more Nutrition Facts label components either often (41% to 80% of the time) or almost always (>80% of the time) (eg, 71% of participants viewed the calorie component; see Table 2). More than half of the participants viewed each of five label components (servings, calories, total fat, saturated fat, and trans fat) on the average label. These are the five components appearing at the top of Nutrition Facts labels. Few consumers looked at all of the components on any single label (only six participants viewed every line on at least one Nutrition Facts label, with three individuals viewing every line on just one label, one viewing every line on two labels, one viewing every line on three labels, and one participant viewing every line on seven Nutrition Facts labels). Not only did participants tend to view relatively few label components during the simulated grocery shopping task, they also tended to view components less than they self-reported doing while actually grocery shopping. The response distributions for self-reported viewing of each component were significantly different from the distributions for eye-tracker–measured viewing, with χ2 ranging from 24.8 to 215.7 (P<0.001; see Table 3). Thirty-three percent of participants self-reported that they almost always look at calorie content on Nutrition Facts labels, 31% reported that they almost always look at the total fat content, 20% said the same for trans-fat content, 24% for sugar content, and 26% for serving size. However, only 9% of participants actually looked at calorie count for almost all (>80%) of the products in this study, and about 1% of participants looked at each of these other components (total fat, trans fat, sugar, and serving size) on almost all labels.
Table 2. Significant differences in percent of participants (n=203) viewing each component of the average Nutrition Facts label (mean viewing for 64 food items).
| Serving size | Calories | Total fat | Saturated fat | Trans fat | Cholesterol | Sodium | Carbohydrate | Fiber | Sugar | Protein | Vitamins | Minerals | PDVa | |
|---|---|---|---|---|---|---|---|---|---|---|---|---|---|---|
| Serving size (58%)b | X | _x | y | +z | + | + | + | + | + | + | + | + | ||
| Calories (71%) | + | X | + | + | + | + | + | + | + | + | + | + | + | + |
| Total fat (60%) | – | X | + | + | + | + | + | + | + | + | + | + | + | |
| Saturated fat (54%) | – | – | X | + | + | + | + | + | + | + | + | + | ||
| Trans fat (51%) | – | – | X | + | + | + | + | + | + | + | + | + | ||
| Cholesterol (44%) | – | – | – | – | – | X | + | + | + | + | + | + | ||
| Sodium (43%) | – | – | – | – | – | X | + | + | + | + | + | + | ||
| Carbohydrate (39%) | – | – | – | – | – | X | + | + | + | + | ||||
| Fiber (36%) | – | – | – | – | – | – | – | X | + | + | + | + | ||
| Sugar (34%) | – | – | – | – | – | – | – | X | + | + | + | + | ||
| Protein (28%) | – | – | – | – | – | – | – | – | – | – | X | + | + | |
| Vitamins (17%) | – | – | – | – | – | – | – | – | – | – | – | X | + | |
| Minerals (9%) | – | – | – | – | – | – | – | – | – | – | – | – | X | – |
| PDVa (23%) | – | – | – | – | – | – | – | – | – | – | + | X |
PDV=Percent Daily Value.
Percent of participants who viewed component for >50 ms, on average.
Component in left column viewed by a significantly (P<0.05) smaller percentage of participants than the component listed in column heading.
Blank cell indicates no significant difference between percent of participants viewing component in left column and component listed in column heading.
Component in left column viewed by a significantly (P<0.05) higher percentage of participants than the component listed in column heading.
Table 3. Comparison of participant distributions for attention to Nutrition Facts label, self-reported vs objectively measured via eye tracking (n=186a).
| Self-Reportedb | Measured Via Eye Tracker | |||||||||
|---|---|---|---|---|---|---|---|---|---|---|
| Never/rarely | Sometimes | Often | Always/almost always | Significantly different fromc: | Never/rarely | Sometimes | Often | Always/almost always | Significantly different fromd: | |
| n(%) | n(%) | |||||||||
| Serving size | 29 (15.7) | 52 (28.1) | 56 (30.3) | 48 (25.9) | Trans fat | 61 (32.8) | 81 (43.5) | 42 (22.6) | 2 (1.1) | All |
| Calories | 24 (12.9) | 52 (28.0) | 48 (25.8) | 62 (33.3) | Trans fat, sugar | 38 (20.4) | 75 (40.3) | 56 (30.1) | 17 (9.1) | All |
| Total fat | 22 (11.8) | 60 (32.3) | 47 (25.3) | 57 (30.6) | Trans fat, sugar | 41 (22.0) | 92 (49.5) | 51 (27.4) | 2 (1.1) | All |
| Trans fat | 45 (24.3) | 56 (30.3) | 47 (25.4) | 37 (20.0) | Calories, total fat | 67 (36.0) | 92 (49.5) | 27 (14.5) | 0 (0) | All |
| Sugar | 36 (19.5) | 56 (30.3) | 49 (26.5) | 44 (23.8) | Calories, total fat | 111 (59.7) | 56 (30.1) | 17 (9.1) | 2 (1.1) | All |
| Entire label | 15 (8.1) | 57 (30.6) | 66 (35.5) | 48 (25.8) | 24 (12.9) | 32 (17.2) | 62 (33.3) | 68 (36.6) | ||
Analyses were restricted to participants with complete eye-tracker and survey data for these items. Resulting n=186.
All self-reported distributions are significantly different from the corresponding measured distributions (χ2 range from 24.8 to 215.7; P<0.001).
Self-reported distribution significantly different from the self-reported distribution for each label component listed.
Measured distribution significantly different from the measured distribution for every other label component.
In addition to the questions about specific label components, participants were also asked, more broadly, how often they usually look at Nutrition Facts labels. Distributions of measured and self-reported responses to this question were also significantly different (χ2=24.8; P<0.001), but reflected significantly greater eye-tracker–measured viewing compared with self-report (see Table 3). Although only 26% of participants reported that they almost always look at labels, in the simulated shopping task 37% of participants looked at one or more sections of almost all labels (P<0.05). Therefore, it appears that while consumers view individual label components less frequently than they report, they view at least some portion of the label more frequently than they report.
Analyses comparing distributions of self-reported label-component viewing to one another (see Table 3) revealed that participants reported preferring to look at calories and total fat compared with trans-fat and sugar content. Eye-tracker data indicated that these preferences were displayed when participants engaged in the simulated grocery shopping. However, there was no statistically significant difference between the distributions of participants self-reporting that they rarely, sometimes, often, and almost always looked at sugar content compared with serving size (χ2[3]=2.64; P=0.45), yet eye-tracker data revealed a significant difference between these distributions during the grocery shopping task (χ2[3]=75.30; P<0.001), with significantly more participants rarely looking at sugar content than at serving size. This same discrepancy existed between trans-fat and sugar content (ie, no statistically significant differences existed between the self-report distributions; χ2[3]=4.91; P<0.18), but eye tracker data revealed a significant difference between these distributions during the grocery shopping task (χ2[3]=41.68; P<0.001), with more participants rarely looking at sugar than at trans-fat content.) Thus, these analyses indicated that the label components that consumers report viewing more than others are also measured to be viewed more (ie, total fat and calories over trans fat and sugar), and that unstated preferences are revealed when measuring viewing behavior via eye tracker (ie, serving size and trans-fat content were viewed more than sugar content, although participants did not express this preference via self-report).
Location and Label Use
Participants randomly assigned to view Nutrition Facts labels in the center column during the simulated shopping task viewed one or more sections of 61% of labels compared with 37% and 34% of labels among participants randomly assigned to view labels on the left- and right-hand sides of the screen, respectively (P<0.001). In addition, label location was related to viewing time; labels in the center column received >30% more view time than the same labels when located in a side column (1,301±1,044 ms vs 975±989 ms, t=2.14; P<0.05).
Furthermore, significantly more participants viewed components located near the Nutrition Facts label's top vs bottom (see Table 2). Percentages of participants viewing each component on the main portion of the label (ie, between the two thick horizontal bars) decreased incrementally from calories, at the top, to minerals, at the bottom.
Discussion
The present study sought to investigate two questions about Nutrition Facts label viewing that could be effectively addressed via the precise measurement capabilities of the EyeLink 1000 eye tracker: How are self-reported and eye-tracker–measured label viewing related? And how does location impact Nutrition Facts label viewing? Results indicated that participants reported significantly more viewing of label components during actual grocery shopping than they displayed while engaging in a simulated grocery shopping task. In addition, location of both Nutrition Facts labels and label components was strongly tied to viewing. Labels centrally located on the computer screen were viewed by a higher percentage of possible viewers and for considerably longer than labels located on the sides. Components located near the label top were viewed considerably more than components located near the bottom. (See Graham and Jeffery [18] for information on how label viewing differed by characteristics of the participants, eg, age, race/ethnicity, marital status, and the foods, eg, meal items vs snack foods vs fruits/vegetables vs desserts; “purchased” vs not.)
It was not surprising that consumers viewed label components less than they self-reported; this tendency has been documented previously (7). However, it was somewhat unexpected that measured rates of entire-label viewing were higher than self-reported. This discrepancy may relate to label location differences between the simulated shopping setting and traditional grocery stores. In the simulated shopping setting, participants could see Nutrition Facts labels without having to turn, rotate, or otherwise manipulate a food package. In contrast, Nutrition Facts labels on food packages tend to be in locations that cannot be seen by consumers looking at the front of a package (eg, when viewing a shelf of items in a grocery store). The relative ease of label access in the simulated grocery shopping setting may explain the slightly higher percentage of participants viewing Nutrition Facts labels while shopping in the simulated setting compared with self-reported typical use in a grocery store. It is possible that the more readily visible Nutrition Facts labels in the simulated shopping prompted consumers who self-reported sometimes looking at labels to look at labels more often.
The way in which viewing labels and their components was defined may also help explain this unexpected difference—it is possible that a consumer who usually only glances at a food's calorie content would not say that she “reads” labels, but in this study, she would be so classified, as even a quick (≥50 ms) glance at one label component resulted in an individual being classified as having viewed the label. Another factor that could have led to different patterns of label viewing in the simulated grocery shopping task compared with actual grocery shopping was that the participants were not provided with brand name information for any of the foods they viewed in the simulated shopping task. This lack of brand name information could have increased label use in the simulated shopping task, as consumers unable to rely on their familiarity with a particular brand to form their purchase intentions might have sought other sources of data (like the Nutrition Facts label) to inform their decisions.
The results of this study suggest that consumers have a limited attention span for Nutrition Facts labels: although most consumers did view labels, very few consumers viewed every component on any label. Most consumers read the labels by starting at the top and working down. This strategy is not inherently flawed; indeed, this is the US Food and Drug Administration's recommended approach (19). However, this approach becomes problematic when consumers do not read all the way to the label's bottom if important information is located there. Data from this study suggest that the average consumer reads only the top five lines on a Nutrition Facts label. Although the top five lines (as they follow a standard format on every Nutrition Facts label) contain important information (serving size, calories, total fat, saturated fat, and trans fat), it is worth questioning whether these are the five most important components for consumers to view, or whether there are others that might replace one of these. A recent review of consumers' Nutrition Facts label use (20) suggests that the nutrients spontaneously mentioned as of primary interest by consumers across multiple studies are fat, calories, sodium, and sugar. Notably, two of these four (sodium and sugar) are located below the top five lines on existing American Nutrition Facts labels and were not among the top five most viewed label components in the present research.
Although it would be best for enhancing health-relevant knowledge if consumers read Nutrition Facts labels in their entirety before purchasing foods, this study and others (eg, [7]) suggest that this does not usually occur. If, in line with evidence presented here, it is more realistic to believe that the average consumer will look at the top five lines of a Nutrition Facts label before making a purchasing decision, consideration should be given to restructuring labels to provide the most health-relevant nutrients on their uppermost lines. Although not explicitly stated in the US Food and Drug Administration's Nutrition Labeling and Education Act Requirements (21), it is likely that the standard layout of Nutrition Facts labels was hierarchically designed to provide the information deemed most important at the top, with information perceived to be less important located lower on the label. It is worth re-evaluating whether the current state of nutrition science and public health supports this 20-year-old structure, or whether a nutrient like sugar, which currently appears in the 10th position from the top, merits, based on health-impact, a higher label position.
One might argue that participants in this study viewed components near the label top more than those near the bottom because uppermost components were perceived to be more important. However, these data do not support that interpretation. Participants self-reported that they were no more likely to view information located near the label top (ie, serving size and trans fat) than information located near the bottom (ie, sugar). These self-report data suggest that consumers do not believe that all information near the top of the label deserves more attention than information at the bottom. If participants believe that serving size and trans fat merit comparable amounts of attention as sugar, as they report, then sugar's subordinate label position may explain its lower viewership.
Results of this study indicate that centrally located Nutrition Facts labels are viewed more frequently and for longer than those located peripherally in the context of a simulated grocery shopping task. Replication of these results in actual grocery shopping settings would raise important concerns for policy and for clinical practice. At present, most Nutrition Facts labels are positioned peripherally, not centrally, on food packages and, as such, may be less likely than they could be to catch and hold the eye of a potential consumer. Front-of-pack nutrition labels, although popular in Europe (22), are not yet common in the United States; these labels typically use both a focal location on the front of a food package and also a simplified format listing only selected nutrients. These two front-of-pack label characteristics address the two primary concerns raised by the present study in a simulated shopping setting (ie, peripheral Nutrition Facts label locations may be suboptimal and specific label components, like sodium and sugar, may be positioned suboptimally within the label).
This study makes important contributions to the nutrition labeling literature and sheds new light on a health-relevant consumer behavior, but it is not without limitations. First, this study examined simulated grocery shopping on a computer, making the task more similar in some ways to online grocery shopping than to grocery shopping in a brick-and-mortar grocery store. Online grocery shopping is not yet widespread in the United States. Although an increasing proportion of grocery shopping is done online in many markets (eg, in 2006, there was a34% increase in the online food and grocery market in the United Kingdom, one of the world leaders in online grocery shopping [23] as cited in [24]), the vast majority of America's grocery shopping is still done in brick-and-mortar stores. Although there is some evidence to suggest that the way individuals viewed Nutrition Facts labels in this setting was similar to their viewing in a store (eg, participants reported preferring to view calories and total fat vs trans fat and sugar when grocery shopping, and these preferences were displayed in the simulated shopping task), it is possible that there were important differences between typical in-store Nutrition Facts label use and the way participants viewed labels in this study. Using eye-tracking methodology in a grocery store environment would be a very informative future direction for this line of research.
It is also worth noting that the act of monitoring a behavior has the potential to impact the behavior (eg, [25]), although this finding is not universal and some researchers have found that various behaviors are not substantially impacted by apparent observation (eg, [26]). In terms of monitoring eye movements, someone who knows she is being observed may feel compelled to alter her natural behavior (eg, by looking at nutrition information before deciding whether to buy an item) if she feels this is what the experimenter wants or that it will make her look favorable (eg, more thoughtful or health-conscious). Steps were taken to deter such behavior by avoiding indications to participants that the researchers were interested in nutrition labeling. The study was advertised as an online shopping study and, as the shopping task occurred prior to the survey, no mention was made of any health behaviors or Nutrition Facts label use until the simulated shopping was completed. In addition, although participants were aware that their eye movements were being monitored, there was a calibration procedure prior to the shopping task that helped participants grow accustomed to the setting and the eye tracking prior to the simulated shopping, thus affording participants time to stop focusing on the fact that their gaze was being monitored. Data from this study also provide striking evidence that participants did not feel compelled to read Nutrition Facts labels: fewer participants looked at the nutrition components while engaging in the simulated shopping task than reported typically doing so while grocery shopping, and only 6 of 203 participants looked at every component of even one Nutrition Facts label. Although it has previously been noted that self-reporting of Nutrition Facts label use tends to be inflated (7), if participants were attempting to appear more health-conscious by behaving in a way they ordinarily would not behave (ie, looking at Nutrition Facts labels during the simulated shopping task), it seems reasonable to believe the eye-tracker–measured label use would have been greater than reflected by the present data (at least reaching self-reported levels for most nutrients) and that >1% of participants would have consistently looked at label components like total fat and sugar.
Taken together, these results indicate that self-reported Nutrition Facts label use does not accurately represent in vivo use of labels and their components while engaging in a simulated shopping exercise. In addition, location of labels and of specific label components relate to viewing. Consumers are more likely to view centrally located labels and nutrients nearer the label's top. Because knowing the amounts of key nutrients that foods contain can influence consumers to make healthier purchases, prominently positioning key nutrients, and labels themselves, could substantially impact public health.
Acknowledgments
The authors would like to acknowledge the Minnesota Obesity Center and Trans-disciplinary Research in Energetics and Cancer for funding the research and also Annie Hotop for her contributions to data collection.
Funding/Support: This work was funded by the Minnesota Obesity Center and Transdisciplinary Research in Energetics and Cancer.
Footnotes
Statement of Potential Conflict of Interest: No potential conflict of interest was reported by the authors.
References
- 1.Wang Y, Beydoun MA, Liang L, Caballero B, Kumanyika SK. Will all Americans become overweight or obese? Estimating the progression and cost of the US obesity epidemic. Obesity. 2008;16:2323–2330. doi: 10.1038/oby.2008.351. [DOI] [PubMed] [Google Scholar]
- 2.Spiegelman BM, Flier JS. Obesity and the regulation of energy balance. Cell. 2001;104:531–543. doi: 10.1016/s0092-8674(01)00240-9. [DOI] [PubMed] [Google Scholar]
- 3.Glanz K, Basil M, Maibach E, Goldberg J, Snyder D. Why Americans eat what they do: Taste, nutrition, cost, convenience, and weight control concerns as influences on food consumption. J Am Diet Assoc. 1998;98:1118–1126. doi: 10.1016/S0002-8223(98)00260-0. [DOI] [PubMed] [Google Scholar]
- 4.Dall TM, Fulgoni VL, Zhang Y, Reimers KJ, Packard PT, Astwood JD. Potential health benefits and medical cost savings from calorie, sodium, and saturated fat reductions in the Amerian diet. Am J Health Promot. 2009;23:412–422. doi: 10.4278/ajhp.080930-QUAN-226. [DOI] [PubMed] [Google Scholar]
- 5.Wansink B, Sobal J. Mindless eating—The 200 daily food decisions we overlook. Environ Behav. 2007;39:106–123. [Google Scholar]
- 6.Kim SY, Nayga RM, Jr, Capps O., Jr The effect of food label use on nutrient intakes: An endogenous switching regression analysis. J Agric Resourc Econ. 2000;25:215–231. [Google Scholar]
- 7.Cowburn G, Stockley L. Consumer understanding and use of nutrition labelling: A systematic review. Public Health Nutr. 2005;8:21–28. doi: 10.1079/phn2005666. [DOI] [PubMed] [Google Scholar]
- 8.Goldberg JH, Probart CK, Zak RE. Visual search of food nutrition labels. Hum Factors. 1999;41:425–437. doi: 10.1518/001872099779611021. [DOI] [PubMed] [Google Scholar]
- 9.Jones G, Richardson M. An objective examination of consumer perception of nutrition information based on healthiness ratings and eye movements. Public Health Nutr. 2007;10:238–244. doi: 10.1017/S1368980007258513. [DOI] [PubMed] [Google Scholar]
- 10.Visschers VH, Hess R, Siegrist M. Health motivation and product design determine consumers' visual attention to nutrition information on food products. Public Health Nutr. 2010;13:1099–1106. doi: 10.1017/S1368980009993235. [DOI] [PubMed] [Google Scholar]
- 11.Short dietary assessment instruments. National Cancer Institute. [Accessed December 21, 2010]; http://riskfactor.cancer.gov/diet/screeners/. Updated November 9, 2009.
- 12.Validation results. National Cancer Institute. [Accessed December 21, 2010]; http://appliedresearch.cancer.gov/surveys/nhis/5factor/results.html. Updated August 13, 2008.
- 13.Paffenbarger RS, Jr, Wing AL, Hyde RT. Physical activity as an index of heart attack risk in college alumni. Am J Epidemiol. 1978;108:161–175. doi: 10.1093/oxfordjournals.aje.a112608. [DOI] [PubMed] [Google Scholar]
- 14.Ainsworth BE, Leon AS, Richardson MT, Jacobs DR, Paffenbarger RS., Jr Accuracy of the College Alumnus Physical Activity Questionnaire. J Clin Epidemiol. 1993;46:1403–1411. doi: 10.1016/0895-4356(93)90140-v. [DOI] [PubMed] [Google Scholar]
- 15.Rayner K. Eye movements in reading and information processing: 20 years of research. Psychol Bull. 1998;124:372–422. doi: 10.1037/0033-2909.124.3.372. [DOI] [PubMed] [Google Scholar]
- 16.Reichle ED, Rayner K, Pollatsek A. The E-Z Reader model of eye-movement control in reading: Comparisons to other models. Behav Brain Sci. 2003;26:445–526. doi: 10.1017/s0140525x03000104. [DOI] [PubMed] [Google Scholar]
- 17.Faul F, Erdfelder E, Lang AG, Buchner A. G*Power 3: A flexible statistical power analysis program for the social, behavioral, and biomedical sciences. Behav Res Methods. 2007;39:175–191. doi: 10.3758/bf03193146. [DOI] [PubMed] [Google Scholar]
- 18.Graham DJ, Jeffery RW. Predictors of nutrition label viewing during food purchase decision making: An eye tracking investigation [published online ahead of print July 7, 2011] Public Health Nutr. doi: 10.1017/S1368980011001303. [DOI] [PMC free article] [PubMed] [Google Scholar]
- 19.US Food and Drug Administration. How to understand and use the Nutrition Facts label. [Accessed October 24, 2010];1990 http://www.fda.gov/food/labelingnutrition/consumerinformation/ucm078889.htm.
- 20.Grunert K, Wills J. A review of European research on consumer response to nutrition information on food labels. J Public Health. 2007;15:385–399. [Google Scholar]
- 21.US Food and Drug Administration. Nutrition Labeling and Education Act. [Accessed October 24, 2010];1990 http://www.fda.gov/ICECI/Inspections/InspectionGuides/ucm074948.htm#Layout.
- 22.van Kleef E, van Trijp H, Paeps F, Fernandez-Celemin L. Consumer preferences for front-of-pack calories labelling. Public Health Nutr. 2008;11:203–213. doi: 10.1017/S1368980007000304. [DOI] [PMC free article] [PubMed] [Google Scholar]
- 23.E-Commerce: The Internet Grocery Market. Hampton: Key Note Ltd; 2007. Key Note. [Google Scholar]
- 24.Hand C, Riley FD, Harris P, Singh J, Rettie R. Online grocery shopping: The influence of situational factors. Eur J Market. 2009;43:1205–1219. [Google Scholar]
- 25.Hay LR, Nelson RO, Hay WM. Methodological problems in the use of participant observers. J Appl Behav Anal. 1980;13:501–504. doi: 10.1901/jaba.1980.13-501. [DOI] [PMC free article] [PubMed] [Google Scholar]
- 26.Gardner F. Methodological issues in the direct observation of parent-child interaction: Do observational findings reflect the natural behavior of participants? Clin Child Fam Psychol Rev. 2000;3:185–198. doi: 10.1023/a:1009503409699. [DOI] [PubMed] [Google Scholar]