Abstract
jPAP (Java Pedigree Analysis Package) performs variance components linkage analysis of either quantitative or discrete traits. Multivariate linkage analysis of two or more traits (all quantitative, all discrete, or any combination) allows the inference of pleiotropy between the traits. The inclusion of multiple quantitative trait loci in linkage analysis allows the inference of epistasis between loci. A user-friendly graphical user interface facilitates the usage of jPAP.
Key Words: jPAP, Epistasis, Pleiotropy, Variance components linkage analysis, Quantitative trait loci
jPAP Description
jPAP (Java Pedigree Analysis Package) [1] is a versatile software package for likelihood analysis of family data [2] or for simulating phenotypes on pedigree members assuming a genetic model. In addition to linkage analysis, jPAP performs genetic model fitting, transmission disequilibrium testing, and measured genotype and association analysis. The genetic model may contain any number of loci and alleles. Additional model flexibility derives from the user selecting from libraries of frequency, transmission, discrete trait, quantitative trait, and within genotype modules, thereby specifying the assumptions and parameters for an analysis or simulation. Similar data flexibility in jPAP allows the pedigrees to be any size or structure and contain multiple ancestral branches and inbreeding or exchange loops.
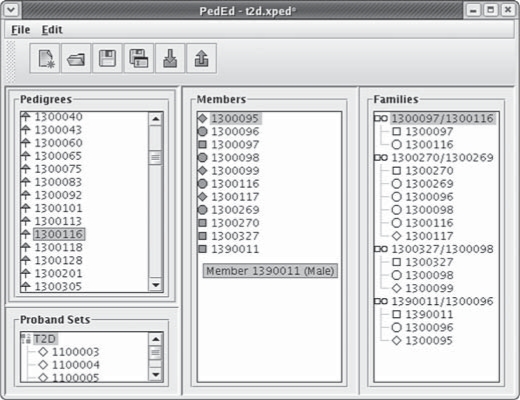
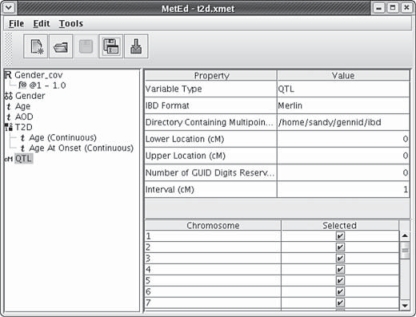
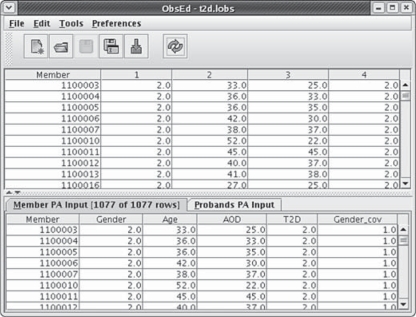
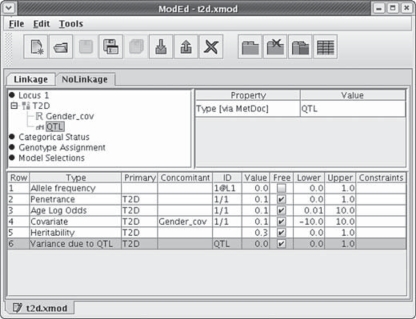
jPAP is accessed through a document-driven graphical user interface (GUI) written in Java. The main project window (fig. 1) specifies global settings, starts analyses, and launches jPAP's editors and viewers. The pedigree editor (fig. 2) allows family structure to be imported from jPAP, legacy PAP, or LINKAGE [3] format. The metadata editor (fig. 3) associates a name with each variable as well as specifying the transformation of quantitative traits and the cross-reference of onset and study age to discrete traits. The observation editor (fig. 4) displays both the original and transformed variables. The genetic model editor (fig. 5) uses a tree pane to graphically represent the modeled interrelationships between loci and variables, as well as the parameters to be estimated or fixed. An online tutorial (http://hasstedt.genetics.utah.edu/jpap/onlinetutorial/jpap.ppt.htm) demonstrates the use of the GUI.
Fig. 1.
The main project window is shown. File management and analysis commands are accessed either through drop-down menus or icons. Each of the four editors opens in a separate window. At the bottom of the window, other global settings are specified.
Fig. 2.
The pedigree editor is shown. The panels from left to right display pedigree IDs, members of the selected pedigree, and nuclear families within the selected pedigree, respectively. Probands for the ascertainment correction are listed in the lower left panel.
Fig. 3.
The metadata editor is shown. The left panel lists variable names, preceded by an icon to designate the variable type. Transformation of a continuous variable (Gender_cov) and the crossreference of onset and study age to a disease variable (T2D) are demonstrated. IBD probabilities produced by Merlin [5] have been imported for use in linkage analysis.
Fig. 4.
The observation editor is shown. The upper panel displays observables such as marker genotypes, trait values, and shared environment identifiers; the lower panel displays the variables selected for the genetic model reflecting any transformations specified in the metadata editor.
Fig. 5.
The genetic model editor is shown. T2D is assigned as the analysis trait, with Gender_cov and QTL assigned as factors affecting T2D risk. The right panel displays the properties of the item selected in the left panel. The lower panel lists the parameters of the model, each with an initial value for likelihood maximization or an assigned value. The tabs ‘Linkage’ and ‘NoLinkage’ identify a general model (shown) and a reduced model that differ in designating the QTL effect to be estimated or fixed at zero, respectively.
Variance Components Linkage Analysis
Genome-wide linkage analysis is available in jPAP using variance components methodology [4]. The capability of the jPAP GUI to batch a series of analysis runs and distribute them across multiple processors allows efficient execution of the genome scan. The linkage analysis model can include up to three quantitative trait loci (QTLs) as well as any number of shared environmental effects. The identity-by-descent (IBD) probabilities required for variance components linkage analysis can be estimated within jPAP using a Markov chain Monte Carlo (MCMC) method, or can be imported into jPAP from Merlin [5] or SOLAR [4] format.
jPAP estimates IBD probabilities using the MCMC methods of Thomas et al. [6]. The approach applies blocked Gibbs sampling [6, 7, 8, 9, 10], which produces reliable results, in contrast to the poor reliability obtained by earlier applications of MCMC methods to pedigree data [11, 12, 13, 14]. Blocked Gibbs sampling updates connected sets of variables by calculating their distribution conditional on all the neighbors of the block. When applied to multilocus genetic data, this involves two types of block update. The first is to update all the variables for a single genetic locus, conditional on the states of the variables at the neighboring loci. While sufficient for theoretical irreducibility of the induced Markov chain, better mixing properties are obtained by also including meiosis block updates, i.e. blocks of variables corresponding to small sets of meioses for all loci simultaneously. These updates are made using standard graphical modeling forward-backward algorithms as described by Thomas et al. [6].
Trait Models
Linkage analysis in jPAP can be performed on quantitative or discrete traits. Quantitative traits assume normality with power transformation optional. Discrete traits can be either age dependent or age independent. Both quantitative and discrete traits can be adjusted for covariates, and all parameters can be specified or estimated separately within a category such as gender or obesity status.
For age-dependent discrete traits, jPAP offers a modification of the age-of-onset regressive logistic model [15], also known as the age-at-diagnosis regressive model [16], and described as Method 2 in Cui et al. [17]. Let W represent the age at onset, or the age last examined if unaffected, and X = 0/1 for male/female. The logit of the probability of disease equals
logit [p(w, x)] = α + β(w – A) + γx
where p(w, x) = Pr(affected ∣ W = w, X = x) denotes the probability of disease, p = ln(α/(1 – α)) represents the penetrance at age A, exp(β) represents the annual odds ratio due to age, and exp(γ) represents the female/male odds ratio. Substituting a normal approximation for the underlying logistic density allows this implementation of the model to include polygenic and QTL effects. Figure 4 demonstrates the specification of this model in the jPAP model editor, with type 2 diabetes (T2D) assigned as the trait, gender and a QTL assigned as factors affecting T2D risk, and the parameters listed in the lower panel.
Using this model, we performed linkage analysis of T2D, accounting for age at diagnosis in the cases and age at study in unaffected relatives and including gender and body mass index (BMI) as covariates affecting T2D risk [18]. The sample included 1,344 individuals (1,082 diagnosed with T2D at a mean age of 30 years) from 530 families comprising the African-American subset of the Genetics of NIDDM (GENNID) sample. IBD probabilities were estimated using 5,914 autosomal single nucleotide polymorphisms (SNPs). The strongest linkage signal was a broad peak on chromosome 2; additional linkages were found on chromosomes 7 and 13.
Inference of Pleiotropy
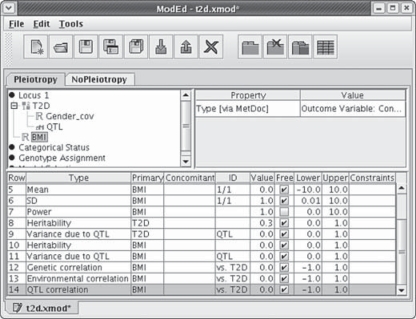
Multivariate linkage analysis in jPAP can include any number of traits, whether quantitative or discrete or a combination. Demonstrating bivariate analysis, figure 6 shows the assignment of two traits (T2D and BMI) to a single locus. For each trait pair, the parameters include the three correlations shown in the lower panel of figure 6: for the QTL effect, the residual polygenic effect, and the environmental effect; pleiotropy is inferred from significance of the QTL correlation. Bivariate linkage analysis on the African-American subset of the GENNID sample was used to infer pleiotropic T2D-lipid loci [19] and T2D-obesity loci [20].
Fig. 6.
The genetic model editor is shown for a bivariate model, specified by assigning both T2D and BMI to the same locus. The lower panel lists parameters specific to T2D, to BMI, and to both: the genetic, environmental, and QTL correlations between T2D and BMI. The tabs ‘Pleiotropy’ and ‘NoPleiotropy’ identify a general model (shown) and a reduced model that differ in designating the QTL correlation to be estimated or fixed at zero, respectively.
To identify pleiotropic T2D-lipid loci, we performed bivariate linkage analysis of lipid levels paired with T2D [19]. Significant evidence supported a pleiotropic low-density lipoprotein cholesterol-T2D locus on chromosome 1. In addition, near-significant evidence supported triglyceride-T2D loci at two locations on chromosome 2 and on chromosome 7. To identify pleiotropic T2D-obesity loci, we performed bivariate analysis of T2D with waist-hip ratio and BMI [20]. Of 12 T2D loci identified through suggestive or higher univariate lod scores, we inferred pleiotropy with obesity for six loci (on chromosomes 1, 2, 13, 16, 20, and 22). Consequently, linkage analysis using jPAP has provided evidence that at least some of the co-occurrence of dyslipidemia and obesity with T2D results from common underlying genes.
Inference of Epistasis
Linkage analysis in jPAP can accommodate up to three QTLs. Figure 7 shows the assignment of two QTL effects to a locus. In addition to a QTL effect attributed to each locus, the parameters include interaction effects between loci as shown in the lower panel of figure 7; epistasis is inferred from a significant interaction effect. One approach is to perform a genome scan on one QTL while fixing a second QTL at a location identified in a one-dimensional (1D) genome scan. However, epistatic loci that lack 1D effects will be missed. Alternatively, a two-dimensional (2D) genome scan assesses all pairs of locations in the genome, but requires more computation time. The latter approach was taken with sodium pump number, a risk factor for hypertension and obesity [21].
Fig. 7.
The genetic model editor is shown for an epistasis model, specified by assigning two QTLs (designated QTL and QTL2) to T2D. The parameters listed in the lower panel include each QTL effect and the interaction between the two QTLs. The tabs ‘Epistasis’ and ‘NoEpistasis’ identify a general (shown) and a reduced model that differ in designating the QTL interaction effect to be estimated or fixed at zero, respectively.
Variance components linkage analysis was applied to the number of red blood cell sodium pump sites measured by ouabain-binding assays on 1,375 members of 46 Utah pedigrees [21]. Both 1D and 2D genome-wide linkage analyses of pump number were performed on the combined sample as well as separately on the male and female subsets. Two significant 1D linkages were identified: on chromosome 1 in the combined sample and on chromosome 17 in the female subset. In addition, two significant 2D linkages were identified in the female subset: on chromosome 10 interacting with chromosome 18 and on chromosome 13 interacting with chromosome 4. None of the epistatic loci would have been identified in 1D analysis alone.
Segregation and Association Analysis
The capabilities of jPAP extend beyond linkage analysis. For example, by specifying a single locus with two alleles and selecting the transmission probabilities module in the model editor, jPAP performs segregation analysis to test a trait for major locus inheritance. Also, by translating a SNP into a continuous variable in the metadata editor and assigning the resulting variable as a covariate in the model editor, jPAP can test a SNP for association with a trait. Alternatively, by assigning a trait and SNP to the same locus, then testing for equivalence of the means (for a quantitative trait) or of penetrance (for a discrete trait), jPAP uses measured genotype analysis to test for association. Many more applications of jPAP are described in the online documentation.
Conclusions
Linkage studies exploiting the flexibility and versatility of jPAP have identified novel loci. Follow-up of each linkage region is now underway with the goal of identifying the causal variants responsible for the linkage signals, a search that will be aided by using jPAP for family-based association analysis.
Web Resources
jPAP http://hasstedt.genetics.utah.edu/
GENNID http://professional.diabetes.org/Diabetes_Research.aspx?typ=18&cid=64380
Acknowledgements
This work was supported by NIH grants HD17463 to Sandra Hasstedt and GM081417 to Alun Thomas. John Elliott and Kevin Cromer developed and implemented the jPAP GUI.
References
- 1.Hasstedt SJ. jPAP: document-driven software for genetic analysis. Genet Epidemiol. 2005;29:255. [Google Scholar]
- 2.Elston RC, Stewart J. A general model for the genetic analysis of pedigree data. Am J Hum Genet. 1971;53:234–251. doi: 10.1159/000152448. [DOI] [PubMed] [Google Scholar]
- 3.Lathrop GM, Lalouel JM, Julier C, Ott J. Strategies for multilocus linkage analysis in humans. Proc Natl Acad Sci USA. 1984;81:3443–3446. doi: 10.1073/pnas.81.11.3443. [DOI] [PMC free article] [PubMed] [Google Scholar]
- 4.Almasy L, Blangero J. Multipoint quantitative-trait linkage analysis in general pedigrees. Am J Hum Genet. 1998;62:1198–1211. doi: 10.1086/301844. [DOI] [PMC free article] [PubMed] [Google Scholar]
- 5.Abecasis GR, Cherny SS, Cookson WO, Cardon LR. Merlin – rapid analysis of dense genetic maps using sparse gene flow trees. Nat Genet. 2002;30:97–101. doi: 10.1038/ng786. [DOI] [PubMed] [Google Scholar]
- 6.Thomas A, Gutin A, Abkevich V, Bansal A. Multipoint linkage analysis by blocked Gibbs sampling. Stat Comput. 2000;10:259–269. [Google Scholar]
- 7.Jensen CS. Blocked-Gibbs sampling in very large probabilistic expert systems. Int J Hum Comput Stud. 1995;42:647–666. [Google Scholar]
- 8.Jensen CS, Kong A. Blocked Gibbs sampling for linkage analysis in large pedigrees with many loops. Technical Report R-96–2048. Denmark: Department of Computer Science, Aalborg University; 1996. [Google Scholar]
- 9.Jensen CS. Blocked Gibbs sampling for inference in large and complex Bayesian networks with applications in genetics. Denmark: Department of Computer Science, Institute for Electronic Systems, Aalborg University; 1997. PhD thesis. [Google Scholar]
- 10.George A, Thompson E. Multipoint linkage analysis for disease mapping in extended pedigrees. A Markov chain Monte Carlo approach. Seattle: Department of Statistics, University of Washington; 2002. Technical Report 405. [Google Scholar]
- 11.Sheehan N. Image processing procedures applied to the estimation of genotypes. Seattle: Department of Statistics, University of Washington; 1989. Technical report 176. [Google Scholar]
- 12.Sheehan N. Sampling genotypes on complex pedigrees with phenotypic constraints: the origin of the B allele among the Polar Eskimos. IMA J Math Appl Med Biol. 1992;9:1–18. doi: 10.1093/imammb/9.1.1. [DOI] [PubMed] [Google Scholar]
- 13.Sheehan N, Thomas A. On the irreducibility of a Markov chain defined on a space of genotype configurations by a sampling scheme. Biometrics. 1993;49:163–175. [PubMed] [Google Scholar]
- 14.Sobel E, Lange K. Descent graphs in pedigree analysis: applications to haplotyping, location scores, and marker-sharing statistics. Am J Hum Genet. 1996;58:1323–1337. [PMC free article] [PubMed] [Google Scholar]
- 15.Elston RC, George VT. Age of onset, age at examination, and other covariates in the analysis of family data. Genet Epidemiol. 1989;6:217–220. doi: 10.1002/gepi.1370060138. [DOI] [PubMed] [Google Scholar]
- 16.Schaid DJ, McDonnell SK, Blute ML, Thibodeau SN. Evidence for autosomal dominant inheritance of prostate cancer. Am J Hum Genet. 1998;62:1425–1438. doi: 10.1086/301862. [DOI] [PMC free article] [PubMed] [Google Scholar]
- 17.Cui JS, Spurdle AB, Southey MC, Dite GS, Venter D, McCredie MR, Giles GG, Chenevix-Trench G, Hopper JL. Regressive logistic and proportional hazards disease models for within-family analyses of measured genotypes, with application to a CYP17 polymorphism and breast cancer. Genet Epidemiol. 2003;24:161–172. doi: 10.1002/gepi.10222. [DOI] [PubMed] [Google Scholar]
- 18.Elbein SC, Das SK, Hallman DM, Hanis CL, Hasstedt SJ. Genome-wide linkage and admixture mapping of type 2 diabetes in African American families from the American Diabetes Association GENNID (Genetics of NIDDM) Study Cohort. Diabetes. 2009;58:268–274. doi: 10.2337/db08-0931. [DOI] [PMC free article] [PubMed] [Google Scholar]
- 19.Hasstedt SJ, Hanis CL, Elbein SC. Univariate and bivariate linkage analysis identifies pleiotropic loci underlying lipid levels and type 2 diabetes risk. Ann Hum Genet. 2010;74:308–315. doi: 10.1111/j.1469-1809.2010.00589.x. [DOI] [PMC free article] [PubMed] [Google Scholar]
- 20.Hasstedt SJ, Hanis CL, Das SK, Elbein SC. Pleiotropy of type 2 diabetes with obesity. J Hum Genet. 2011;56:491–495. doi: 10.1038/jhg.2011.46. [DOI] [PMC free article] [PubMed] [Google Scholar]
- 21.Hasstedt SJ, Xin Y, Hopkins PN, Hunt SC. Two-dimensional, sex-specific autosomal linkage scan of the number of sodium pump sites. J Hypertens. 2010;28:740–747. doi: 10.1097/HJH.0b013e3283353d41. [DOI] [PubMed] [Google Scholar]


