

Abstract
Human MnSOD is significantly more product-inhibited than bacterial MnSODs at high concentrations of superoxide (O2−). This behavior limits the amount of H2O2 produced at high [O2−]; its desirability can be explained by the multiple roles of H2O2 in mammalian cells, particularly its role in signaling. To investigate the mechanism of product inhibition in MnSOD, two yeast MnSODs, one from Saccharomyces cerevisiae mitochondria (ScMnSOD) and the other from Candida albicans cytosol (CaMnSODc), were isolated and characterized. ScMnSOD and CaMnSODc are similar in catalytic kinetics, spectroscopy and redox chemistry, and they both rest predominantly in the reduced state (unlike most other MnSODs). At high [O2−] the dismutation efficiencies of the yeast MnSODs surpass those of human and bacterial MnSODs, due to very low level of product inhibition. Optical and parallel-mode electron paramagnetic resonance (EPR) spectra suggest the presence of two Mn3+ species in yeast Mn3+SODs, including the well-characterized 5-coordinate Mn3+ species and a 6-coordinate L-Mn3+ species with hydroxide as the putative sixth ligand (L). The first and second coordination spheres of ScMnSOD are more similar to bacterial than to human MnSOD. Gln154, an H-bond donor to the Mn-coordinated solvent molecule, is slightly further away from Mn in yeast MnSODs, which may result in their unusual resting state. Mechanistically, the high efficiency of yeast MnSODs could be ascribed to putative translocation of an outer-sphere solvent molecule, which could destabilize the inhibited complex and enhance proton transfer from protein to peroxide. Our studies on yeast MnSODs indicate the unique nature of human MnSOD in that it predominantly undergoes the inhibited pathway at high [O2−].
INTRODUCTION
Superoxide dismutases (SODs) are enzymes that function to convert the superoxide (O2−) anion to dioxygen and hydrogen peroxide (H2O2) catalytically via sequential reduction and oxidation of a metal cofactor at virtually diffusion-controlled rate constants (Scheme 1).
Scheme 1.
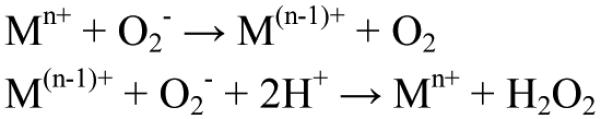
The Dismutase Mechanism
Manganese-containing superoxide dismutases (MnSODs) are found in a wide variety of species and, in these species, it can be localized either in the cytosol or the mitochondria or both. In bacteria, MnSOD is cytosolic while in yeast both mitochondrial and cytosolic forms exist. In mammalian cells it is mitochondrial. MnSOD catalyzes the disproportionation of O2− by a mechanism that distinguishes it from the other SODs in that it becomes a less effective antioxidant when O2− levels are high relative to enzyme concentration.1 Specifically, human MnSOD2 has been shown to be very inefficient at removal of high concentrations of O2− whereas the MnSOD from bacteria (Escherichia coli2 and Deinococcus radiodurans3) and yeast (Saccharomyces cerevisiae)4 are more efficient under the same conditions. It is this feature of differential efficiency at O2− removal that led to our interest in exploring the activity of MnSODs from different cellular sources and locations.
Efficient removal of high concentrations of O2− will, by necessity, produce high local concentrations of H2O2. H2O2 is a biologically important class of reactive oxygen species (ROS). It can be reduced to hydroxyl radical (•OH) through a Fenton-type reaction with a reduced metal (M(n-1)+ + H2O2 → Mn+ + OH− + •OH), whose reaction with cellular components causes severe damage to lipids, proteins, and nucleotides. The oxidative damage caused both directly and indirectly by H2O2 is implicated in cancer and aging.5,6 Besides its toxic effects, the roles of H2O2 in aiding phagocytes in the killing of ingested microorganisms as well as in some oxidative biosynthesis are well known.7 In addition in recent years there is rising evidence of H2O2 functioning as a signaling agent in higher organisms.7-11
The mechanism by which MnSOD removes high O2− concentrations less efficiently than other SODs involves product inhibition. The overall reduction of O2− by an oxidized metal (Scheme 2), when carried out by Mn2+SOD, occurs either through a pathway (reaction 2) where delivery of protons to the bound peroxo moiety is effectively instantaneous (an “outer-sphere” pathway), or through a pathway (reaction 3) where an identifiable transient is formed (an “inner-sphere” pathway), defined here as a “product-inhibited” complex that has been described as a side-on Mn(III)-peroxo species12. The inner-sphere pathway can become significant at high O2− concentrations and, if the dissociation of peroxide (k4) is relatively slow, this can lead to reduced catalytic efficiency of MnSOD. The level of product inhibition is described by k2/k3, the gating ratio of the two pathways.
Scheme 2.
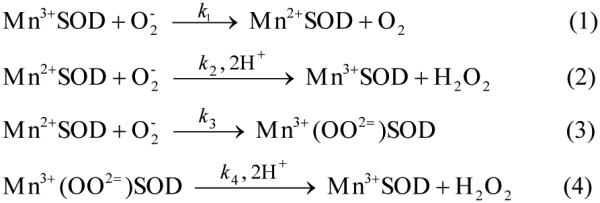
Catalytic Mechanism of MnSOD
S. cerevisiae is an important single-cell model for studying human and other eukaryotic cells. Like human cells, it expresses a homotetrameric MnSOD in its mitochondria (ScMnSOD), which shares sequence similarity with human MnSOD. To our surprise, our previous study showed ScMnSOD to be the most efficient at removing high O2− concentrations, among MnSODs that have been characterized to date.4 However, the origins of the low level of product inhibition are unclear.
S. cerevisiae and humans have a common cellular localization of their SODs. They both have MnSODs only in their mitochondrion and copper-zinc SODs (CuZnSOD) in their cytosol. In contrast, a closely related yeast Candida albicans expresses a MnSOD that lacks the mitochondrial leader sequence and is active in the cytosol (CaMnSODc)* in addition to its mitochondrial CaMnSOD and cytosolic CaCuZnSOD. CaMnSODc shares 70% sequence similarity with ScMnSOD and has been proposed to be important for survival of C. albicans in nutrient-limiting conditions.13 Overexpression of CaMnSODc has been shown to rescue the phenotypes of S. cerevisiae strain lacking the cytosolic CuZnSOD.13
In order to understand further the mechanism of product inhibition in MnSOD and its implication in H2O2 signaling in higher organisms, we isolated and characterized ScMnSOD and CaMnSODc. Herein we report the first comparison of the catalytic activity of the two yeast MnSODs, the crystal structures of their metal-binding sites, and their spectroscopic characterization. We discuss how these factors relate to the function of yeast MnSODs; we further compare human, bacterial, and yeast MnSODs; and we explore the implications with respect to the evolution of H2O2 signaling.
MATERIALS AND METHODS
DNA Manipulation of CaMnSODc and Transformation into S. cerevisiae
The pVT102U-CaMnSODc (with URA3 and AMP marker) vector containing the complete coding sequence of CaMnSODc was generously provided by Prof. Bourbonnais.13 Sequencing shows that it is an I169V mutant of the wild-type protein accidentally created during cloning. The primers 5′-GTTCCAATTATTGCCATCGATGCTTGGGAA-C-3′ and 5′-GTTCCCAAGCATCGATGGCAATAATTGGA-AC-3′ were used to create the wild-type cDNA (mutations are in bold type). The PCR products were transformed into E. coli DH5α strain and screened by ampicillin selection. The purified pVT102U-CaMnSODc vector was transformed into S. cerevisiae sod2Δ strain (EG110; Mat-alpha, ura3, leu2, trp1, his3, sod2::TRP1).
Expression and Purification of ScMnSOD and CaMnSODc
Yeast cells carrying Yep352-ScMnSOD4 were grown in YPEG media (1% yeast extract, 2% peptone, 3% glycerol, 2% ethanol, pH 4) supplemented with 0.5 mM Mn(II) sulfate at 30 °C to O.D. > 20, and then harvested by centrifugation at 12,000 × g for 10 min. ScMnSOD was-isolated as previously described.4
Yeast cells carrying pVT102U-CaMnSODc were grown in YPD (1% yeast extract, 2% peptone, 2% dextrose, pH 4) media supplemented with 0.5 mM Mn(II) sulfate at 30 °C to O.D. > 10, and then harvested by centrifugation at 12,000 × g for 10 min. The procedures for isolation of CaMnSODc and ScMnSOD were the same4 except that the procedures of the DE52 column were different. CaMnSODc does not bind tightly to the DE52 resin while most other proteins in the crude extract do. The active fractions from the hydrophobic interaction column were pooled and dialyzed against water and then 5 mM potassium phosphate, pH 8 at 4 °C. The protein then was loaded on a DE52 column, washed with 2 column volumes of 5 mM potassium phosphate, pH 8. CaMnSODc fell into the load and wash during the chromatography. The load and wash were combined, concentrated, and loaded onto a G300 gel filtration column.
Pulse Radiolysis
The pulse radiolysis experiments were carried out using the 2 MeV Van de Graaff accelerator at Brookhaven National Laboratory. Upon irradiation of water with a pulse of energetic electrons, hydrated electrons (eaq−), hydroxyl radicals (•OH) and, in lesser yield, hydrogen atoms (H•) are the primary radicals produced. Superoxide radical is then generated in air-saturated aqueous solution containing sodium formate through the following reactions: •OH + HCO2− → H2O + CO2•−, O2 + CO2•− → O2•− + CO2, eaq− + O2 → O2•−, H• + O2 → HO2•.
The experiments to measure catalytic rates were carried out using two methodologies. One set of studies involved oxidizing the resting enzyme with substoichiometric quantities of O2− and following the appearance of Mn3+SOD which has an absorbance band at around 480 nm (extinction coefficient ≈ 800 M−1cm−1). The rate of reaction 2 (k2) was determined by fitting the resultant time trace of Mn3+ growth to a first-order reaction. In this set of experiments, 2:1 [H2O2]:[MnSOD] was added as previous studies had shown that H2O2 effectively reduces Mn3+SOD to Mn2+SOD. The other method involved following the decay of various concentrations of O2− at 260 nm using a 1:1 to 1:50 ratio of [MnSOD]:[O2−]. Here, all the rate constants except k2 were calculated by fitting the data obtained to a mechanism described in Scheme 2 using the Chemical Kinetics program in PRWIN14.
All pulse radiolysis samples were prepared in 10 mM potassium phosphate, 10 mM sodium formate and 10 or 100 μM EDTA at 25 °C. All MnSOD concentrations were taken as the ICP-measured concentration of manganese in the sample. As all of the manganese concentrations were less than the corresponding protein concentrations, we assumed that all of the manganese was bound. This had the advantage of allowing direct comparison of activity of a tetrametric and a dimeric enzyme as everything is normalized to a monomeric unit. However, it also assumes no cooperativity between metal sites. The pH of the buffer was adjusted using ultrapure (Baker Ultrex) sodium hydroxide and sulphuric acid as needed.
EPR Spectroscopy
X-band (9.47 GHz) perpendicular-polarization (B0 ⊥ B1) continuous-wave electron paramagnetic resonance (CW EPR) spectra were recorded using a Bruker ECS106 spectrometer equipped with a TE102 cavity (ER3902ST). Parallel-polarization (B0 ∥ B1) data were acquired using a dual-mode cavity (ER 4116DM) operating at 9.39 GHz. Cryogenic temperatures were achieved and controlled using an Oxford Instruments ESR900 liquid helium cryostat in conjunction with an Oxford Instruments ITC503 temperature and gas flow controller. Spectral simulations were performed in MatLab using EasySpin 3.1.15,16
Crystallization of ScMnSOD and CaMnSODc
The apoprotein of ScMnSOD aggregates after the native protein is heated at 70 °C in MOPS, while the metallated ScMnSOD stays folded in solution. Fully metallated ScMnSOD was obtained by heating as-isolated protein (20 mM MOPS, pH 7) at 70 °C for 1 hr and removing aggregated protein by centrifugation. The reductive methylation of lysine residues of ScMnSOD was carried out as described, in order to improve the diffraction of protein crystals.17 The activity of native and methylated ScMnSOD is similar in SOD activity assay.18 All the free amino groups of lysine residues and the N-terminal were methylated as confirmed by mass spectrometry (Figure S1).
Methylated ScMnSOD was crystallized by hanging-drop vapor diffusion at 4 °C against a well solution of 0.2 M sodium malonate (pH 7) in 20% (w/v) polyethylene glycol 3,350 with a protein concentration of 7 mg/mL. Native CaMnSODc was crystallized by hanging-drop vapor diffusion at 4 °C against a solution of 0.1 M magnesium chloride, 0.1 M sodium chloride and 0.1 M tri-sodium citrate (pH 5.5) in 30% (w/v) polyethylene glycol 400 with a protein concentration of 7 mg/mL. ScMnSOD and CaMnSODc crystals were cryoprotected in mother liquor solution containing 30% glycerol and flash frozen in liquid nitrogen prior to data collection.
Crystallography: Data Collection and Refinement
All data was collected at 100K at the UCLA X-ray diffraction facility, using a Rigaku FRE+ generator and a Rigaku HTC detector. All data was processed using DENZO and SCALEPACK.19 ScMnSOD was phased by molecular replacement using human MnSOD Q143N mutant (1QNM). CaMnSODc was phased by molecular replacement using ScMnSOD (3LSU). All the molecular replacement was done using PHASER.20 The models were built using COOT.21 All model refinement was done using REFMAC22 and PHENIX23.
Coordinates and structure factors have been deposited in the PDB with accession numbers 3LSU for the ScMnSOD structure and 3QVN for the CaMnSODc structure.
Miscellaneous Methods
The metal contents of the purified proteins were determined by ICP-MS (Agilent 7500 series). UV-Visible absorption spectra were collected on a Shimadzu UV-2501 PC spectrophotometer.
The mass weight of the protein subunit was determined by an electrospray ionization mass spectrometry (ESI-MS) via a triple quadrupole instrument (API III, Applied Biosystems). An m/z 600–2,200 range was scanned (positive mode, orifice 90 V, 0.3 Da step size, 5.61 s/scan). Data were processed and analyzed using MacSpec 3.3, Hypermass and BioMultiview 1.3.1 software (Applied Biosystems).
The mass weight of the native protein was determined by a HPLC (Agilent 1200 series) fitted with a size exclusion col umn (Tosoh Bioscience, TSK gel G2000SW 7.5 mm ID × 30 cm) at a flow rate of 0.5 mL/min. The column was calibrated using five standards: bovine thyroglobulin (670 kDa), bovine γ-globulin (158 kDa), ovalbumin (44 kDa), horse myoglobin (17 kDa), and vitamin B12 (1.35 kDa).
RESULTS
Tetramer versus Dimer
CaMnSODc was overexpressed and purified from S. cerevisiae, with 0.6 equiv of manganese per subunit as determined by ICP-MS. The subunit mass weight is 22.7 kDa as determined by ESI-MS. The purity was confirmed by SDS-PAGE gel (Figure S2). CaMnSODc has been reported to be a homotetramer13, but our investigation of the native protein using gel filtration chromatography indicates that its molecular weight in solution under our conditions is ~46 kDa, corresponding to a homodimer (Figure 1). It should be noted, however, that we found that CaMnSODc crystallized as a tetramer under other conditions (see below). ScMnSOD, in contrast to CaMnSODc and analogous to the human MnSOD, is a homotetramer under our conditions, although the two yeast enzymes share great sequence similarity.
FIGURE 1.
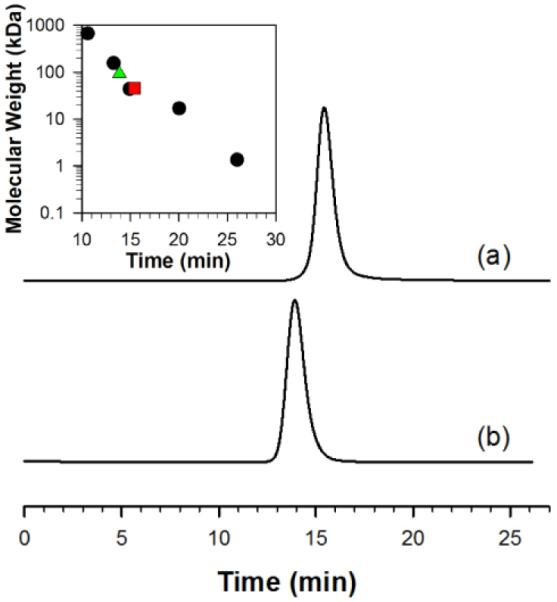
The HPLC-SEC profiles of CaMnSODc (a) and ScMnSOD (b). Inset: The plot of the molecular weight of the five standards (black, circles), ScMnSOD (green, triangle) and CaMnSODc (red, square) versus their retention time. The concentration of proteins loaded into the column is 6 mg/mL. The column was calibrated using five standards: 1) bovine thyroglobulin (670 kDa), 2) bovine γ-globulin (158 kDa), 3) ovalbumin (44 kDa), 4) horse myoglobin (17 kDa), and 5) vitamin B12 (1.35 kDa). The buffer contained 50 mM sodium phosphate (pH 6.7) and 50 mM sodium chloride.
Kinetic Studies
Solutions containing 1 μM MnSOD at pH 7 were pulse irradiated and the disappearance of O2− was followed at 260 nm; see Figure 2. The traces we collected for both CaMnSODc and ScMnSOD were plotted along with previous data collected under identical conditions for MnSOD from human, E. coli and D. radiodurans.2,3 When the O2− concentration was seven-fold excess over the enzyme, human MnSOD already showed a depressed activity, yet the O2− disappearance as a function of time was similar for the other four enzymes and could be fit to a first-order process (Figure 2A). When the ratio of [O2−]:MnSOD increased to 41, the five MnSODs displayed dramatically different efficiencies at removing O2− (Figure 2B), which scale as CaMnSODc > ScMnSOD > D. radiodurans (DrMnSOD) > E. coli (EcMnSOD) > human MnSOD. For human and E. coli MnSOD, the O2− decay was characterized by a fast decrease, followed by a slow almost zero-order phase. It is the biphasic nature of the trace that suggests dismutation proceeded by a fast catalytic pathway and a slower, concomitant product-inhibited pathway. The gating values for these two enzymes are 1 and 5 respectively.2 The trace obtained for the DrMnSOD showed a much less distinct plateau region and fitting the data yielded a gating value of 12.3 Our earlier study of the reaction of ScMnSOD with high O2− concentrations led to a calculated gating value k2/k3 to be 16-20, indicating that the fast protonation pathway dominates.4
FIGURE 2.

Decay of 7 μM (A) and 41 μM (B) O2− catalyzed by 1 μM (in Mn) human (a, black), E. coli (b, red), D. radiodurans (c, blue) MnSOD, ScMnSOD (d, green) and CaMnSODc (e, pink). The sample for pulse radiolysis contained 10 mM potassium phosphate (pH 7), 10 mM sodium formate and 10 μM EDTA. The O2− concentration in these figures is calculated from the absorbance at 260 nm.
CaMnSODc removes high concentrations of O2− even more efficiently than ScMnSOD. Here, k2 of CaMnSODc was determined to be 1.0 × 10⁹ M·s−1 by following the appearance of Mn3+SOD (λmax = 480 nm; see method, Figure S3) as CaMn2+SODc was oxidized by substoichiometric amounts of O2−. However, at physiological pH (6.5–7.5), CaMnSODc removed various concentrations of O2− ([O2−]:[MnSOD] from 2–48:1) at similar rates, showing that only minimal product inhibition occurred under these conditions. Even at [O2−]:MnSOD ratios as high as 48, the activity of CaMnSODc was comparable to that of S. cerevisiae CuZnSOD, an enzyme that does not exhibit product inhibition (Figure S4). The disappearance of O2− catalyzed by CaMnSODc could be fitted to a first-order process.
To achieve such a high efficiency, CaMnSODc would either carry such a high gating ratio (k2/k3) that the reaction of Mn2+SOD with O2− proceeds almost completely via the fast protonation (reaction 2), or it has such a high dissociation rate (k4) that the product-inhibited complex decomposes before it is detected during pulse radiolysis (reaction 4). Assuming that k4 is 50 s−1, which is close to that of bacterial dimeric MnSODs, the calculated k2/k3 is 65. Assuming that k2/k3 is 20, which is comparable to that for ScMnSOD, k4 is calculated to be 210 s−1. The latter scenario is more likely, because a dissociation rate of 210 s−1 is not dramatically different from a k4 of 130 s−1 for human MnSOD and 90-140 s−1 for ScMnSOD. In addition, dissociation rates as large as 1000 s−1 have been reported in human Y34 mutants.24 A k2/k3 ratio of 65, however, is three times as large as the gating ratio of ScMnSOD, the least inhibited MnSOD that has been characterized to date. Therefore, the high efficiency of CaMnSODc is more likely due to the fast dissociation of the inhibited complex from the metal center.
Previous studies have shown that the rate of enzymatic catalysis as a function of pH is different for the human and bacterial MnSODs. Given that a major difference between the human and bacterial MnSODs is that the former is a tetramer while the latter are dimers, we compare here two yeast MnSODs, where one is a dimer and the other is a tetramer. In these studies we were initially interested only in the change in the fast catalytic cycle (k1 and k2), which was measured by following the disappearance of O2− in the presence of ScMnSOD or CaMnSODc under conditions where the [O2−]:MnSOD ratio was between 1 and 3. The overall activity of both ScMnSOD and CaMnSODc decreased considerably as pH was increased (Figure 3). Both yeast enzymes resemble EcMnSOD, with a relatively constant activity up to pH 9, but are distinct from human MnSOD, where catalysis is relatively unchanged even up to pH 11. It is surprising that ScMnSOD and CaMnSODc are different in their quaternary structure, yet they exhibit such similar pH dependence. It is notable that the yeast MnSODs are even more sensitive to the change of pH than the bacterial MnSODs. The pK is ~8.5 in two yeast MnSODs, ~9.5 in EcMnSOD and ~10.5 in human MnSOD. Adjusting the pH of yeast MnSOD sample solutions from 9.5 back to 7 resulted in the restoration of their activity to ~50% of that of the intact enzymes (Figure 3).
FIGURE 3.
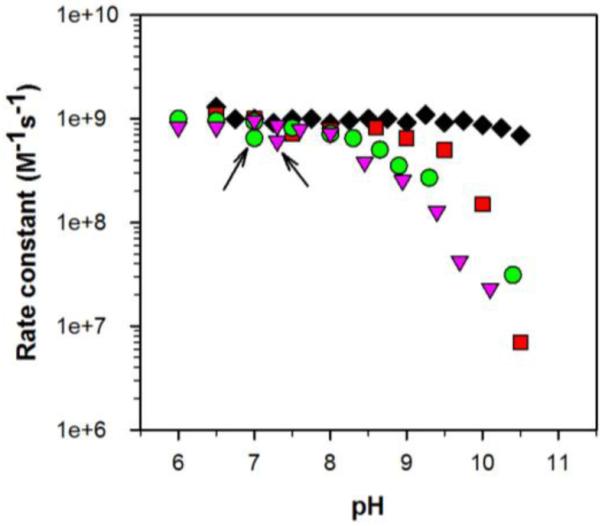
The effects of pH on the overall activity of MnSODs. The rate constant was determined by fitting the disproportionation of low doses of O2− ([O2−]:MnSOD from 1–3) to a first-order process. Under these [O2−]:MnSOD ratios, the reaction of Mn2+SOD with O2− proceeds predominantly through the outer-sphere pathway. This rate constant reflects a combination of k1 and k2. MnSOD is from human (black, diamonds), E. coli (red, rectangles), S. cerevisiae (green, circles) and C. albicans (pink, triangles). The data points marked with an arrow correspond to the rate constants measured for the yeast enzymes after adjusting the pH of sample solution from 9.5 to neutral.
pH also has an impact on the level of product inhibition exhibited by ScMnSOD. The slow almost zero-order phase, which is a sign of the saturation of MnSOD by O2−, was discernable from the reaction of high concentrations of O2− ([O2−]:MnSOD = 48:1) with ScMnSOD at pH 8.9 (Figure 4). This feature was barely seen under the same conditions at pH 7.5. The gating ratio k2/k3 and the dissociation rate k4 were calculated by fitting the O2− decay into the four-reaction mechanism (Scheme 2; Figure 4, inset). The calculated k2/k3 is a constant value over the pH range of 7–9.5. The dissociation rate k4, however, dramatically decreases when pH is raised to 8 and reaches a plateau at pH ~8.5 with a pK of ~8. Due to a depressed k4, the dissociation of H2O2 from the active site may become the rate-limiting step at high pH, resulting in a more inhibited ScMnSOD. The values of k2/k3 and k4 of ScMnSOD were difficult to calculate at pH > 9.5, at which point k1 and k2 corresponded to the rate-limiting steps of the reaction. In the case that k4 stays constant at the plateau while k1, k2 and k3 continue decreasing at pH >9.5, the dissociation of the inhibited complex may occur faster than its formation, leading to a decay of O2− at pH >9.5 that appeared to be non-inhibited.
FIGURE 4.
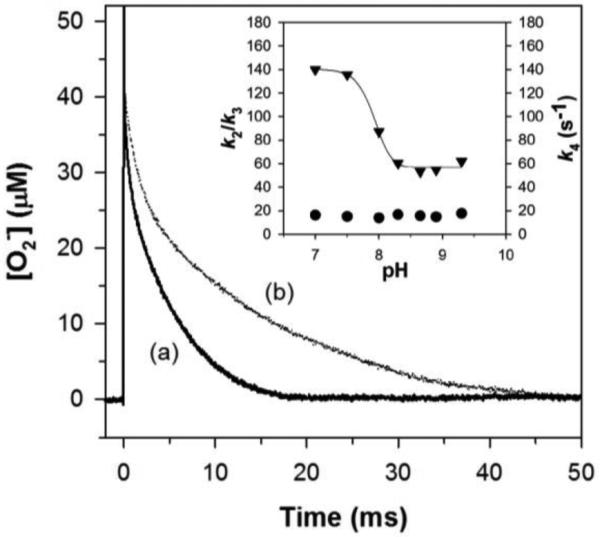
Dependence of the level of product inhibition of ScMnSOD on pH. Decay of 48 μM O2− catalyzed by 1 μM (in Mn) ScMnSOD at pH 7.5 (a) and 8.9 (b). Inset: Dependence of the values of k2/k3 (circles) and k4 (triangles) of ScMnSOD on pH. The sample for pulse radiolysis contained 10 mM potassium phosphate (pH 7), 10 mM sodium formate and 10 μM EDTA.
CaMnSODc, in contrast, did not show a pronounced occurrence of the slow zero-order phase even at elevated pH (Figure S5). The decay of O2− over the pH range of 7–9.5 could still be fit to a first-order process (R2 = 1.5). In this case it is difficult to calculate either the ratio of k2/k3 or the value of k4 based on fitting.
Oxidation State
Our previous work showed that tetrameric ScMnSOD, unlike all other wild-type MnSODs studied thus far, is isolated predominantly in the 2+ oxidation state.4 Dimeric CaMnSODc, structurally similar to bacterial MnSODs, is also isolated in the Mn2+ state (Figure S6-A). The two enzymes from yeast are also very similar with respect to the thermodynamics of oxidation and reduction. From this point on, if the results are very similar for the two yeast MnSODs, data from only one enzyme are shown.
The optical absorption spectrum of as-isolated ScMnSOD has a very weak visible absorption band around 480 nm (Figure 5A) that suggests that a small amount of Mn3+SOD is present along with a significantly larger amount of Mn2+SOD. The addition of sodium hyposulfite fully reduced the enzyme and completely quenched this absorption intensity (Figure 5A). Based on the difference in absorption between the fully reduced and the as-isolated enzyme (Figure 5A, insert) and using the extinction coefficient for Mn3+SOD obtained from pulse radiolysis (ε475 = 780 M−1cm−1), ~5% of the as-isolated enzyme is oxidized. The oxidized enzymes found in both asisolated ScMnSOD and CaMnSODc have spectra that differ from those of most reported Mn3+SODs in that additional absorption intensity at ~390 nm is visible (Figure 5A, inset; Figure S6-A, inset). They are, however, similar to the spectrum of ScMn3+SOD that was reported previously.25
FIGURE 5.

The oxidation state of ScMnSOD. (A) Optical spectra of as-isolated ScMnSOD (solid line) and ScMnSOD reduced by sodium hydrosulfite (dashed line). Inset: The difference spectrum between as-isolated and reduced ScMnSOD. (B) Optical spectra of ScMnSOD oxidized by potassium permanganate ([KMnO4]:MnSOD = 0.75:1) at pH 7.4 as measured over time. Time 0 refers to the start of the first scan immediately after mixing KMnO4 with the enzyme. (C) Reduction of ScMn3+SOD (solid line, oxidized by 0.75 equiv of KMnO4 and allowed to equilibrate at room temperature for 2 hr) by one equiv of sodium ascorbate (dotted line). (D) Optical spectra of ScMn3+SOD at different pH. The sample solutions contained 190 μM (in Mn) enzyme in 25 mM potassium phosphate (pH 7.4).
Oxidation of as-isolated ScMn2+SOD or CaMn2+SODc by 0.75 equivalents of potassium permanganate rapidly gave absorption spectra characteristic of 5-coordinate Mn3+SOD with a maximum at 480 nm (Figure 5B, S6-B) with no residual absorbance of permanganate. Both yeast MnSODs remained oxidized in solution and retained full activity as determined by pulse radiolysis. Interestingly, an absorption intensity around 390 nm increased slowly over time (Figure 5B, S6-B). Based on the difference between the immediately scanned and the final spectrum (Figure S7), a Mn3+-containing species different from the 5-coordinate Mn3+SOD was formed over time. Further addition of 1 equivalent of sodium ascorbate selectively bleached the absorption of ScMn3+SOD or CaMn3+SODc around 390 nm, yielding the characteristic 5-coordinate Mn3+SOD spectrum (Figure 5C, S6-C), which has been reported previously.25 Treatment of the yeast enzymes with 10-fold molar excess of ascorbate yielded the completely reduced enzymes. Therefore, the unknown species is kinetically more prone to reduction by ascorbate than the well-characterized 5-coordinate species. In contrast, In contrast, 0.5 equivalent of H2O2 reduced the 5-coordinate Mn3+ and the unknown species simultaneously in one equivalent of yeast Mn3+SODs, giving optical spectra of full reduced MnSOD (data not shown). The slow formation of the 6-coordinate adduct and its susceptibility to reduction by ascorbate are very puzzling, and we will continue exploring the explanation in future.
One species known to absorb around 390 nm is the low-temperature EcMn3+SOD:azide adduct. At room temperature, the 5-coordinate EcMn3+SOD binds azide in such a fashion that the coordination number of the Mn ion does not change. At lower temperatures (pK = 200 K) this adduct transforms into an inner-sphere 6-coordinate azide-Mn3+SOD complex.26 The room-temperature spectrum of azide-treated ScMn3+SOD shows a shift of the absorption band similar to that observed in other azide-Mn3+SODs26 (Figure S8). However, there remains additional intensity at 390 nm that is reminiscent of the features present in the spectrum of the low-temperature azide adduct of EcMn3+SOD where azide is directly bound to the Mn ion. This may indicate that the unknown species in ScMn3+SOD is also 6-coordinate.
The measurement of the redox potential of MnSOD is notoriously difficult. Our electrochemical studies on ScMnSOD and CaMnSODc failed to achieve efficient electron transfer between the electrode and the enzymes and thus only yielded an approximation of their redox potential as ~0.3 V. This value is comparable to those determined for E. coli (0.3 V)27 and human (0.4 V)28 MnSOD, which are a reflection of the redox potential of the 5-coordinate Mn3+SOD species. The redox potentials of human and E. coli MnSOD are close to that of ascorbate•−, H+/ascorbateH− (E° = 282 mV) at neutral pH.
The Mn3+SOD spectra obtained from pulse radiolysis, in which ScMn2+SOD or CaMn2+SODc was oxidized by substoichiometric amount of O2− (see method), merely showed formation of the well characterized 5-coordinate Mn3+SOD4 and were comparable to those of other Mn3+SODs3,29 (Figure 6). However, the time scale of each single measurement at each wavelength was shorter than 1 ms. Over 10 ms the reduction of yeast Mn3+SODs by excess H2O2 was discernable. Therefore, the generation of the putative L-Mn3+SOD species likely occurred more slowly under pulse radiolysis conditions than the reduction of the 5-coordinate Mn3+ center by H2O2. Indeed the shifting of the spectrum around 390 nm was discernable in a much longer timescale (> 10 min) from the oxidation of asisolated ScMnSOD using 60Co radiation as the source of O2− (Figure S9).
FIGURE 6.
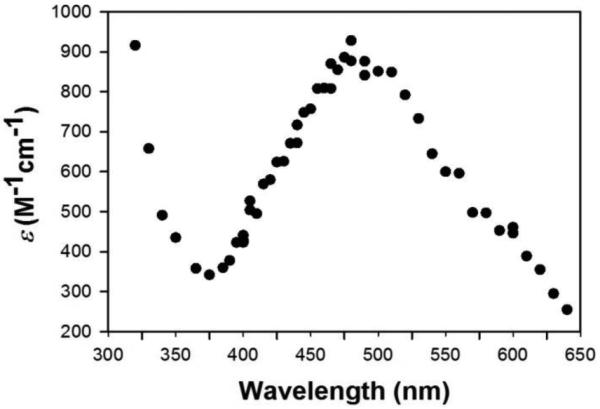
The Mn3+SOD spectrum of CaMnSODc obtained from pulse radiolysis. The pulse radiolysis sample contained 60 μM (in Mn) CaMnSODc in 10 mM potassium phosphate (pH 7), 10 mM sodium formate and 100 μM EDTA. The enzyme was reduced prior to each pulse with 120 μM H2O2.
MnSODs that are isolated in the Mn3+ state possess absorption spectra that change modestly as pH is raised. For example, at pH > 9 the 478 nm absorption feature corresponding to EcMn3+SOD begins to diminish slightly in intensity and shifts to shorter wavelength. This pK event has been ascribed to deprotonation of Tyr34 (numbering in ScMnSOD).30 However, for ScMnSOD and CaMnSODc the absorption intensity around 390 nm increased as pH was increased (Figure 5D, S6-D). ScMnSOD and CaMnSODc may not have the same pK as other Mn3+SODs, or the spectral change due to the pK may have been obscured by the absorption shifting around 390 nm. The Mn3+ spectra of ScMnSOD obtained from pulse radiolysis at pH 7 and 10 were compared, and a roughly 20% decrease in intensity but no shift in peak for the Mn3+SOD absorbance at 480 nm were observed (Figure S10). The spectral shift over pH indicates that the sixth ligand is likely a hydroxide that with a higher concentration binds to Mn3+ more readily at high pH.
EPR Spectra
In agreement with the electronic absorption data shown above, results from perpendicular-mode X-band EPR experiments confirm that CaMnSODc is isolated pre-dominately in the Mn2+ oxidation state (Figure S11-A). These spectra are similar to those obtained for EcMn2+SOD with five separate electronic spin transitions observed due to zero- field splitting of the manifold of spin levels of the high-spin (S = 5/2) Mn2+ ion. These resonances are further split by the hyperfine interaction of the electron spin with the 55Mn nuclear spin (I = 5/2). The corresponding parallel-mode EPR spectrum for as-isolated CaMnSODc possesses little intensity (Figure S11-B). In contrast, the spectra of the pH 7.65 permanganate-oxidized samples have at least eight intense transitions centered at 80 mT (g = 8.4) (Figure 7A) that are somewhat similar to the six parallel-mode EPR transitions separated by ≈10 mT observed previously for EcMn3+SOD.31 Campbell et al,31 showed that these signals arise from transitions within the mS = |±2〉 manifolds of a high-spin (S = 2) Mn(III) system. Analysis of the temperature-dependence of the integrated signal intensity led to an evaluation of the magnitude and, importantly, sign of the zero-field splitting parameters—D = +2.10 cm−1 and E = 0.24 cm−1. (NOTE: These values are consistent with those determined by analysis of variable-temperature, variable-field magnetic circular dichroism saturation behavior.32) That D > 0 indicates that the lowest unoccupied metal-centered molecular orbital (MO) is 3dz2-based.33 These conclusions are borne out by the trigonal bipyramidal coordination geometry of the Mn3+ site determined by X-ray crystallography as well as results of numerous electronic structure calculations.34
FIGURE 7.

(A) Parallel-mode CW EPR spectrum of CaMn3+SODc and ScMn3+SOD oxidized by potassium permanganate ([ScMnSOD]:KMnO4 = 1:0.75) and of ScMn3+SOD treated with 1 equivalent of sodium ascorbate. (B) The deconvolution of the two spectra (top two spectra in panel A) of the permanganate-oxidized species shows two components, one assigned to a Mn3+ center with a 5A1g ground state and one with a 5B1g ground state. Instrument settings: ν = 9.3959 GHz; microwave power = 32 mW; sweep rate = 1.81 mT/s; temp = 4.9 K.
In the present case of ScMn3+SOD and CaMn3+SODc, more than six parallel-mode resonances are observed, indicating that there are at least two Mn3+-containing species present in the sample. Subtraction of the EPR spectrum of EcMn3+SOD from that of ScMn3+SOD reveals an underlying sextet with interpeak spacings of approximately 4.5–5.0 mT (Figure 7B). Such a small effective 55Mn hyperfine coupling parameter (A∥) has been observed previously for several 6-coordinate Mn(III) centers.33,35,36 There has also been a preliminary report that showed a fraction of 5-coordinate EcMn3+SOD converts to a new species at pH 11.54 that is characterized by a parallel-mode EPR spectrum with A∥ (55Mn) = 3.3 mT.31
The dramatic difference in A∥ for the two spectroscopically distinct ScMn3+SOD species is likely resulted from a change in the electronic ground state for the Mn3+ ion—from 5A1g to 5B1g.33 Respectively, these states correspond to d-electron configurations wherein the 3dz2-based and 3dx2 – y2-based MOs are empty. A simple explanation for this change would be a new, strong ligand binding in the equatorial plane to the Mn3+ ion. This event would raise the energy of the 3dx2 – y2-based MO allowing the fourth d-electron to occupy the 3dz2 orbital instead.
The EPR transition observed for both electron configurations is between the mS = |±2〉 spin levels. For the 5B1g state, the axial zero-field splitting interaction (D) will be negatively signed, putting the |±2〉 manifold lowest in energy. Thus this manifold will be populated at all temperatures and if the energy splitting (Δ) of the mS = |±2〉 spin levels at zero field is less than the energy of the incident microwave radiation (hν = 0.319 cm–1 for the 9.396 GHz radiation employed here) a parallel-mode EPR transition will be observed. However, for the 5A1g state, the sign of D is positive and the |±2〉 manifold will not be populated at low temperatures. For CaMn3+SODc, increasing the temperature thermally populates this manifold and the EPR transition becomes apparent. By monitoring the temperature-dependent intensity of the peak at 58 mT we have determined that D = +1.90 cm−1 and E = 0.20 cm−1, values similar to those found for the 5-coordinate form of EcMn3+SOD (see Figure S12).
Upon treatment of ScMn3+SOD with 1 equivalent of ascorbate, the 5B1g contribution to the parallel-mode EPR spectrum completely disappears (compare second and third traces in Figure 7A). This spectral change coincides with bleaching of the 390 nm feature in the electronic absorption spectrum (Figure 5C) upon addition of ascorbate, suggesting the narrowly split EPR signal and the 390 nm absorption intensity are spectral signatures of the same species.
Crystal Structure
The active site structure of the two yeast MnSODs was investigated by crystallography (Table S1). The crystals of both yeast MnSODs are colorless. The X-ray crystallography structure of ScMnSOD is always a tetramer (Figure S13-A). To our surprise, the quaternary structure of CaMnSODc varied with crystallization conditions. It is either a dimer (data not shown) or a tetramer (Figure S13-B). We believe that the quaternary structure of CaMnSODc depends on buffer condition (ion strength and viscosity) and protein concentration, and we will explore the factors that control its quaternary structure in a future publication.
ScMnSOD and CaMnSODc both maintain the 5-coordinate sphere of manganese conserved in all other MnSODs (Figure 8).34,37-40 Their active sites are superimposable, giving a root mean square deviation (RMSD) of 0.20 Å (Figure S14). For both enzymes the observed manganese bond lengths are ~2.2 Å to each His NE2, 2.0 Å to Asp OD2, and 2.3 Å to OH2 (Table S2). These are only slightly longer than the corresponding distances in MnSODs that rest predominantly in the Mn3+ state. Spectroscopic and computational evidence suggests that in the reduced state Mn is bound by a water molecule and in the oxidized state it is bound by a hydroxide.41 The distance of the Mn–O bond should be farther in the bound water as it is not as strong a bond and closer in the bound hydroxide. The long Mn–O (solvent molecule) distances in both yeast MnSODs are consistent with Mn2+–OH2 moieties. Although these shifts are small and within possible experimental error, the observed longer coordination bond distances could reflect the 2+ oxidation state of ScMnSOD and CaMnSODc.
FIGURE 8.
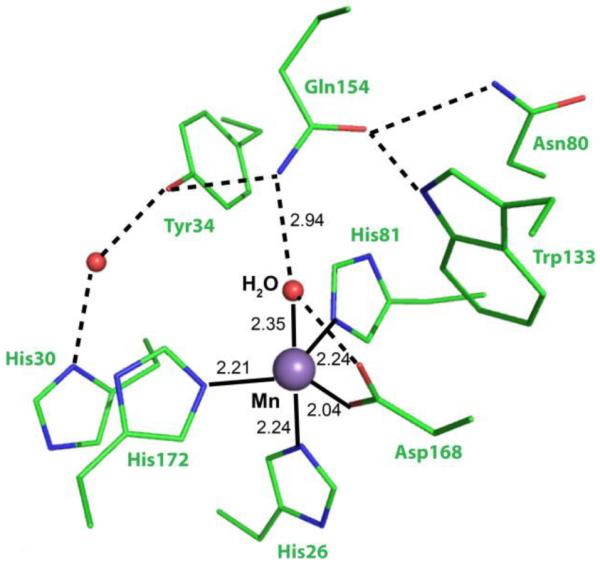
Active site structure of ScMnSOD, showing the coordination sphere of manganese (chain A). Some second coordination sphere residues are also shown. Coordination and hydrogen bonds are indicated as solid and dashed lines, respectively.
During X-ray crystallography data collections, metalloenzyme crystals are likely to be reduced by photoelectrons generated from the excitation of protein and solvent atoms by the incident X-ray beam.42 As ScMnSOD and CaMnSODc are both isolated in the reduced form as indicated by their optical and EPR spectra (Figure 5, S6 and S11), the X-ray structures are certainly those of the reduced (Mn2+SOD) enzymes. For other MnSODs that are isolated in the Mn3+ oxidation state, active site bond distances measured in their X-ray structures (Table S2) would suggest that the human and Thermus thermophilus crystals contained primarily Mn3+SOD and the remaining MnSODs were likely primarily reduced during the data collection.
DISCUSSION
The Relationship of Product Inhibition to Active Site Structure
Based on the structural and sequence similarity shared between ScMnSOD and human MnSOD, ScMnSOD was expected to exhibit a level of product inhibition similar to human MnSOD. However, we found that ScMnSOD is dramatically gated toward the fast protonation pathway. CaMnSODc resembles ScMnSOD in its efficiency of removing O2− at high O2− doses. The yeast MnSODs are more like bacterial MnSODs in terms of function. Our studies on yeast MnSODs place human MnSOD in a unique class that predominantly undergoes the product-inhibited pathway at high levels of O2− among MnSODs that have been characterized to date.
Numerous studies on the structure-function relationship of MnSOD have been focused on the structure of second coordination sphere structure,24,43-47 which is highly conserved in MnSOD from different organisms.34,37-39 Superposition of all active site residues (within 6 Å of Mn) of ScMnSOD on those of human or E. coli MnSOD gives RMSD of 0.25 and 0.18 Å, respectively (Figure 9), indicating that in terms of second coordination sphere, ScMnSOD resembles EcMnSOD more than it does human MnSOD, in spite of the fact that ScMnSOD and human MnSOD are both tetramers and share greater sequence similarity. Of particular significance are highly conserved residues Tyr34 and His30, mutations of which usually cause changes in product inhibition.24,48 Their positions in ScMnSOD overlap more with those in EcMnSOD than with those in human MnSOD (Figure 9). One would expect subtle shifts of these residues in the second coordination sphere to cause dramatic differences in the degree of product inhibition among MnSOD from different species. The factors that control the level of product inhibition will be subjects of future investigations.
FIGURE 9.

Superposition of the first and second coordination sphere of ScMnSOD to that of human MnSOD (pink, A) and EcMnSOD (yellow, B).
The Unusual Resting State of Yeast MnSODs and the Role of Gln154
In contrast to human and bacterial MnSODs that rest predominantly as Mn3+SOD, the as-isolated proteins of yeast MnSODs are both ~95% reduced. Our preliminary electrochemical results indicate that the redox potentials of yeast MnSODs are comparable to those determined for human and bacterial MnSODs. However, previous studies on EcMnSOD have shown spontaneous oxidation of EcMn2+SOD in air29, which does not occur in yeast MnSODs. Therefore, the unusual resting state of the yeast enzymes may result from thermodynamically driven shifts in oxidation-reduction equilibria.
The fact that yeast MnSODs rest as Mn2+SOD could be linked with the positioning of an outer-sphere residue, Gln154 (the numbering in ScMnSOD; CaMnSODc: Gln163; human: Gln143; E. coli: Gln146). Conserved in all Mn and FeSODs, Gln154 donates an H-bond to the metal-bound solvent molecule, and is the only contact of the metal-bound solvent molecule to the protein beyond the active site. Gln154 makes three hydrogen bonds to three highly conserved residues, Tyr34, Asn80 and Trp133 (numbering in ScMnSOD). Its hydrogen bonding potential is fully utilized and Gln154 seems firmly fixed in place. Gln154 together with Asp168 that is an H-bond acceptor from the metal-coordinated H2O or OH−, determine the position of the coordinated solvent molecule. Mutagenesis on Gln154 often causes dramatic depression of reactivity,43,44,46 indicating the key role of the NE2(Gln154)⋯O(solv) bond.
The active site reduction midpoint potential (Em) contributes directly to the driving forces of the two half reactions of O2− dismutation. In Mn and FeSOD (structural homologs), Gln154 is critical in modulating Em and thus contributes to the ion specificity as well as determining the resting state of Mn and FeSOD.12,49 The second coordination sphere of Mn and FeSOD is similar except that the Gln154 amide nitrogen is ~0.7 Å further from the metal in FeSOD. DFT calculations on the structure of Mn and FeSOD suggest the reason of MnSOD resting predominantly in the Mn3+ state as the destabilization of coordinated H2O vs. OH− by the closely placed glutamine side chain.12,50 In Mn-substituted EcFeSOD in which Mn is placed away from Gln69, the Em is elevated by 670 mV and the enzyme completely rests as the reduced form.51 Mutation of Gln143 to asparagine in human MnSOD also causes the enzyme to rest as Mn2+SOD.43 Either EcMn(Fe)SOD or human Q143 mutants is only able to catalyze one half reaction, the oxidation of O2−.43,51
Most MnSODs with solved structure conserve a NE2(Gln154)⋯O(solv) H-bond of 2.85–2.95 Å (Table S2), and, as indicated by previous studies, the further the Gln154 amide nitrogen is away from Mn, the more the 2+ state is favored by the enzyme. Thus, the observation that the distance of Gln154 to Mn is slightly longer in the two yeast MnSODs (4.79 and 4.73 Å in ScMnSOD and CaMnSODc, respectively) than in the MnSODs that predominantly rest in the oxidized form (Human: 4.65 Å; E. coli: 4.64 Å; D. radiodurans: 4.54 Å; Caenorhabditis elegans: 4.54 Å) may be related to fact that the yeast MnSODs rest in the reduced state.
The Relationship of Product Inhibition of Human MnSOD to H2O2 Signaling in Mammals
Human MnSOD is much less efficient at turning O2− into H2O2 than ScMnSOD when O2− levels are high, although the two enzymes share great sequence similarity and are both located in mitochondria. Mitochondria are recognized as the source of O2− with the production occurring through respiratory chain. H2O2 is generated in mitochondrial matrix via the dismutation reaction of O2− catalyzed by MnSOD. The produced H2O2 then diffused into cytosol. The roles of H2O2 are complex in higher organisms. In mammalian cells the upregulated expression of antioxidant enzymes is not a universal response to supraphysiologic levels of H2O2.7 Instead, physiologic levels of H2O2 stimulate cell division, transformation, migration or apoptosis.7,8,10,11 This along with the fact that mammalian cells generate H2O2 in response to various stimuli supports that H2O2 is utilized as a signaling agent in numerous mammalian signaling pathways.7-11,52,53 A well established H2O2-induced signaling is the modulation of the tyrosine phosphorylation of proteins by causing the oxidative inhibition of tyrosine phosphatases.9 Reversible inactivation of tyrosine phosphatases has been demonstrated to play a critical role in PTP and insulin signaling.54,55 Several mitochondrial signaling pathways are stimulated by increased H2O2, including tumor necrosis factor (TNF)-α-induced apoptosis56 and c-Jun NH2-terminal kinase (JNK)-induced apoptosis.52,57 The participation of H2O2 in signaling cascades may require tight regulation of its production in mitochondria.
A recent study demonstrates the production of large bursts of O2−, termed “superoxide flashes”, in human mitochondria.58 The events of superoxide flashes occur randomly in space and time, last for 20–30 seconds and are confined to tiny elliptical areas.58 Under the conditions that were tested human MnSOD in mitochondrial matrix was expected to eliminate superoxide flashes in a shorter time scale, considering that the reactivity of human MnSOD was thought to be diffusion controlled (k = 2.3 × 10⁹ M−1 s−1) and its intramitochondrial concentration is 10–40 μM.52,59 The observation of superoxide flashes indicates that human MnSOD is unable to maintain a steady-state concentration of O2− in tiny elliptical areas in mitochondria. The most likely explanation for this phenomenon is that human MnSOD is significantly inhibited at these high concentrations of O2−. Under these conditions, bursts of O2− are not translated into bursts of H2O2 that could result in aberrant oxidant-driven signaling in mitochondria.
Mitochondria are the main source of H2O2 and its decomposition in the mitochondrial matrix is catalyzed by glutathione peroxidase and catalase. The rate constants of mammalian glutathione peroxidase and catalase are 5 × 10⁷ M−1 s−1 and 4.6 × 10⁷ M−1 s−1, respectively, and their intramitochondrial concentration is ~10% that of MnSOD.59 These antioxidants maintain a steady-state intramitochonrial H2O2 concentration of ~0.5 × 10⁻⁸ M.59 As no comparison of H2O2 concentration in areas with or without superoxide flashes has been reported, it is unclear whether superoxide flashes cause “H2O2 flashes ” in tiny confined areas in mitochondria.
In contrast, neither superoxide flashes nor evidence of H2O2 signaling in yeast have been reported. The different levels of product inhibition found in human and ScMnSOD may well be explained by the necessity for constrained generation of H2O2 in human mitochondria, especially under the conditions associated with “superoxide flashes”.
Binding of a Sixth Ligand and the Proposed Mechanism of Yeast MnSODs
Native ScMn3+SOD and CaMn3+SODc display optical absorption spectra that are different from other Mn3+SODs. When the yeast enzymes were chemically oxidized, the spectra changed over time from characteristic 5-coordinate Mn3+ spectra to spectra with additional absorption intensity around 390 nm. The growth of this absorption intensity can be ascribed to the binding of a sixth ligand, L, leading to formation of an L-Mn3+SOD complex, and since its formation is favored at high pH the sixth ligand is highly likely to be a hydroxide. EPR spectra suggest the presence of at least two Mn3+-containing species with distinct electronic ground states in yeast Mn3+SODs. One of them is the well-characterized 5-coordinate Mn3+SOD, and the other could be an L-Mn3+SOD species with the sixth ligand bound in the equatorial plane.
A 6-coordinate MnSOD that binds two H2O/OH− has been obtained in the past at cryogenic conditions or at high pH. The structure of cyro-trapped EcMnSOD crystallized at pH 8.5 shows a H2O/OH− bound to the equatorial plane of Mn, giving an octahedral coordination center.60 Probing the Mn2+ center of EcMnSOD using high-field EPR indicates transfer of a water molecule to the Mn center at 240–268 K.61 EcMn3+SOD at pH 11.65 forms a putative 6-coordinate species, giving a heterogeneous EPR spectrum that is comparable to those reported here for ScMn3+SOD and CaMn3+SODc at pH 7.65.31 Recently Porta et. al. have reported a 6-coordinate structure of EcMnSOD with peroxide bound as a side-on ligand to active site manganese.62 However, the existence of a 6-coordinate MnSOD binding two H2O/OH− that is stable in solution at room temperature and neutral pH is novel.
Examination of the second coordination sphere of ScMnSOD shows two outer-sphere solvent molecules within 6 Å of the Mn center, in addition to the Mn-coordinated water. As discussed by Tabares et. al.,61 the sixth ligand is most likely the water that is hydrogen bonded to Tyr34 and His30 (Figure 8). Tyr34 and His30 are highly conserved residues that are part of the proposed hydrogen-bonding network, which pumps protons from protein surface to active site.1,40,45,46 They are also involved in the gating between fast and slow protonation pathways as well as the dissociation of H2O2 from the active site.24,48 This water, however, only occupies 50% of the subunits in the structure of ScMnSOD or EcMnSOD and cannot be seen in the structure of human MnSOD or CaMnSODc.
The binding site of O2− in the MnSOD active site has been investigated using small anions like fluoride and azide as O2− analogues. Azide binds to the sixth ligand site in proximity of Try34 in the plane of His26, His81 and Asp168 at low temperatures.26 Fluoride also sits close to the same binding site and is likely hydrogen bonded to Tyr34.63 Therefore, to react with the Mn ion O2− is highly likely bound in the sixth ligand site in the vicinity to Tyr34. O2− has also been proposed to form hydrogen bonds with Tyr34 and the Mn-coordinated H2O but does not directly bind Mn.63 In both cases, the outer-sphere water, which has been proposed to become the sixth ligand, is located in the vicinity to the O2− binding site.
Herein we propose a mechanism based on the tendency of yeast Mn3+SODs to bind two solvent molecules, which may explain their high efficiency at high O2− doses (Scheme 3). When O2− binds to (or merely approaches) the sixth ligand binding site close to Tyr34, Mn2+ transfers an electron to O2− (which becomes peroxide) and is oxidized to Mn3+. Since Mn3+SOD tends to bind two solvent molecules, the water molecule that is hydrogen bonded to Tyr34 and His30 may travel to the Mn3+ center to compete with the peroxide for the sixth ligand site (Scheme 3). This could cause steric effects at the metal binding site, which may destabilize the inner-sphere peroxo-Mn3+SOD complex. This is consistent with the fact that ScMnSOD and CaMnSODc are significantly gated toward the outer-sphere fast protonation pathway, in which formation of the peroxo-Mn3+SOD species is disfavored. The outer-sphere water may not necessarily bind Mn3+ ion, which could be a slow process, but merely fluctuate between the Mn center and Tyr34/His30 to create steric effects at the active site. Deviations in the positioning of outer-sphere solvent molecules have been reported to be important in enhancing proton transfer in other metalloenzymes.64 In human carbonic anhydrase II (HACII), the positioning and structuring of water molecules in the active site cavity vary with the conformation of an outer-sphere residue, His64.64
Scheme 3.

Proposed Mechanism of the Reaction of Yeast Mn2+SOD with O2−
The putative translocation of the outer-sphere solvent molecule in yeast MnSODs may also facilitate dissociation of the bound peroxide by enhancing proton transfer. Numerous previous studies show that MnSODs from various organisms exhibit a similar hydrogen isotope effect of ~2, suggesting that proton transfer is involved.65 Dissociation of H2O2 from MnSOD active site requires two protons transferred from the protein. Rapid proton transfer from the axial solvent ligand to peroxide is expected to occur in all MnSOD. In yeast MnSODs the other proton is likely donated by the outer-sphere H2O that sits between Tyr34 and His30 upon translocation, which may highly enhance the proton transfer and facilitate the removal of the peroxide from the active site.
Indeed, the rate of peroxide release from active site (k4) in ScMnSOD is dramatically depressed at increased pH with a pK of ~8, which causes the level of product inhibition to increase (Figure 4). This is significantly different from human MnSOD, which maintain a constant k4 over a wide range of pH (6–10).65 The depression of k4, which is likely caused by slower proton transfer, could either be resulted from deprotonation of the axial H2O or the outer-sphere H2O that is hydrogen bonded to Tyr34 and His30, or from deprotonation of Tyr34 as proposed to be responsible for the spectroscopic pK of EcMnSOD.30303030 In the latter scenario, deprotonation of Tyr34 may destabilize the potential sixth ligand by eliminating its hydrogen bonding with Tyr34. Considering that the pK of k4 for ScMnSOD is as low as 8 (Figure 4) while the pK of Tyr34 is 11.5, deprotonation of the solvent ligands is more likely. This may support the hypothesis that the outer-sphere solvent molecule approaches the sixth ligand site of the Mn3+ ion and transfers a proton to the peroxide to facilitate its leaving.
However, the binding of two H2O/OH− in ScMn3+SOD and CaMn3+SODc may not be relevant to their fast catalytic kinetics and low level of product inhibition, but merely a coincidence. We will therefore continue investigating the correlation between product inhibition and the L-Mn3+SOD species by investigating yeast MnSOD mutants with mutations at certain second coordination sphere residues.
In conclusion, MnSODs from S. cerevisiae mitochondria and C. albicans cytosol both exhibit higher efficiencies of O2− dismutation at high [O2−] than human and bacterial MnSODs. The unusual resting state of yeast MnSODs could be attributed to the slightly longer distance between Gln154 and Mn. Both yeast Mn3+SODs form a 6-coordinate species. The potential sixth ligand could be an outer-sphere water and its translocation to Mn ion in the catalytic cycle may facilitate the reaction of Mn2+SOD with O2− to undergo through the non-inhibited pathway. Among MnSODs that have been characterized to date, human MnSOD is the only enzyme that significantly undergoes the product-inhibited pathway at high [O2−], which can be ascribed to complicated roles of H2O2 in mammalian cells, especially as a signaling agent.
Supplementary Material
ACKNOWLEDGMENT
This work was supported by Grant DK46828, KOSEF/MEST through WCU project (R31-2008-000-10010-0) to J.S.V. and National Institutes of Health and Grant GM48242 to R.D.B. Radiolysis studies were carried out at the Center for Radiation Chemistry Research at BNL, which is funded under Contract DE-AC02-98CH10886 with the U.S. Department of Energy and supported by its Division of Chemical Sciences, Geosciences, and Biosciences, Office of Basic Energy Sciences. We acknowledge Minglei Zhao (Department of Chemistry and Biochemistry, UCLA) in assisting us in the X-ray structural determination. We acknowledge Professor Michael Hill (Occidental College) in assisting us in the redox potential measurements.
Footnotes
We have chosen for the sake of convenience to distinguish between cytosolic and mitochondrial MnSODs by adding a “c” to the MnSOD to indicate that it is a cytosolic enzyme. This distinction becomes important in those organisms (C. albicans) where MnSOD is found in both locations. This distinction is not relevant to human and S. cerevisiae as all of the MnSOD is mitochondrial.
ASSOCIATED CONTENT
Supporting Information. Crystallization conditions, pulse radiolysis, optical and EPR spectra, crystallography information and active site bond distances. This material is available free of charge via the Internet at http://pubs.acs.org.
References
- (1).Abreu IA, Cabelli DE. Biochim Biophys Acta. 2010;1804:263. doi: 10.1016/j.bbapap.2009.11.005. [DOI] [PubMed] [Google Scholar]
- (2).Zheng J, Domsic JF, Cabelli D, McKenna R, Silverman DN. Biochemistry. 2007;46:14830. doi: 10.1021/bi7014103. [DOI] [PubMed] [Google Scholar]
- (3).Abreu IA, Hearn A, An H, Nick HS, Silverman DN, Cabelli DE. Biochemistry. 2008;47:2350. doi: 10.1021/bi7016206. [DOI] [PubMed] [Google Scholar]
- (4).Barnese K, Sheng Y, Stich TA, Gralla EB, Britt RD, Cabelli DE, Valentine JS. J Am Chem Soc. 2010;132:12525. doi: 10.1021/ja104179r. [DOI] [PMC free article] [PubMed] [Google Scholar]
- (5).Valko M, Rhodes CJ, Moncol J, Izakovic M, Mazur M. Chem Biol Interact. 2006;160:1. doi: 10.1016/j.cbi.2005.12.009. [DOI] [PubMed] [Google Scholar]
- (6).Giorgio M, Trinei M, Migliaccio E, Pelicci PG. Nat Rev Mol Cell Biol. 2007;8:722. doi: 10.1038/nrm2240. [DOI] [PubMed] [Google Scholar]
- (7).Veal EA, Day AM, Morgan BA. Mol Cell. 2007;26:1. doi: 10.1016/j.molcel.2007.03.016. [DOI] [PubMed] [Google Scholar]
- (8).Stone JR, Yang S. Antioxid Redox Signal. 2006;8:243. doi: 10.1089/ars.2006.8.243. [DOI] [PubMed] [Google Scholar]
- (9).Rhee SG. Science. 2006;312:1882. doi: 10.1126/science.1130481. [DOI] [PubMed] [Google Scholar]
- (10).Finkel T, Holbrook NJ. Nature. 2000;408:239. doi: 10.1038/35041687. [DOI] [PubMed] [Google Scholar]
- (11).Finkel T. Curr Opin Cell Biol. 2003;15:247. doi: 10.1016/s0955-0674(03)00002-4. [DOI] [PubMed] [Google Scholar]
- (12).Jackson TA, Brunold TC. Acc Chem Res. 2004;37:461. doi: 10.1021/ar030272h. [DOI] [PubMed] [Google Scholar]
- (13).Lamarre C, LeMay JD, Deslauriers N, Bourbonnais Y. J Biol Chem. 2001;276:43784. doi: 10.1074/jbc.M108095200. [DOI] [PubMed] [Google Scholar]
- (14).Schwarz H. BNL Pulse Radiolysis Program. Brookhaven National Laboratory; [Google Scholar]
- (15).Stoll S, Britt RD. Phys Chem Chem Phys. 2009;11:6614. doi: 10.1039/b907277b. [DOI] [PubMed] [Google Scholar]
- (16).Stoll S, Schweiger A. J Magn Reson. 2006;178:42. doi: 10.1016/j.jmr.2005.08.013. [DOI] [PubMed] [Google Scholar]
- (17).Walter TS, Meier C, Assenberg R, Au KF, Ren JS, Verma A, Nettleship JE, Owens RJ, Stuart DI, Grimes JM. Structure. 2006;14:1617. doi: 10.1016/j.str.2006.09.005. [DOI] [PMC free article] [PubMed] [Google Scholar]
- (18).Sutherland MW, Learmonth BA. Free Radic Res. 1997;27:283. doi: 10.3109/10715769709065766. [DOI] [PubMed] [Google Scholar]
- (19).Otwinowski Z, Minor W. Method Enzymol. 1997;276:307. doi: 10.1016/S0076-6879(97)76066-X. [DOI] [PubMed] [Google Scholar]
- (20).Mccoy AJ, Grosse-Kunstleve RW, Adams PD, Winn MD, Storoni LC, Read RJ. J Appl Crystallogr. 2007;40:658. doi: 10.1107/S0021889807021206. [DOI] [PMC free article] [PubMed] [Google Scholar]
- (21).Emsley P, Cowtan K. Acta Crystallogr D. 2004;60:2126. doi: 10.1107/S0907444904019158. [DOI] [PubMed] [Google Scholar]
- (22).Murshudov GN, Vagin AA, Dodson EJ. Acta Crystallogr D. 1997;53:240. doi: 10.1107/S0907444996012255. [DOI] [PubMed] [Google Scholar]
- (23).Adams PD, Grosse-Kunstleve RW, Hung LW, Ioerger TR, McCoy AJ, Moriarty NW, Read RJ, Sacchettini JC, Sauter NK, Terwilliger TC. Acta Crystallogr D Biol Crystallogr. 2002;58:1948. doi: 10.1107/s0907444902016657. [DOI] [PubMed] [Google Scholar]
- (24).Perry JJ, Hearn AS, Cabelli DE, Nick HS, Tainer JA, Silverman DN. Biochemistry. 2009;48:3417. doi: 10.1021/bi8023288. [DOI] [PMC free article] [PubMed] [Google Scholar]
- (25).Ravindranath SD, Fridovich I. J Biol Chem. 1975;250:6107. [PubMed] [Google Scholar]
- (26).Whittaker MM, Whittaker JW. Biochemistry. 1996;35:6762. doi: 10.1021/bi960088m. [DOI] [PubMed] [Google Scholar]
- (27).Vance CK, Miller AF. Biochemistry. 2001;40:13079. doi: 10.1021/bi0113317. [DOI] [PubMed] [Google Scholar]
- (28).Leveque VJ, Vance CK, Nick HS, Silverman DN. Biochemistry. 2001;40:10586. doi: 10.1021/bi010792p. [DOI] [PubMed] [Google Scholar]
- (29).Whittaker JW, Whittaker MM. J Am Chem Soc. 1991;113:5528. [Google Scholar]
- (30).Maliekal J, Karapetian A, Vance C, Yikilmaz E, Wu Q, Jackson T, Brunold TC, Spiro TG, Miller AF. J Am Chem Soc. 2002;124:15064. doi: 10.1021/ja027319z. [DOI] [PubMed] [Google Scholar]
- (31).Campbell KA. Dissertation Thesis. University of California-Davis; 1999. [Google Scholar]
- (32).Jackson TA, Karapetian A, Miller AF, Brunold TC. Biochemistry. 2005;44:1504. doi: 10.1021/bi048639t. [DOI] [PubMed] [Google Scholar]
- (33).Campbell KA, Force DA, Nixon PJ, Dole F, Diner BA, Britt RD. J Am Chem Soc. 2000;122:3754. [Google Scholar]
- (34).Edwards RA, Baker HM, Whittaker MM, Whittaker JW, Jameson GB, Baker EN. J Biol Inorg Chem. 1998;3:161. [Google Scholar]
- (35).Krivokapic I, Noble C, Klitgaard S, Tregenna-Piggott P, Weihe H, Barra AL. Angew Chem Int Ed Engl. 2005;44:3613. doi: 10.1002/anie.200463084. [DOI] [PubMed] [Google Scholar]
- (36).Campbell KA, Lashley MR, Wyatt JK, Nantz MH, Britt RD. J Am Chem Soc. 2001;123:5710. doi: 10.1021/ja0027463. [DOI] [PubMed] [Google Scholar]
- (37).Borgstahl GE, Parge HE, Hickey MJ, Beyer WF, Jr., Hallewell RA, Tainer JA. Cell. 1992;71:107. doi: 10.1016/0092-8674(92)90270-m. [DOI] [PubMed] [Google Scholar]
- (38).Fluckiger S, Mittl PR, Scapozza L, Fijten H, Folkers G, Grutter MG, Blaser K, Crameri R. J Immunol. 2002;168:1267. doi: 10.4049/jimmunol.168.3.1267. [DOI] [PubMed] [Google Scholar]
- (39).Trinh CH, Hunter T, Stewart EE, Phillips SE, Hunter GJ. Acta Crystallogr Sect F Struct Biol Cryst Commun. 2008;64:1110. doi: 10.1107/S1744309108037056. [DOI] [PMC free article] [PubMed] [Google Scholar]
- (40).Perry JJ, Shin DS, Getzoff ED, Tainer JA. Biochim Biophys Acta. 2010;1804:245. doi: 10.1016/j.bbapap.2009.11.004. [DOI] [PMC free article] [PubMed] [Google Scholar]
- (41).Jackson TA, Xie J, Yikilmaz E, Miller AF, Brunold TC. J Am Chem Soc. 2002;124:10833. doi: 10.1021/ja0266058. [DOI] [PubMed] [Google Scholar]
- (42).Carugo O, Djinovic Carugo K. Trends Biochem Sci. 2005;30:213. doi: 10.1016/j.tibs.2005.02.009. [DOI] [PubMed] [Google Scholar]
- (43).Hsieh YS, Guan Y, Tu CK, Bratt PJ, Angerhofer A, Lepock JR, Hickey MJ, Tainer JA, Nick HS, Silverman DN. Biochemistry. 1998;37:4731. doi: 10.1021/bi972395d. [DOI] [PubMed] [Google Scholar]
- (44).Leveque VJ, Stroupe ME, Lepock JR, Cabelli DE, Tainer JA, Nick HS, Silverman DN. Biochemistry. 2000;39:7131. doi: 10.1021/bi9929958. [DOI] [PubMed] [Google Scholar]
- (45).Whittaker MM, Whittaker JW. Biochemistry. 1997;36:8923. doi: 10.1021/bi9704212. [DOI] [PubMed] [Google Scholar]
- (46).Edwards RA, Whittaker MM, Whittaker JW, Baker EN, Jameson GB. Biochemistry. 2001;40:15. doi: 10.1021/bi002403h. [DOI] [PubMed] [Google Scholar]
- (47).Guan Y, Hickey MJ, Borgstahl GE, Hallewell RA, Lepock JR, O’Connor D, Hsieh Y, Nick HS, Silverman DN, Tainer JA. Biochemistry. 1998;37:4722. doi: 10.1021/bi972394l. [DOI] [PubMed] [Google Scholar]
- (48).Davis CA, Hearn AS, Fletcher B, Bickford J, Garcia JE, Leveque V, Melendez JA, Silverman DN, Zucali J, Agarwal A, Nick HS. J Biol Chem. 2004;279:12769. doi: 10.1074/jbc.M310623200. [DOI] [PubMed] [Google Scholar]
- (49).Yikilmaz E, Porta J, Grove LE, Vahedi-Faridi A, Bronshteyn Y, Brunold TC, Borgstahl GEO, Miller AF. J Am Chem Soc. 2007;129:9927. doi: 10.1021/ja069224t. [DOI] [PubMed] [Google Scholar]
- (50).Yikilmaz E, Xie J, Brunold TC, Miller AF. J Am Chem Soc. 2002;124:3482. doi: 10.1021/ja011220v. [DOI] [PubMed] [Google Scholar]
- (51).Miller AF, Vance CK. Biochemistry. 2001;40:13079. doi: 10.1021/bi0113317. [DOI] [PubMed] [Google Scholar]
- (52).Cadenas E. Mol Aspects Med. 2004;25:17. doi: 10.1016/j.mam.2004.02.005. [DOI] [PubMed] [Google Scholar]
- (53).Droge W. Physiol Rev. 2002;82:47. doi: 10.1152/physrev.00018.2001. [DOI] [PubMed] [Google Scholar]
- (54).Mahadev K, Wu X, Zilbering A, Zhu L, Lawrence JT, Goldstein BJ. J Biol Chem. 2001;276:48662. doi: 10.1074/jbc.M105061200. [DOI] [PubMed] [Google Scholar]
- (55).Tonks NK. Cell. 2005;121:667. doi: 10.1016/j.cell.2005.05.016. [DOI] [PubMed] [Google Scholar]
- (56).Melendez JA, Dasgupta J, Subbaram S, Connor KM, Rodriguez AM, Tirosh O, Beckman JS, JourD’Heuil D. Antioxid Redox Sign. 2006;8:1295. doi: 10.1089/ars.2006.8.1295. [DOI] [PubMed] [Google Scholar]
- (57).Chen K, Thomas SR, Albano A, Murphy MP, Keaney JF., Jr. J Biol Chem. 2004;279:35079. doi: 10.1074/jbc.M404859200. [DOI] [PubMed] [Google Scholar]
- (58).Wang W, et al. Cell. 2008;134:279. doi: 10.1016/j.cell.2008.06.017. [DOI] [PMC free article] [PubMed] [Google Scholar]
- (59).Cadenas E, Davies KJ. Free Radic Biol Med. 2000;29:222. doi: 10.1016/s0891-5849(00)00317-8. [DOI] [PubMed] [Google Scholar]
- (60).Borgstahl GEO, Pokross M, Chehab R, Sekher A, Snell EH. Journal of Molecular Biology. 2000;296:951. doi: 10.1006/jmbi.1999.3506. [DOI] [PubMed] [Google Scholar]
- (61).Tabares LC, Cortez N, Agalidis I, Un S. J Am Chem Soc. 2005;127:6039. doi: 10.1021/ja047007r. [DOI] [PubMed] [Google Scholar]
- (62).Porta J, Vahedi-Faridi A, Borgstahl GE. J Mol Biol. 2010;399:377. doi: 10.1016/j.jmb.2010.04.031. [DOI] [PubMed] [Google Scholar]
- (63).Tabares LC, Cortez N, Hiraoka BY, Yamakura F, Un S. Biochemistry. 2006;45:1919. doi: 10.1021/bi051947m. [DOI] [PubMed] [Google Scholar]
- (64).Merz KM, Toba S, Colombo G. J Am Chem Soc. 1999;121:2290. [Google Scholar]
- (65).Hearn AS, Stroupe ME, Cabelli DE, Lepock JR, Tainer JA, Nick HS, Silverman DN. Biochemistry. 2001;40:12051. doi: 10.1021/bi011047f. [DOI] [PubMed] [Google Scholar]
Associated Data
This section collects any data citations, data availability statements, or supplementary materials included in this article.