

Abstract
The drug efflux pump P-glycoprotein (P-gp) plays an important role in the function of the blood–brain barrier by selectively extruding certain endogenous and exogenous molecules, thus limiting the ability of its substrates to reach the brain. Emerging evidence suggests that P-gp may restrict the uptake of several antidepressants into the brain, thus contributing to the poor success rate of current antidepressant therapies. Despite some inconsistency in the literature, clinical investigations of potential associations between functional single nucleotide polymorphisms in ABCB1, the gene which encodes P-gp, and antidepressant response have highlighted a potential link between P-gp function and treatment-resistant depression (TRD). Therefore, co-administration of P-gp inhibitors with antidepressants to patients who are refractory to antidepressant therapy may represent a novel therapeutic approach in the management of TRD. Furthermore, certain antidepressants inhibit P-gp in vitro, and it has been hypothesized that inhibition of P-gp by such antidepressant drugs may play a role in their therapeutic action. The present review summarizes the available in vitro, in vivo and clinical data pertaining to interactions between antidepressant drugs and P-gp, and discusses the potential relevance of these interactions in the treatment of depression.
Keywords: antidepressant, P-glycoprotein, blood–brain barrier, ABCB1, MDR1, treatment-resistant depression, ABC drug efflux transporter
Introduction: the blood–brain barrier: a major obstacle in the delivery of drugs to the brain
Drug delivery to the CNS is one of the major hurdles in the development of novel therapeutics for neuropsychiatric disorders. In particular, transport across the blood–brain barrier (BBB), which separates the circulating blood from the CNS, needs to be achieved for centrally acting drugs to reach therapeutic concentrations at their site of action. The BBB plays a key role in maintaining homeostasis within the CNS, preserving the composition of the internal milieu despite variations in the periphery and protecting the brain against toxins, bacteria and viruses. Moreover, it regulates the uptake of endogenous molecules and xenobiotics into the brain (Pardridge, 2007; Neuwelt et al., 2008; 2011; Pariante, 2008; Zlokovic, 2008; Abbott et al., 2010). Importantly, over 98% of potential CNS drugs are unable to cross the BBB to reach target sites within the brain (Pardridge, 2005; Neuwelt et al., 2008).
Brain capillary endothelial cells (BCECs) line the blood capillaries in the brain and form the fundamental building block of the BBB (Figure 1). Interactions between BCECs and other components of the neurovascular unit (Hawkins and Davis, 2005), including perivascular elements such as astrocytes, pericytes and neurons, induce the BBB-specific properties of the BCECs (Janzer and Raff, 1987; Hayashi et al., 1997; Armulik et al., 2010). In addition, the dynamic permeability of the BBB varies in response to intra- and intercellular signalling among these cells (Neuwelt et al., 2011). Tight junctions form between BCECs, resulting in a continuous cellular barrier that prevents the passive diffusion of substances into the brain from the blood via the paracellular route of transport (Reese and Karnovsky, 1967; Brightman and Reese, 1969). Furthermore, a lack of fenestrations and low levels of transcytosis at the BBB restrict transcellular transport (Hawkins and Davis, 2005). Therefore, in general, physicochemical properties such as lipophilicity, molecular weight and charge determine the ability of a compound to cross the BBB, with only low molecular weight, lipophilic molecules able to penetrate the physical barrier presented by the BCECs.
Figure 1.
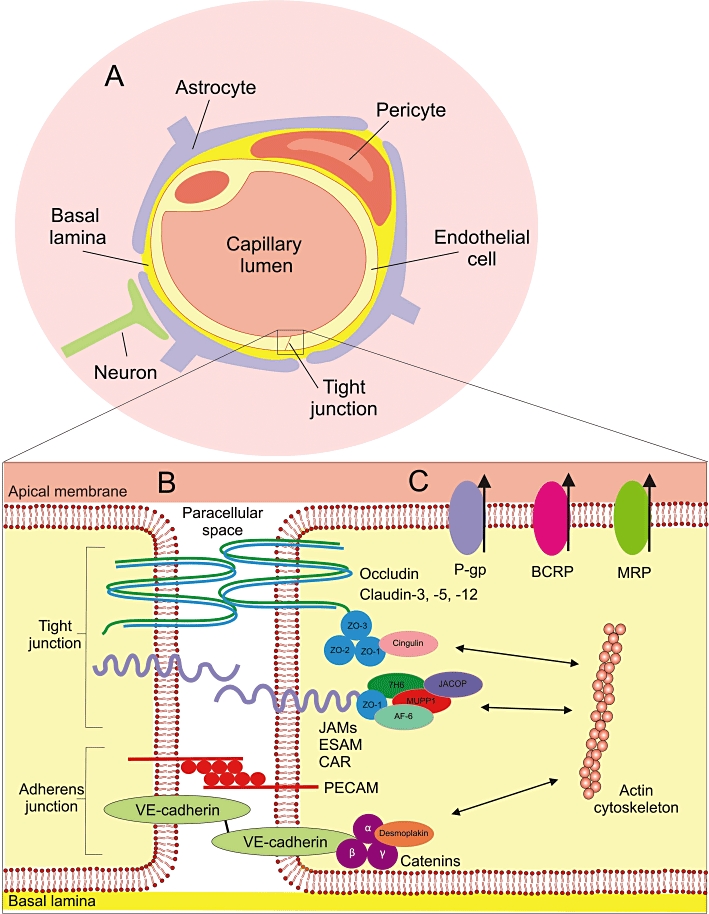
The blood–brain barrier. (A) The neurovascular unit: The BBB consists of endothelial cells in the cerebral capillaries which, together with closely associated perivascular elements, such as pericytes, astrocyte endfoot processes and neurons, form the neurovascular unit. These perivascular elements interact with the endothelial cells to induce endothelial cell differentiation, resulting in the formation of tight junctions between endothelial cells and the expression of BBB-specific proteins, such as drug efflux pumps. (B) Simplified representation of a tight junction: One of the key characteristics of the BBB is the formation of tight junctions between endothelial cells. Tight junctions consist of a highly complex network of transmembrane proteins and intracellular linking proteins, as well as signalling and regulatory proteins. Transmembrane proteins link the endothelial cells together through interactions in the paracellular space, and include occludin, claudin-3, -5 and -12 and three members of the immunoglobulin superfamily; junctional adhesion molecules (JAMs), endothelial selective adhesion molecules (ESAMs) and the coxsackie and adenovirus receptor (CAR). Transmembrane proteins effectively seal the paracellular space, thus blocking the paracellular transport route which is important for polar molecules. They are linked to the actin cytoskeleton within the cell via first- and second-order cytoplasmic accessory scaffold molecules. Important first-order adaptor components, which bind directly to the transmembrane proteins, include the zona occludens proteins (ZO 1–3), while cingulin and junction associated coiled-coil protein (JACOP) are examples of second-order adaptor proteins. Signalling and regulatory molecules may include multi-PDZ-protein 1 (MUPP1), afadin (AF6) and 7H6. The adherens junction lends structural support to the endothelial tissue. It is made up of vascular endothelial cadherin (VE-cadherin), with the scaffolding proteins α-, β- and γ-catenin and desmoplakin, and the platelet-endothelial cell adhesion molecule (PECAM), which mediates homophilic adhesion. (C) Drug efflux pumps: Several drug efflux pumps, such as P-gp, BCRP and MRP, are expressed at the apical membrane of the endothelial cells of the BBB. These pumps play an integral role in the function of the BBB by limiting the ability of their substrates to penetrate the BBB by actively shuttling them out of the cell back into the bloodstream. Illustration adapted from Wolburg and Lippoldt (2002), Ballabh et al. (2004), Begley (2004), Abbott et al. (2006; 2010), Wolburg et al. (2009).
Furthermore, many drug-metabolizing enzymes are localized at the BBB (Ghersi-Egea et al., 1994; Bauer et al., 2008; Dauchy et al., 2008; Dutheil et al., 2009; Eyal et al., 2009). Thus, compounds which are substrates of these enzymes may be broken down at the BBB, thereby providing a metabolic barrier to drug transport into the brain.
In addition, several transporter proteins are expressed at the luminal and/or abluminal membranes of the BCECs. These influx and efflux transporters play a vital role in the regulation of molecule transfer across the BBB (Pardridge, 2007). From a drug delivery perspective, the expression of drug efflux transporters at the BBB can limit brain exposure to substrate drugs (Urquhart and Kim, 2009). Therefore, the brain permeability of certain compounds, which are subject to metabolism and/or drug efflux at the BBB, is much lower than would be predicted based on physicochemical properties alone (Cordoncardo et al., 1989; Begley, 2004; Hermann and Bassetti, 2007).
Efflux transporters from the ATP-binding cassette (ABC) superfamily, in particular, exert significant functional transport at the BBB. ABC transporters are primary active transporters, which use ATP hydrolysis to power the active efflux of their substrates against concentration gradients. Forty-nine members of the ABC superfamily have been described in humans, and these are divided into seven major subfamilies: ABCA to ABCG (Sharom, 2008). ABC transporters are expressed at various sites within the body, including the kidney, liver, intestine and adrenal gland. Importantly, several members of the ABC superfamily are localized at the luminal membrane of human BCECs, namely P-glycoprotein [P-gp; encoded by the multidrug resistance 1 (MDR1/ABCB1) gene], breast cancer resistance protein (BCRP; encoded by ABCG2) and multidrug resistance-associated proteins 4 and 5 (MRP4 and 5; encoded by ABCC4 and 5 respectively) (Begley, 2004; Nies, 2007). Interestingly, there is significant overlap in substrate specificity between P-gp, BCRP and MRPs, and many commonly used drugs are included among their substrates (Sharom, 2008; Zhou, 2008).
Furthermore, ABC transporters have been implicated in resistance to pharmacotherapy, most notably in oncology, where the expression of these efflux pumps by cancer cells may confer resistance to chemotherapy with cytotoxic drugs in cancer patients (Gottesman et al., 2002; Szakacs et al., 2006). In addition, there is increasing evidence that ABC transporter-mediated drug efflux at the BBB may limit brain drug delivery of several CNS drugs (Loscher and Potschka, 2005), thereby leading to treatment failure in various brain disorders, including brain cancer (Pauwels et al., 2007), epilepsy (Siddiqui et al., 2003) and stroke (Spudich et al., 2006). In the field of psychiatry, much recent attention had been given to the role of efflux pumps in the pharmacokinetic profile of antidepressant drugs. Emerging evidence suggests that P-gp, in particular, may limit the ability of several antidepressants to cross the BBB, thus resulting in inadequate brain concentrations and therefore contributing to the poor success rate of current antidepressant therapies (Uhr et al., 2008).
Structure and function of P-glycoprotein
P-glycoprotein was first identified in the 1970s, when it was found to confer resistance to cancer cells against chemotherapeutic agents in vitro (Juliano and Ling, 1976), and was subsequently found to be localized in blood capillaries in the brain (Cordoncardo et al., 1989; Thiebaut et al., 1989). P-gp is a 170 kDa membrane-bound broad-spectrum efflux pump. It consists of 12 highly hydrophobic transmembrane domains, arranged as two bundles of six helices linked by a highly charged extracellular ‘linker region’, and two intracellular ATP-binding sites, known as nucleotide-binding domains (NBDs) (Zhou, 2008; Aller et al., 2009).
The hydrophobic ‘vacuum cleaner’ and flippase models have been proposed to describe P-gp-mediated drug translocation (Shapiro and Ling, 1997; Aller et al., 2009; Colabufo et al., 2010). In the hydrophobic ‘vacuum cleaner’ model, P-gp pulls its substrates from the lipid bilayer and pumps them out of the cell through the central cavity. According to the flippase model, P-gp ‘scans’ the inner leaflet of the lipid bilayer and binds specific lipids and hydrophobic drugs prior to their extrusion by ‘flipping’ the phospholipids from the inner to outer leaflets of the lipid bilayer. The flippase model and the hydrophobic ‘vacuum cleaner’ model are not mutually exclusive, and a combination of both models is illustrated in Figure 2 (Aller et al., 2009; Eckford and Sharom, 2009). The active drug efflux process is powered by ATP hydrolysis at the cytoplasmic NBDs (Sharom, 2008).
Figure 2.

Model of P-gp substrate transport. (A) In its substrate-binding conformation, consisting of two inward facing bundles of six transmembrane helices, P-gp contains a large internal cavity open to both the cytoplasm and the inner leaflet of the lipid bilayer. This large cavity (∼6000 Å3), or substrate-binding pocket (SBP), comprises mostly hydrophobic and aromatic residues. Lipid-soluble P-gp substrate molecules partition into the inner leaflet of the phospholipid (PL) bilayer membrane. From the inner leaflet, the molecule travels through one of two portals, formed by helices 4/6 and 10/12, to enter the P-gp SBP. Substrate–P-gp interactions lead to the binding of two ATP molecules to the NBD. (B) The binding of ATP to the NBDs causes dimerization of the NBDs. This leads to a conformational change, resulting in an outward facing configuration. This outward facing arrangement facilitates the release of substrates into the extracellular environment or the outer leaflet of the PL bilayer, and sterically prevents the substrate from travelling into the intracellular space. Thus, P-gp acts as a unidirectional efflux pump (see Aller et al., 2009). Above broken line = outer leaflet of PL bilayer. Below broken line = inner (cytoplasmic) leaflet of PL bilayer.
One of the hallmarks of P-gp is its substrate promiscuity, as it binds a wide range of structurally unrelated compounds (Table 1) (Aller et al., 2009). Although P-gp substrates are generally hydrophobic amphipathic compounds, no chemical characteristic that clearly distinguishes between P-gp substrates and non-substrates has been determined (Schinkel, 1999). Interestingly, there is a significant overlap in substrate specificity between P-gp and drug-metabolizing enzymes, such as cytochrome P450 (CYP) enzymes CYP2D6 (Uhr et al., 2004) and CYP3A (Wacher et al., 1995). Thus, P-gp and drug-metabolizing enzymes in BCECs may work in tandem to reduce the ability of certain drug molecules, which are substrates of both P-gp and the drug-metabolizing enzymes, to pass through the BBB in a so-called ‘drug transporter-metabolism alliance’ (as originally proposed in relation to drug absorption from the gut) (Benet, 2009). According to this hypothesis, P-gp efflux would prevent the intact substrate from passing through the BBB, resulting in a cycle where drug molecules passively diffuse into the BCEC, followed by active P-gp-mediated extrusion. Each time drug molecules diffuse into the BCEC in this cycle, a certain proportion of the molecules would be broken down by the drug-metabolizing enzymes, while unchanged molecules would be recycled back out of the cell by P-gp.
Table 1.
List of selected P-glycoprotein (P-gp) substrates and inhibitors
| Drug class | Selected examples |
|---|---|
| P-gp substrates | |
| Anticancer agents | Daunorubicin, doxorubicin, etoposide, imatinib, methotrexate, mitoxantrone, paclitaxel, vinblastine, vincristine |
| Antidiarrhoeal agents | Loperamide |
| Antidepressants | Amitriptyline, citalopram, desipramine, doxepine, fluoxetine, fluvoxamine, imipramine, nortriptyline, paroxetine, trimipramine, venlafaxine |
| Antihistamines | Cetirizine, desloratadine, fexofenadine |
| Antipsychotics | Risperidone |
| Antiretroviral drugs | Amprenavir, indinavir, lopinavir, nelfinavir, ritonavir, saquinavir |
| Cardioactive drugs | Amiodarone, digoxin, diltiazem, quinidine, verapamil |
| Antiemetics | Domperidone, ondansetron |
| β-blockers | Talinolol |
| H2 receptor antagonists | Cimetidine, ranitidine |
| P-gp inhibitors | |
| First generation | Amiodarone, cyclosporin, nifedipine, quinidine, verapamil |
| Second generation | Dexverapamil, GF120918 (elacridar), PSC-833 (valspodar), VX-710 (biricodar) |
| Third generation | LY-335979 (zosuquidar), LY475776, OC144-093, R-101933 (laniquidar), XR-9576 (tariquidar) |
Compounds that interact with P-gp can be classified as substrates, modulators or inhibitors (Table 1). Substrates are subjected to active efflux by P-gp, and therefore have a reduced ability to penetrate P-gp-expressing membranes. Modulators reduce substrate binding via a negative allosteric interaction, thereby reducing P-gp-mediated substrate efflux, whereas inhibitors reduce P-gp function by interfering with the substrate or nucleotide-binding steps (Colabufo et al., 2010). Therefore, modulators and inhibitors achieve the same pharmacological effect, albeit via different mechanisms, and for the purposes of this review can be considered synonymous. Some, but not all, P-gp substrates also reduce P-gp function, and as such can be classed as both substrates and inhibitors. Co-administration of P-gp inhibitors with P-gp substrate drugs therefore represents a potential strategy to overcome P-gp-mediated drug resistance. However, clinical trials to date, which have focused exclusively on the use of P-gp inhibitors in combination with cytotoxic drugs in treatment resistant cancer, have not proven to be successful due to pharmacokinetic and pharmacodynamic limitations (Szakacs et al., 2006; Colabufo et al., 2010). The development of more specific and potent modulators of P-gp function at the BBB may lead to a therapeutically useful role for P-gp inhibitors in the future. Alternatively, currently available P-gp inhibitors may also prove to be useful in the augmentation of the treatment of diseases other than cancer.
In vitro investigations of drug interactions with P-gp
Several in vitro screening assays can be used to determine interactions between test compounds and P-gp, and thereby classify drugs as P-gp substrates or inhibitors (Polli et al., 2001). Functional assays used to identify P-gp substrates include ATPase activity and bidirectional transcellular transport assays. The relationship between P-gp activity and the breakdown of ATP is exploited in the ATPase activity assay, whereby the release of inorganic phosphate as a result of ATP hydrolysis following drug incubation with a P-gp-expressing membrane is monitored (Sarkadi et al., 1992). This facilitates high-throughput identification of compounds that interact with P-gp. However, many compounds identified as P-gp ‘substrates’ using this assay may not be subject to significant P-gp transport (Schwab et al., 2003), and this is a major limitation of the ATPase activity assay.
Therefore, bidirectional transcellular transport assays are the gold standard for identifying P-gp substrates in vitro, and represent the most accurate predictive model for the identification of P-gp substrates in vivo (Feng et al., 2008). However, these monolayer efflux assays are labour-intensive and, consequently, time-consuming with a relatively low throughput. Many cell lines suitable for use in bidirectional transcellular transport assays are available, including the naturally P-gp-expressing human colorectal adenocarcinoma (Caco-2) cells and ABCB1-transfected Madine-Darby canine kidney cells (MDCK-MDR1). These model cell lines are polarized, with distinct apical and basolateral membrane domains, when cultured on an appropriate transwell support. As P-gp is exclusively expressed on the apical membrane of the cultured cells, the comparison of apical-to-basolateral (A→B) permeability and basolateral-to-apical (B→A) permeability for a test compound indicates if it is a P-gp substrate. A (B→A)/(A→B) transport ratio (TR) of >2.0 is indicative of P-gp-mediated efflux (Lin, 2007).
The presence of other endogenous efflux transporters, in addition to P-gp, in these cell systems may influence transport. Therefore, it is advisable to use specific and potent P-gp inhibitors, in conjunction with the TR, to determine if P-gp-mediated efflux is the transport mechanism at play, and thus if the test compound is a P-gp substrate. Furthermore, for ABCB1-transfected cell lines, such as MDCK-MDR1, a ‘corrected’ transport ratio (cTR) can be calculated by dividing the TR obtained in the ABCB1-transfected cells by the TR obtained in the respective wild-type cell line (Zhang et al., 2006; Kuteykin-Teplyakov et al., 2010). However, the expression of endogenous drug transporters in these cell lines can be affected by transfection with the human ABCB1 gene (Kuteykin-Teplyakov et al., 2010). This must be taken into consideration when interpreting cTR values. Similarly, known P-gp substrates can be used in the bidirectional transcellular transport assay to determine if a test compound is a P-gp inhibitor. P-gp substrates commonly used for this purpose include digoxin, loperamide and talinolol (Pariante et al., 2003b; El Ela et al., 2004; Zhang et al., 2006). A decrease in the TR for the P-gp substrate following co-incubation with the test compound is indicative of P-gp inhibition by the test compound.
Other assays, which are less laborious and therefore offer higher throughput, can be used for the identification and classification of P-gp inhibitors. These P-gp inhibition assays utilize fluorescent P-gp substrates, such as calcein acetoxymethyl ester or rhodamine 123, can be easily automated and have the considerable advantage of a generic fluorescent output. Increased intracellular accumulation (as measured by increased fluorescence) of the fluorescent P-gp substrate in P-gp-expressing cells following co-incubation with the test compound thus gives an indirect measure of P-gp inhibition (Varga et al., 1996; Ibrahim et al., 2000; Stormer et al., 2001; Weiss et al., 2003; Feng et al., 2008). Similarly, the susceptibility of P-gp-expressing cells to P-gp-substrate cytotoxic drugs, such as doxorubicin or vinblastine, can be determined. Enhanced cytotoxicity in the presence of the test compound is indicative of P-gp inhibition (Merry et al., 1991; Jaffrezou et al., 1995).
In vivo investigations of drug interactions with P-gp
While P-gp is encoded by a single gene in humans (ABCB1), its functions are performed by two homologues in mice: the abcb1a and abcb1b genes (Devault and Gros, 1990). Interestingly, the overall tissue distribution overlaps well between the two species (Ebinger and Uhr, 2006), and there seems to be a high level of correlation in substrate specificities between mouse and human P-gp based on in vitro studies (Feng et al., 2008), despite some concern relating to potential species differences (Yamazaki et al., 2001) Thus, it appears that mouse-based models are useful tools for predicting P-gp drug interactions in humans.
Abcb1a P-gp is highly expressed at the murine BBB, while it appears that abcb1b P-gp is also expressed at the BBB, but to a much lesser extent (Pariante, 2008). Thus, the generation of abcb1-knockout mice, firstly single knockout abcb1a (−/−) mice in 1994 (Schinkel et al., 1994), followed by double knockout abcb1ab (−/−) in 1997 (Schinkel et al., 1997), has facilitated the study of the influence of P-gp on brain pharmacokinetics of various drugs. By comparing brain/plasma ratios between these P-gp-deficient knockout mice to those of wild-type controls, it has been possible to identify drugs as P-gp substrates in vivo. Alternatively, established P-gp inhibitors, such as verapamil and cyclosporin, can be administered to wild-type animals to investigate the influence of P-gp inhibition on drug pharmacokinetics.
Antidepressant drugs and P-gp: is this interaction relevant?
Current antidepressant therapies have an unsatisfactorily high failure rate; it has been estimated that up to 60% of depressed patients suffer from treatment-resistant depression (TRD) (Fava, 2003; Trivedi et al., 2006), with remission rates declining even further following successive treatment failures (Rush et al., 2006). As depression is one of the leading causes of disability in the developed world (Cryan and Leonard, 2010), there is a major impetus to determine why the failure rate of antidepressant therapies remains so high.
Antidepressant drugs are categorized into different classes based on mechanism of action, including selective serotonin reuptake inhibitors (SSRIs), tricyclic antidepressants (TCAs), serotonin–norepinephrine reuptake inhibitors (SNRIs) and tetracyclic antidepressants. Regardless of class, antidepressants need to penetrate the BBB to reach their site of action within the brain; therefore, it has been suggested that drug efflux by P-gp at the BBB may be involved in TRD. Indeed, many antidepressant drugs interact with P-gp in vitro and in vivo, both as substrates and inhibitors. These interactions have been postulated to be of clinical importance, as P-gp efflux would limit the distribution of these drugs into the brain (Loscher and Potschka, 2005). Interestingly, it has also been hypothesized that inhibition of P-gp may, in fact, be involved in the mechanism of action of antidepressant drugs (Pariante et al., 2004).
Antidepressants as P-gp substrates in vitro
As P-gp inhibition assays are generally more cost-effective and less labour-intensive than P-gp substrate studies, the majority of in vitro studies of antidepressant P-gp interactions to date have focused on the identification of P-gp inhibition by antidepressants. However, a small number of studies using bidirectional transcellular transport assays (Rochat et al., 1999; El Ela et al., 2004; Maines et al., 2005), the ATPase assay (Ejsing et al., 2006; Wang et al., 2008) or both (Feng et al., 2008) have been conducted.
Table 2 presents a summary of the available in vitro data on antidepressants as P-gp substrates. Column 2 indicates the conclusions drawn by the studies' authors, and it is important to be aware that the interpretation of results may differ between groups.
Table 2.
In vitro studies to identify antidepressants as P-glycoprotein (P-gp) substrates
| Antidepressant | P-gp substrate/interaction? | Transport ratio | ATPase Km (µM) | Model | Ref. |
|---|---|---|---|---|---|
| Bupropion | N | n/a | 2676 | ATPase assay | Wang et al. (2008) |
| →EB | N | n/a | 109.3 | ATPase assay | Wang et al. (2008) |
| →HB | N | n/a | 318.2 | ATPase assay | Wang et al. (2008) |
| →TB | N | n/a | 2066 | ATPase assay | Wang et al. (2008) |
| Citalopram | N1 | 1.6 | n/a | MDCK-MDR1 | Feng et al. (2008) |
| Citalopram | N2 | 1.2 | n/a | MDCK-mdr1a | Feng et al. (2008) |
| Citalopram | Low | n/a | 441 ± 140.1 | ATPase assay | Feng et al. (2008) |
| Citalopram | N | 1.1 | n/a | BMEC monolayer | Rochat et al. (1999) |
| Fluoxetine | N1 | 0.5 | n/a | MDCK-MDR1 | Feng et al. (2008) |
| Fluoxetine | N2 | 0.6 | n/a | MDCK-mdr1a | Feng et al. (2008) |
| Fluoxetine | Low | n/a | 51.6 ± 11.81 | ATPase assay | Feng et al. (2008) |
| Fluvoxamine | N1 | 0.9 | n/a | MDCK-MDR1 | Feng et al. (2008) |
| Fluvoxamine | N2 | 0.8 | n/a | MDCK-mdr1a | Feng et al. (2008) |
| Fluvoxamine | Low | n/a | 180 ± 35.7 | ATPase assay | Feng et al. (2008) |
| Fluvoxamine | Y | 1.26 | n/a | Caco-2 | El Ela et al. (2004) |
| Nortriptyline | Y | n/a | 257.6 | ATPase assay | Ejsing et al. (2006) |
| Nortriptyline | N1 | 1.1 | n/a | MDCK-MDR1 | Feng et al. (2008) |
| Nortriptyline | N2 | 0.9 | n/a | MDCK-mdr1a | Feng et al. (2008) |
| Nortriptyline | Low | n/a | 56.0 ± 15.73 | ATPase assay | Feng et al. (2008) |
| Paroxetine | N1 | 1 | n/a | MDCK-MDR1 | Feng et al. (2008) |
| Paroxetine | N2 | 1 | n/a | MDCK-mdr1a | Feng et al. (2008) |
| Paroxetine | Moderate | n/a | 26.2 ± 1.02 | ATPase assay | Feng et al. (2008) |
| Paroxetine | N | n/a | n/a | B(ovine)R(etinal)EC | Maines et al. (2005) |
| Sertraline | N1 | 0.4 | n/a | MDCK-MDR1 | Feng et al. (2008) |
| Sertraline | N2 | 0.5 | n/a | MDCK-mdr1a | Feng et al. (2008) |
| Sertraline | High | n/a | 9.4 ± 1.45 | ATPase assay | Feng et al. (2008) |
| Sertraline | Y | n/a | 4.7 | ATPase assay | Wang et al. (2008) |
| →Desmethylsertraline | Y | n/a | 6.5 | ATPase assay | Wang et al. (2008) |
| Venlafaxine | N1 | 0.9 | n/a | MDCK-MDR1 | Feng et al. (2008) |
| Venlafaxine | N2 | 1 | n/a | MDCK-mdr1a | Feng et al. (2008) |
| Venlafaxine | N | n/a | Neg | ATPase assay | Feng et al. (2008) |
Km = Michaelis constant (substrate concentration at which the reaction rate is half of its maximum value).
Cut-off for significance: 1.7 (based on retrospective statistical analysis of inter-week system variability control data).
Cut-off for significance: 1.5 (based on retrospective statistical analysis of inter-week system variability control data).
denotes a metabolite.
Of the antidepressants tested in transcellular transport assays to date, only fluvoxamine has been identified as a P-gp substrate (El Ela et al., 2004). However, it has recently been shown that transfection with ABCB1 in MDCK-MDR1 cells reduces the expression of endogenous canine P-gp relative to the wild-type MDCK cells (Kuteykin-Teplyakov et al., 2010). This finding may have implications for the interpretation of results from these studies, which were based on the assumption that endogenous drug transporter expression would be the same for wild-type and transfected cells. On the other hand, the SSRIs sertraline and paroxetine are high- and moderate-affinity P-gp substrates, respectively, according to results from ATPase assay studies, while the Michaelis constant (Km) values for nortriptyline and fluoxetine narrowly exceed the threshold set for moderate affinity (Feng et al., 2008). However, the ATPase assay does not determine if compounds are actually transported by P-gp. Thus, it seems that, while some of the tested antidepressants interact with P-gp in vitro, none of them have been identified as high-affinity P-gp substrates which are subjected to P-gp-mediated transport in bidirectional transcellular transport assays.
P-gp inhibition by antidepressants in vitro
Several antidepressants inhibit P-gp in vitro (Table 3). In Table 3, it is worth noting that the data in the second column represent the conclusions drawn by the specific authors of the individual studies. Again, it must be noted that the interpretation of results may differ from group to group. Interestingly, the level of P-gp inhibition observed for several of these antidepressants was similar to that of established P-gp inhibitors, such as verapamil and quinidine (Szabo et al., 1999; Weiss et al., 2003; Feng et al., 2008). For example, the concentration required to reduce P-gp activity by 50% (IC50) for paroxetine (29.8 µM) and sertraline (31.8 µM) is similar to that of quinidine (33.8 µM) (Weiss et al., 2003). It should be noted, however, that these antidepressant concentrations are 250- and 500-fold higher than normal therapeutic plasma levels for paroxetine and sertraline respectively (Weiss et al., 2003). However, post-mortem studies have demonstrated high brain-to-plasma concentration ratios for certain antidepressants (Pariante, 2008), and neuroimaging studies of fluorine-containing antidepressants have revealed steady-state brain concentrations in the micromolar range (Bolo et al., 2000). Moreover, P-gp inhibition by sertraline has been demonstrated in vivo (Wang et al., 2006a). Nonetheless, it remains uncertain if P-gp inhibitory concentrations of paroxetine or sertraline are reached at the BBB in clinical use.
Table 3.
In vitro studies of P-glycoprotein (P-gp) inhibition by antidepressant
| Antidepressant | P-gp inhibitor? | IC50 (µM) | Model | Ref. |
|---|---|---|---|---|
| Amitriptyline | Y | n/a | R123 uptake in Caco-2 cells | Ibrahim et al. (2000) |
| Amitriptyline | Y | n/a | R123/daunorubicin cellular uptake | Szabo et al. (1999) |
| Amitriptyline | Y | n/a | R123 efflux | Varga et al. (1996) |
| Citalopram | Y | 52.5 | Calcein-AM transport in MDCK-MDR1 cells | Feng et al. (2008) |
| Clomipramine | Y | n/a | R123 uptake in Caco-2 cells | Ibrahim et al. (2000) |
| Clomipramine | Y | n/a | Cell-line susceptibility to P-gp-substrate cytotoxics | Jaffrezou et al. (1995) |
| Clomipramine | Y | n/a | Cell-line susceptibility to P-gp-substrate cytotoxics | Merry et al. (1991) |
| Desipramine | Y | n/a | R123 uptake in Caco-2 cells | Ibrahim et al. (2000) |
| Desipramine | Y | n/a | Cell-line susceptibility to P-gp-substrate cytotoxics | Jaffrezou et al. (1995) |
| Desipramine | Y | n/a | R123/daunorubicin cellular uptake | Szabo et al. (1999) |
| Doxepine | Y | n/a | R123 uptake in Caco-2 cells | Ibrahim et al. (2000) |
| Doxepine | Y | n/a | R123/daunorubicin cellular uptake | Szabo et al. (1999) |
| Fluoxetine | Y | 31 | Calcein-AM transport in MDCK-MDR1 cells | Feng et al. (2008) |
| Fluoxetine | Y | n/a | Digoxin uptake in Caco-2 cells | Pariante et al. (2003b) |
| Fluoxetine | Y | 115.5 ± 11.7 | Calcein-AM transport in L-MDR1 and pBCEC cells | Weiss et al. (2003) |
| Fluvoxamine | N | >100 | Calcein-AM transport in MDCK-MDR1 cells | Feng et al. (2008) |
| Fluvoxamine | ? | 146.7 ± 1.95 | Talinolol transport in Caco-2 cells | El Ela et al. (2004) |
| Imipramine | Y | n/a | R123 uptake in Caco-2 cells | Ibrahim et al. (2000) |
| Imipramine | Y | n/a | Cell-line susceptibility to P-gp-substrate cytotoxics | Jaffrezou et al. (1995) |
| Imipramine | Y | n/a | R123/daunorubicin cellular uptake | Szabo et al. (1999) |
| Maprotiline | Y | n/a | R123/daunorubicin cellular uptake | Szabo et al. (1999) |
| Mianserin | Y | n/a | Cell-line susceptibility to P-gp-substrate cytotoxics | Jaffrezou et al. (1995) |
| Nefazodone | Y | 4.7 | R123 uptake in Caco-2 cells | Stormer et al. (2001) |
| Nortriptyline | N | >100 | Calcein-AM transport in MDCK-MDR1 cells | Feng et al. (2008) |
| Nortriptyline | N | n/a | R123 uptake in Caco-2 cells | Ibrahim et al. (2000) |
| Paroxetine | Y | 27.5 | Calcein-AM transport in MDCK-MDR1 cells | Feng et al. (2008) |
| Paroxetine | Y | n/a | [3H]Taxol uptake in bovine retinal endothelial cells | Maines et al. (2005) |
| Paroxetine | Y | 29.8 ± 11.1 | Calcein-AM transport in L-MDR1 and pBCEC cells | Weiss et al. (2003) |
| Protriptyline | Y | n/a | R123 uptake in Caco-2 cells | Ibrahim et al. (2000) |
| Sertraline | Y | 30 | Calcein-AM transport in MDCK-MDR1 cells | Feng et al. (2008) |
| Sertraline | Y | 31.8 ± 2.8 | Calcein-AM transport in L-MDR1 and pBCEC cells | Weiss et al. (2003) |
| Trazodone | N | n/a | R123 uptake in Caco-2 cells | Stormer et al. (2001) |
| Trimipramine | Y | n/a | R123 uptake in Caco-2 cells | Ibrahim et al. (2000) |
| Trimipramine | Y | n/a | Cell-line susceptibility to P-gp-substrate cytotoxics | Jaffrezou et al. (1995) |
| Trimipramine | Y | n/a | R123/daunorubicin cellular uptake | Szabo et al. (1999) |
| Venlafaxine | N | >100 | Calcein-AM transport in MDCK-MDR1 cells | Feng et al. (2008) |
| Selected prototypical P-gp inhibitors | ||||
| Quinidine | Y | 30.2 | Calcein-AM transport in MDCK-MDR1 cells | Feng et al. (2008) |
| Quinidine | Y | 33.8 ± 11.9 | Calcein-AM transport in L-MDR1 and pBCEC cells | Weiss et al. (2003) |
| Verapamil | Y | 18.1 | Calcein-AM transport in MDCK-MDR1 cells | Feng et al. (2008) |
| Verapamil | Y | 18.9 ± 4.2 | Calcein-AM transport in L-MDR1 and pBCEC cells | Weiss et al. (2003) |
Limitations of in vitro studies of P-gp antidepressant interactions
It is important to consider the limitations of these in vitro studies. Different studies have used the same assay for the same compound and reported contrasting results. Furthermore, different groups offer different interpretations of results, with contrasting cut-off values for significance. For example, the determined Km value for nortriptyline differed greatly between two studies using the same assay (ATPase), 257.6 µM in Ejsing et al. (2006) versus 56 ± 15.73 µM in Feng et al. (2008). Furthermore, the interpretation of these results conflicted between the two groups. Despite the fact that a lower Km value correlates with a stronger interaction, Ejsing and co-workers concluded that their findings confirmed an interaction which may be of clinical significance between nortriptyline and P-gp, while Feng and colleagues suggested that any such interaction is of minimal significance as they classified nortriptyline as a low-affinity P-gp substrate. Similarly discrepant findings were obtained for fluvoxamine's P-gp substrate status by different groups using transwell assay systems (El Ela et al., 2004; Feng et al., 2008). Additionally, in P-gp inhibition studies there was a marked contrast in the reported IC50 values for fluoxetine, 31 µM (Feng et al., 2008) versus 115.5 ± 11.7 µM (Weiss et al., 2003), while reported values for paroxetine and sertraline were in quite close agreement between the same two studies. Thus, it can be difficult to draw definitive conclusions from in vitro P-gp studies due to the discrepancies in results obtained depending on assay used and numerous other potential confounding factors. As a result, there remains a demand for the development of a validated and highly reliable predictive screening model for the accurate identification of P-gp substrates and inhibitors in vitro (von Richter et al., 2009).
In addition to the discordance in results obtained from different in vitro studies, there has been disagreement between in vitro and in vivo findings regarding the P-gp substrate status of certain antidepressant drugs. For example, citalopram (Rochat et al., 1999; Feng et al., 2008) and paroxetine (Maines et al., 2005; Feng et al., 2008) were found not to be P-gp substrates in various cell culture models. However, in vivo studies using P-gp-knockout mice have demonstrated increased brain/plasma concentration ratios in knockout mice relative to wild-type controls for both drugs (see later), thus suggesting that they are P-gp substrates at the BBB in vivo (Uhr and Grauer, 2003; Uhr et al., 2003; 2008; Doran et al., 2005). These differences may be as a result of a failure of in vitro systems to adequately reflect the complexity of the BBB in vivo and therefore highlight the difficulty in achieving acceptable correlations between in vitro and in vivo data in relation to drug transport across the BBB (Avdeef, 2011), thus calling the relevance of any of these in vitro assays into question. As P-gp extrudes its substrates directly from the inner leaflet of the cellular membrane bilayer, the properties of the membrane used in in vitro studies impact considerably on interactions between P-gp and the compound being tested (Romsicki and Sharom, 1999). Therefore, the use of epithelial cell lines such as Caco-2 and MDCK-MDR1 to predict interactions between drugs and P-gp expressed at the endothelial BBB in vivo may not be appropriate. To date, the use of BBB-derived endothelial cell lines in this regard has been limited, primarily due to the leakiness of such cell lines when cultured as monolayers in vitro (Avdeef, 2011). Alternatively, the discrepancies observed between in vitro and in vivo studies may highlight false assumptions relating to results derived from knockout mice. Indeed, the relevance of marginally increased brain/plasma ratios in knockout mice, relative to controls, has been questioned (Feng et al., 2008).
In vivo studies of interactions between P-gp and antidepressants in P-gp-knockout mice
Studies using P-gp-knockout mouse models have determined that P-gp plays a major role in the brain penetration of several antidepressants (Table 4) (Uhr et al., 2000; 2003; 2007; 2008; Uhr and Grauer, 2003; Grauer and Uhr, 2004; Doran et al., 2005; Karlsson et al., 2010; 2011). It is important to note that the majority of studies using the P-gp-knockout mouse models in this regard have involved acute antidepressant administration. As antidepressant drugs are administered chronically in clinical practice, studies investigating the impact of P-gp ablation on the brain distribution of antidepressant drugs and their metabolites following chronic administration would be of greater value.
Table 4.
In vivo studies using P-glycoprotein (P-gp)-knockout mice
| Brain/plasma Conc. | |||||||||
|---|---|---|---|---|---|---|---|---|---|
| Antidepressant | Dose | Class | Samples taken | WT | KO | KO/WT | Significance | Model | Ref. |
| Amitriptyline | 10 mg·kg−1 s.c. | TCA | 30 min post-injection | 8.1 | 8.0 | 1.03 | ns | Female mdr1ab (−/−) mice | Uhr et al. (2007) |
| Amitriptyline | 10 mg·kg−1 s.c. | TCA | 60 min post-injection | 11.5 | 8.9 | 0.83 | ns | Female mdr1ab (−/−) mice | Uhr et al. (2007) |
| Amitriptyline | 10 mg·kg−1 s.c. | TCA | 120 min post-injection | 11.7 | 16.0 | 1.43,4 | * | Female mdr1ab (−/−) mice | Uhr et al. (2007) |
| Amitriptyline | 10 mg·kg−1 s.c. | TCA | 240 min post-injection | 12.8 | 12.0 | 0.93 | ns | Female mdr1ab (−/−) mice | Uhr et al. (2007) |
| Amitriptyline | 5 mg·kg−1 i.p. | TCA | 1 h post-injection | n/a | n/a | ∼1.91,2 | * | Male mdr1a (−/−) mice | Uhr et al. (2000) |
| Amitriptyline | 10 mg·kg−1 s.c. bd for 10 days | TCA | 4 h after final dose | 10.3 | 13.3 | 1.33 | ns | Male mdr1ab (−/−) mice | Grauer and Uhr (2004) |
| →E-OH-AMI | n/a | AMI metabolite | 30 min post-AMI injection | 1.4 | 3.8 | 2.73 | n/a | Female mdr1ab (−/−) mice | Uhr et al. (2007) |
| →E-OH-AMI | n/a | AMI metabolite | 60 min post-AMI injection | 1.8 | 4.2 | 2.43 | n/a | Female mdr1ab (−/−) mice | Uhr et al. (2007) |
| →E-OH-AMI | n/a | AMI metabolite | 120 min post-AMI injection | 2.1 | 5.1 | 2.43 | n/a | Female mdr1ab (−/−) mice | Uhr et al. (2007) |
| →E-OH-AMI | n/a | AMI metabolite | 240 min post-AMI injection | 1.9 | 5.0 | 2.73,4 | * | Female mdr1ab (−/−) mice | Uhr et al. (2007) |
| →E-OH-AMI | n/a | AMI metabolite | 1 h post-AMI injection | n/a | n/a | ∼3.11,2 | * | Male mdr1a (−/−) mice | Uhr et al. (2000) |
| →E-OH-AMI | n/a | AMI metabolite | 4 h after final AMI dose | 1.6 | 2.2 | 1.33,4 | * | Male mdr1ab (−/−) mice | Grauer and Uhr (2004) |
| →Z-OH-AMI | n/a | AMI metabolite | 30 min post-AMI injection | 1.3 | 3.6 | 2.83 | n/a | Female mdr1ab (−/−) mice | Uhr et al. (2007) |
| →Z-OH-AMI | n/a | AMI metabolite | 60 min post-AMI injection | 1.6 | 3.4 | 2.13 | n/a | Female mdr1ab (−/−) mice | Uhr et al. (2007) |
| →Z-OH-AMI | n/a | AMI metabolite | 120 min post-AMI injection | 1.5 | 4.9 | 3.33 | n/a | Female mdr1ab (−/−) mice | Uhr et al. (2007) |
| →Z-OH-AMI | n/a | AMI metabolite | 240 min post-AMI injection | 1.4 | 6.8 | 4.73,4 | * | Female mdr1ab (−/−) mice | Uhr et al. (2007) |
| →Z-OH-AMI | n/a | AMI metabolite | 1 h post-AMI injection | n/a | n/a | ∼4.51,2 | * | Male mdr1a (−/−) mice | Uhr et al. (2000) |
| →Z-OH-AMI | n/a | AMI metabolite | 4 h after final AMI dose | 1.5 | 7.4 | 4.93,4 | * | Male mdr1ab (−/−) mice | Grauer and Uhr (2004) |
| →E-OH-NOR | n/a | AMI metabolite | 30 min post-AMI injection | n/a5 | 0.5 | n/a3,5 | n/a | Female mdr1ab (−/−) mice | Uhr et al. (2007) |
| →E-OH-NOR | n/a | AMI metabolite | 60 min post-AMI injection | n/a5 | 0.6 | n/a3,5 | n/a | Female mdr1ab (−/−) mice | Uhr et al. (2007) |
| →E-OH-NOR | n/a | AMI metabolite | 120 min post-AMI injection | 0.5 | 1.0 | 2.23 | n/a | Female mdr1ab (−/−) mice | Uhr et al. (2007) |
| →E-OH-NOR | n/a | AMI metabolite | 240 min post-AMI injection | 0.6 | 1.9 | 3.23,4 | * | Female mdr1ab (−/−) mice | Uhr et al. (2007) |
| →E-OH-NOR | n/a | AMI metabolite | 1 h post-AMI injection | n/a | n/a | ∼2.81,2 | * | Male mdr1a (−/−) mice | Uhr et al. (2000) |
| →E-OH-NOR | n/a | AMI metabolite | 4 h after final AMI dose | 0.5 | 3.7 | 8.03,4 | * | Male mdr1ab (−/−) mice | Grauer and Uhr (2004) |
| →Z-OH-NOR | n/a | AMI metabolite | 30 min post-AMI injection | n/a5 | 0.2 | n/a3,5 | n/a | Female mdr1ab (−/−) mice | Uhr et al. (2007) |
| →Z-OH-NOR | n/a | AMI metabolite | 60 min post-AMI injection | n/a5 | 0.2 | n/a3,5 | n/a | Female mdr1ab (−/−) mice | Uhr et al. (2007) |
| →Z-OH-NOR | n/a | AMI metabolite | 120 min post-AMI injection | 0.2 | 0.5 | 2.53 | n/a | Female mdr1ab (−/−) mice | Uhr et al. (2007) |
| →Z-OH-NOR | n/a | AMI metabolite | 240 min post-AMI injection | 0.3 | 0.9 | 2.83,4 | * | Female mdr1ab (−/−) mice | Uhr et al. (2007) |
| →Z-OH-NOR | n/a | AMI metabolite | 1 h post-AMI injection | n/a | n/a | ∼2.31,2 | * | Male mdr1a (−/−) mice | Uhr et al. (2000) |
| →Z-OH-NOR | n/a | AMI metabolite | 4 h after final AMI dose | 0.4 | 2.5 | 5.73,4 | * | Male mdr1ab (−/−) mice | Grauer and Uhr (2004) |
| Citalopram | 1 mg·kg−1 s.c. | SSRI | 1 h post-injection | 4.6 | 15.7 | 3.43,4 | * | Male mdr1ab (−/−) mice | Uhr and Grauer (2003) |
| Citalopram | 60 µg·day−1 s.c. | SSRI | After 11 days treatment | 1.5 | 5.4 | 3.7 | * | Male mdr1ab (−/−) mice | Uhr et al. (2008) |
| Citalopram | 3 mg·kg−1 s.c. | SSRI | Multiple time points | 5.1 | 9.7 | 1.9 | * | Female mdr1ab (−/−) mice | Doran et al. (2005) |
| Doxepine | 10 mg·kg−1 s.c. | TCA | 1 h post-injection | 7.1 | 7.6 | 1.13,4 | * | Male mdr1ab (−/−) mice | Uhr et al. (2003) |
| →D-Doxepine | n/a | DOX metabolite | 1 h post-DOX injection | 1.9 | 2.4 | 1.33,4 | * | Male mdr1ab (−/−) mice | Uhr et al. (2003) |
| Fluoxetine | 1.5 mg·kg−1 i.p. | SSRI | 1 h post-injection | n/a | n/a | ∼1.11,2 | ns | Male mdr1a (−/−) mice | Uhr et al. (2000) |
| Fluoxetine | 3 mg·kg−1 s.c. | SSRI | Multiple time points | 12.0 | 18.0 | 1.5 | * | Female mdr1ab (−/−) mice | Doran et al. (2005) |
| →Norfluoxetine | n/a | FLU metabolite | 1 h post-FLU injection | n/a | n/a | ∼1.11,2 | ns | Male mdr1a (−/−) mice | Uhr et al. (2000) |
| Fluvoxamine | 3 mg·kg−1 s.c. | SSRI | Multiple time points | 6.1 | 14.0 | 2.3 | * | Female mdr1ab (−/−) mice | Doran et al. (2005) |
| Mirtazapine | 1 mg·kg−1 s.c. | TeCA | 1 h post-injection | 3.1 | 3.0 | 1.0 | ns | Male mdr1ab (−/−) mice | Uhr et al. (2003) |
| Mirtazapine | 60 µg·day−1 s.c. | TeCA | After 11 days treatment | 4.6 | 4.6 | 1.0 | ns | Male mdr1ab (−/−) mice | Uhr et al. (2008) |
| Nortriptyline | 3 mg·kg−1 s.c. | TCA | Multiple time points | 11.0 | 20.0 | 1.8 | * | Female mdr1ab (−/−) mice | Doran et al. (2005) |
| Nortriptyline | 5 mg·kg−1 s.c. | TCA | n/a | n/a | n/a | 1.6 | * | mdr1a (−/−) mice | Ejsing et al. (2006) |
| →Nortriptyline | n/a | AMI metabolite | 30 min post-AMI injection | 2.8 | 2.6 | 0.93 | n/a | Female mdr1ab (−/−) mice | Uhr et al. (2007) |
| →Nortriptyline | n/a | AMI metabolite | 60 min post-AMI injection | 3.1 | 4.9 | 1.63 | n/a | Female mdr1ab (−/−) mice | Uhr et al. (2007) |
| →Nortriptyline | n/a | AMI metabolite | 120 min post-AMI injection | 4.8 | 7.3 | 1.53 | n/a | Female mdr1ab (−/−) mice | Uhr et al. (2007) |
| →Nortriptyline | n/a | AMI metabolite | 240 min post-AMI injection | 8.1 | 11.4 | 1.43,4 | * | Female mdr1ab (−/−) mice | Uhr et al. (2007) |
| →Nortriptyline | n/a | AMI metabolite | 1 h post-AMI injection | n/a | n/a | ∼2.41,2 | * | Male mdr1a (−/−) mice | Uhr et al. (2000) |
| →Nortriptyline | n/a | AMI metabolite | 4 h after final AMI dose | 6.8 | 14.6 | 2.13,4 | * | Male mdr1ab (−/−) mice | Grauer and Uhr (2004) |
| Paroxetine | 3 mg·kg−1 s.c. | SSRI | Multiple time points | 3.3 | 7.1 | 2.2 | * | Female mdr1ab (−/−) mice | Doran et al. (2005) |
| Paroxetine | 1 mg·kg−1 s.c. | SSRI | 1 h post-injection | 1.9 | 3.0 | 1.63,4 | * | Male mdr1ab (−/−) mice | Uhr et al. (2003) |
| Sertraline | 3 mg·kg−1 s.c. | SSRI | Multiple time points | 24.0 | 27.0 | 1.1 | ns | Female mdr1ab (−/−) mice | Doran et al. (2005) |
| Trimipramine | 10 mg·kg−1 s.c. | TCA | 1 h post-injection | 7.0 | 9.7 | 1.43,4 | * | Male mdr1ab (−/−) mice | Uhr and Grauer (2003) |
| →D-Trimipramine | n/a | TRI metabolite | 1 h post-TRI injection | 2.8 | 3.3 | 1.23,4 | * | Male mdr1ab (−/−) mice | Uhr and Grauer (2003) |
| Venlafaxine | 3 mg·kg−1 s.c. | SNRI | Multiple time points | 4.2 | 7.7 | 1.8 | * | Female mdr1ab (−/−) mice | Doran et al. (2005) |
| Venlafaxine | 5 mg·kg−1 s.c. | SNRI | 1 h post-injection | 4.9 | 8.8 | 1.83,4 | * | Male mdr1ab (−/−) mice | Uhr et al. (2003) |
| Venlafaxine | 300 µg·day−1 s.c. | SNRI | After 11 days treatment | 3.7 | 6.5 | 1.8 | * | Male mdr1ab (−/−) mice | Uhr et al. (2008) |
| Venlafaxine | 10 mg·kg−1 i.p. | SNRI | 1 h post-injection | 4.1 | 8.9 | 2.23,4 | ** | Male mdr1ab (−/−) mice | Karlsson et al. (2010) |
| Venlafaxine | 10 mg·kg−1 i.p. | SNRI | 3 h post-injection | 4.3 | 7.4 | 1.73,4 | *** | Male mdr1ab (−/−) mice | Karlsson et al. (2010) |
| Venlafaxine | 10 mg·kg−1 i.p. | SNRI | 6 h post-injection | 3.7 | 5.5 | 1.53,4 | * | Male mdr1ab (−/−) mice | Karlsson et al. (2010) |
| Venlafaxine | 10 mg·kg−1 i.p. | SNRI | 9 h post-injection | 4.0 | 4.8 | 1.23,4 | * | Male mdr1ab (−/−) mice | Karlsson et al. (2010) |
| Venlafaxine | 10 mg·kg−1 i.p. bd for 10 days | SNRI | 1 h after last injection | 4.8 | 8.2 | 1.73,4 | *** | Male mdr1ab (−/−) mice | Karlsson et al. (2011) |
| →D-Venlafaxine | n/a | VEN metabolite | 1 h post-VEN injection | 1.4 | 2.3 | 1.73,4 | * | Male mdr1ab (−/−) mice | Uhr et al. (2003) |
| →D-Venlafaxine | n/a | VEN metabolite | After 11 days VEN treatment | 1.6 | 6.2 | 3.6 | * | Male mdr1ab (−/−) mice | Uhr et al. (2008) |
| →D-Venlafaxine | n/a | VEN metabolite | 1 h post-VEN injection | 1.7 | 3.9 | 2.23,4 | ** | Male mdr1ab (−/−) mice | Karlsson et al. (2010) |
| →D-Venlafaxine | n/a | VEN metabolite | 3 h post-VEN injection | 5.0 | 12.0 | 2.43,4 | ** | Male mdr1ab (−/−) mice | Karlsson et al. (2010) |
| →D-Venlafaxine | n/a | VEN metabolite | 6 h post-VEN injection | 6.2 | 23.8 | 3.93,4 | *** | Male mdr1ab (−/−) mice | Karlsson et al. (2010) |
| →D-Venlafaxine | n/a | VEN metabolite | 9 h post-VEN injection | 5.3 | 15.9 | 3.03,4 | ** | Male mdr1ab (−/−) mice | Karlsson et al. (2010) |
| →D-Venlafaxine | n/a | VEN metabolite | 1 h after last VEN injection | 1.8 | 3.5 | 1.93,4 | *** | Male mdr1ab (−/−) mice | Karlsson et al. (2011) |
Estimation from graphical representation of data.
Cerebrum/spleen ratio, rather than brain/plasma ratio.
Differences in cerebrum concentrations, not normalized to plasma concentration, reported in original paper. Values presented here have been adjusted to account for differences in plasma concentrations.
Significance reported in original paper related to brain concentrations that were not normalized to plasma concentrations.
Ratio unavailable as brain concentrations in wild-type animals were below the limit of detection.
P < 0.05;
P < 0.01;
P < 0.001.
WT, wild-type; KO, P-gp-knockout; ns, non-significant; n/a, not available.
denotes a metabolite.
Interestingly, many of the identified P-gp substrate antidepressants are structurally unrelated and come from a variety of drug classes: including SSRIs, TCAs and SNRIs. Not all drugs from the same class behave similarly however; sertraline, another SSRI, for example is not a P-gp substrate (Doran et al., 2005).
Amitriptyline was found to have significantly higher brain concentrations in mice deficient in P-gp than in wild-type controls 1 h after acute administration (Uhr et al., 2000). However, later studies determined that this effect was transient and dependent on the dosing regimen and/or the route of administration (Grauer and Uhr, 2004; Uhr et al., 2007). Thus, the relevance of P-gp to the CNS pharmacokinetics of amitriptyline following chronic administration and at steady-state conditions is uncertain. While the exact reason for this phenomenon is unclear, a number of theories have been proposed (Uhr et al., 2007). For example, it is postulated that amitriptyline may induce changes at the BBB itself or that P-gp may become oversaturated with time, as certain amitriptyline metabolites are also P-gp substrates. Furthermore, the original study used single knockout abcb1a (−/−) mice (Uhr et al., 2000), while subsequent studies used double knockout abcb1ab (−/−) mice (Grauer and Uhr, 2004; Uhr et al., 2007). Thus, the differences observed between the two studies may be explained by amitriptyline efflux by abcb1b P-gp expressed at the BBB in single knockout abcb1a (−/−) mice.
Similarly, there is also a lack of clarity in the literature regarding the status of fluoxetine as a P-gp substrate in vivo following studies using single P-gp-knockout versus double P-gp-knockout mice (Uhr et al., 2000; Doran et al., 2005). The original study using single knockout abcb1a (−/−) mice found no difference between the accumulation of fluoxetine in the brains of abcb1a (−/−) mice and wild-type controls (Uhr et al., 2000). A subsequent study, however, found increased levels of fluoxetine in double knockout abcb1ab (−/−) mice relative to wild-type controls (Doran et al., 2005). Taken together, these data suggest that the brain pharmacokinetics of certain compounds may differ between single knockout abcb1a (−/−) mice and double knockout abcb1ab (−/−) mice. Furthermore, the data from Uhr and co-workers were from a single time point (1 h) following fluoxetine administration (Uhr et al., 2000); Doran and colleagues, on the other hand, took samples at various time points (Doran et al., 2005). Therefore, the impact of P-gp on fluoxetine distribution may be time-dependent.
In addition to investigating the impact of P-gp ablation on venlafaxine pharmacokinetics, Karlsson and co-workers investigated behavioural responses to chronic venlafaxine treatment between wild-type and P-gp-knockout mice (Karlsson et al., 2011). Chronic treatment with venlafaxine affected behaviour in the open field, with increased time spent in the centre of the arena and a reduced number of rears associated with venlafaxine treatment. Interestingly, this pharmacodynamic effect was more pronounced in P-gp-knockout mice after 7 days of venlafaxine treatment. The difference between the two strains was attenuated after 9 days of treatment, which may have been due to habituation associated with repeated testing in the open field (Thiel et al., 1999). While pharmacodynamic differences between P-gp-knockout and wild-type mice have previously been demonstrated following treatment with the antipsychotic drug, risperidone (Kirschbaum et al., 2008), this remains the only study demonstrating pharmacodynamic differences between the strains in response to treatment with an antidepressant drug. However, the relevance of behaviour in the open field to antidepressant treatment is unclear, and future studies in this area should focus on behavioural pharmacodynamic readouts in established animal models of antidepressant action (e.g. forced swim test and tail suspension test) (Cryan and Holmes, 2005).
It is important to consider the inherent limitations of the P-gp-knockout mouse model's utility in the assessment of the impact of P-gp-mediated efflux on drug distribution into the brain. For example, the expression of BCRP mRNA in the cerebral microvessels of abcb1a (−/−) mice is increased threefold relative to wild-type animals (Cisternino et al., 2004). Furthermore, this increase in BCRP mRNA expression is associated with a greater export of two of its substrates, prazosin and mitoxantrone, from the brain of abcb1a (−/−) mice versus wild-type controls (Cisternino et al., 2004). Importantly, other ABC transporters, including BCRP, demonstrate overlapping drug specificities with P-gp (Litman et al., 2001; Sharom, 2008), and the expression of ABC drug transporters at the BBB may become up-regulated following exposure to xenobiotics (Miller, 2010). Therefore, potential up-regulation of alternative drug efflux transporters, such as BCRP, in P-gp-knockout mice must be considered before valid conclusions can be drawn regarding in vivo P-gp drug interactions using this model.
In addition, following a comparison of in vitro and in vivo data for 23 compounds, it has been recommended that a threshold ratio of fourfold increase in brain/plasma drug concentration ratios between P-gp-knockout and wild-type mice (KO : WT B/P ratio) should be set to assess P-gp drug interactions in vivo (Feng et al., 2008). For example, risperidone, despite having a KO : WT B/P ratio of 10, indicating that it is heavily subjected to P-gp efflux, is still a very efficacious antipsychotic agent (Doran et al., 2005). This might reflect the possibility that high brain concentrations of risperidone are not required for it to exert its clinical effect. To date, no antidepressant drug has been shown to have a KO : WT B/P ratio greater than 3.6 (Table 4). Thus, it seems that no antidepressant has yet been identified as a high-affinity transported P-gp substrate, and therefore the overall influence of P-gp efflux on the effectiveness of antidepressants has been questioned (Doran et al., 2005). Furthermore, in many studies using knockout mice, brain antidepressant concentrations were not normalized against plasma levels (i.e. a brain/plasma concentration ratio was not used). Despite plasma drug concentrations being considerably higher in P-gp-knockout than wild-type mice in these studies, in some cases with statistically significant differences in plasma drug levels between the strains (Uhr et al., 2003), brain drug concentrations were compared directly between strains (Uhr et al., 2003; 2007). Thus, statistically significant differences in brain drug concentrations identified between these two strains in such studies may have been partially due to variations in plasma pharmacokinetics, rather than solely as a result of altered drug transport across the BBB due to a lack of P-gp.
In vivo studies in wild-type animals involving co-administration of P-gp inhibitors
Other in vivo studies have made use of established P-gp inhibitors, such as verapamil and cyclosporin, to investigate if inhibition of P-gp results in altered antidepressant drug penetration into the brain (Table 5).
Table 5.
In vivo studies using P-glycoprotein (P-gp) inhibitors
| Brain/serum conc. | ||||||||||
|---|---|---|---|---|---|---|---|---|---|---|
| Antidepressant | Dose | Class | Species (strain) | P-gp inhibitor | Brain region | Control | P-gp I | P-gp I/control | Significance | Ref. |
| Imipramine | 15 mg·kg−1 i.p. | TCA | Rat (Sprague Dawley) | Verapamil (20 mg·kg−1 i.p.) | Hypothalamus | 21.5 | 23.6 | 1.1 | ns | Clarke et al. (2009) |
| Imipramine | 15 mg·kg−1 i.p. | TCA | Rat (Sprague Dawley) | Verapamil (20 mg·kg−1 i.p.) | Frontal cortex | 11.9 | 28.4 | 2.4 | * | Clarke et al. (2009) |
| Imipramine | 15 mg·kg−1 i.p. | TCA | Rat (Sprague Dawley) | Verapamil (20 mg·kg−1 i.p.) | Hippocampus | 17.4 | 26.0 | 1.5 | * | Clarke et al. (2009) |
| Imipramine | 15 mg·kg−1 i.p. | TCA | Rat (Sprague Dawley) | Verapamil (20 mg·kg−1 i.p.) | Brainstem | 12.2 | 25.2 | 2.1 | *** | Clarke et al. (2009) |
| →Desipramine | IMI 15 mg·kg−1 i.p. | IMI metabolite | Rat (Sprague Dawley) | Verapamil (20 mg·kg−1 i.p.) | Hypothalamus | 31.5 | 32.3 | 1.0 | ns | Clarke et al. (2009) |
| →Desipramine | IMI 15 mg·kg−1 i.p. | IMI metabolite | Rat (Sprague Dawley) | Verapamil (20 mg·kg−1 i.p.) | Hippocampus | 13.8 | 15.1 | 1.1 | ns | Clarke et al. (2009) |
| →Desipramine | IMI 15 mg·kg−1 i.p. | IMI metabolite | Rat (Sprague Dawley) | Verapamil (20 mg·kg−1 i.p.) | Frontal cortex | 13.2 | 19.0 | 1.4 | ** | Clarke et al. (2009) |
| →Desipramine | IMI 15 mg·kg−1 i.p. | IMI metabolite | Rat (Sprague Dawley) | Verapamil (20 mg·kg−1 i.p.) | Brainstem | 10.0 | 13.4 | 1.3 | ns | Clarke et al. (2009) |
| Nortriptyline | 5 mg·kg−1 i.p. | TCA | Rat | Verapamil (50 mg·kg−1 i.p.) | Whole brain | n/a | n/a | 1.6 | ** | Ejsing et al. (2006) |
| Nortriptyline | Various i.p. (pooled) | TCA | Rat | Cyclosporin (200 mg·kg−1 i.p.) | Whole brain | n/a | n/a | 1.3 | * | Ejsing et al. (2006) |
| Nortriptyline | 25 mg·kg−1 p.o. | TCA | Rat (Wistar Hanover GALAS) | Cyclosporin (200 mg·kg−1 p.o.) | Whole brain | 16.2 | 22.5 | 1.4 | * | Ejsing and Linnet (2005) |
| Nortriptyline | 10 mg·kg−1 i.p. | TCA | Rat (Wistar Hanover GALAS) | Cyclosporin (200 mg·kg−1 i.p.) | Whole brain | 17.0 | 22.0 | 1.3 | * | Ejsing and Linnet (2005) |
| Nortriptyline | 25 mg·kg−1 i.p. | TCA | Rat (Wistar Hanover GALAS) | Cyclosporin (200 mg·kg−1 i.p.) | Whole brain | 23.0 | 27.0 | 1.2 | ns | Ejsing and Linnet (2005) |
| Nortriptyline | Various (pooled) | TCA | Rat (Wistar Hanover GALAS) | Cyclosporin (200 mg·kg−1 p.o.) | Whole brain | 20.0 | 25.0 | 1.3 | ** | Ejsing and Linnet (2005) |
| →E-OH-NT | NOR 25 mg·kg−1 p.o. | NOR metabolite | Rat (Wistar Hanover GALAS) | Cyclosporin (200 mg·kg−1 p.o.) | Whole brain | 1.2 | 2.0 | 1.7 | ns | Ejsing and Linnet (2005) |
| →E-OH-NT | NOR 10 mg·kg−1 i.p. | NOR metabolite | Rat (Wistar Hanover GALAS) | Cyclosporin (200 mg·kg−1 i.p.) | Whole brain | ∼1.7 | ∼1.9 | 1.1 | ns | Ejsing and Linnet (2005) |
| →E-OH-NT | NOR 25 mg·kg−1 i.p. | NOR metabolite | Rat (Wistar Hanover GALAS) | Cyclosporin (200 mg·kg−1 i.p.) | Whole brain | ∼0.9 | ∼1.1 | 1.2 | ns | Ejsing and Linnet (2005) |
| →E-OH-NT | NOR various (pooled) | NOR metabolite | Rat (Wistar Hanover GALAS) | Cyclosporin (200 mg·kg−1 p.o.) | Whole brain | 1.3 | 1.6 | 1.3 | ns | Ejsing and Linnet (2005) |
| Risperidone1 | 1 mg·kg−1 i.p. | n/a (antipsychotic) | Mouse (CF1) | Sertraline (SSRI; 10 µg·g−1 i.p.) | Whole brain | 1.6 | 2.3 | 1.4 | ** | Wang et al. (2006a) |
| →9-OH-Risp | RISP 1 mg·kg−1 i.p. | RISP metabolite | Mouse (CF1) | Sertraline (SSRI; 10 µg·g−1 i.p.) | Whole brain | 0.9 | 2.5 | 2.8 | ** | Wang et al. (2006a) |
Risperidone is an antipsychotic drug known to be a P-gp substrate. This study demonstrates P-gp inhibition by sertraline in vivo.
P < 0.05;
P < 0.01;
*P < 0.001.
P-gp I, group treated with P-gp inhibitor; ns, non-significant.
denotes a metabolite.
Using this method, nortriptyline was shown to have significantly higher brain/serum ratios in rats treated with a P-gp inhibitor than in untreated controls. However, this increase was relatively small, equating to c. 25% increase in the brain–serum ratio (Ejsing and Linnet, 2005).
The use of whole brain in the analysis above may have obscured potentially greater region-specific central increases in drug concentration. In order to address this issue, the effect of P-gp inhibition on imipramine and desipramine concentrations in various brain regions was determined (Clarke et al., 2009), and it was found that there was a region-specific effect. For example, the frontal cortex/serum imipramine concentration ratio was significantly increased to 2.4, compared to a non-significant ratio of 1.1 in the hypothalamus (Clarke et al., 2009). Similarly for desipramine, a significant effect was observed in the frontal cortex but not for other brain areas (Clarke et al., 2009). Thus, it seems that the effect of P-gp on drug penetration into the CNS is not uniform, and region-specific effects should be taken into account when interpreting data in P-gp interaction studies, as potentially significant results may be obscured or missed entirely. In addition, it has recently been demonstrated that pharmacological induction of P-gp using any one of three different inducing agents (rifampicin, dexamethasone or 5-pregnene-3beta-ol-20-on-16alpha-carbonitrile) results in reduced brain distribution of risperidone and its active metabolite, 9-hydroxyrisperidone (Holthoewer et al., 2010). Similar investigations in relation to antidepressant drugs would help to further clarify the role played by P-gp in their BBB transport.
Interestingly, a study evaluating pharmacokinetic interactions between the antipsychotic drug risperidone and the antidepressant sertraline in CF1 mice demonstrated P-gp inhibition by sertraline, resulting in significantly increased brain risperidone levels (Wang et al., 2006a). This in vivo finding supports in vitro studies reporting P-gp inhibition by sertraline (Weiss et al., 2003; Feng et al., 2008). As the plasma sertraline levels achieved in this study approximate those observed in patients treated with the drug, this finding suggests that sertraline may induce clinically significant P-gp inhibitory effects in therapeutic use. Whether these preclinical findings can translate into therapeutic potential of P-gp inhibitors as adjunctive therapies in the treatment of schizophrenia remains to be determined.
Regulation of P-gp in depression
The regulation of P-gp at the BBB has recently been extensively reviewed (Miller, 2010). Various factors, including disease, pharmacotherapy and diet, are involved in the complex regulatory processes. Genetics also play an important role in determining P-gp activity. Over 50 functional single nucleotide polymorphisms (SNPs) have been identified in the ABCB1 gene to date (Stein et al., 1994; Hoffmeyer et al., 2000; Cascorbi et al., 2001; Ito et al., 2001; Kim et al., 2001; Cascorbi, 2006; Salama et al., 2006; Kimchi-Sarfaty et al., 2007; Sakurai et al., 2007). Various studies, including clinical investigations, have demonstrated that such SNPs can have an impact on P-gp expression and function in humans, and therefore influence the pharmacokinetics of various drugs (Hoffmeyer et al., 2000; Johne et al., 2002), including the antidepressant drug, fluvoxamine (Fukui et al., 2007).
Importantly, a recent PET study using [11C]-verapamil has shown that P-gp function is increased in patients with major depression receiving antidepressant treatment (de Klerk et al., 2009). Using this technique, cerebral volume of distribution of [11C]-verapamil is used as a measure of P-gp function. However, the value of this technique has been questioned due to low brain uptake of verapamil, meaning that in situations of increased P-gp function the signal would be particularly noisy (Syvanen and Hammarlund-Udenaes, 2010). Furthermore, in this study, no metabolites were analysed, which is a major shortcoming (de Klerk et al., 2009). Therefore, the conclusions drawn from this study cannot be interpreted as definitive. The reason for the apparent increase in P-gp function in medicated depressed patients has not been fully elucidated, but there are several potential explanations that warrant further investigation. Firstly, it may be due to P-gp induction by chronic antidepressant treatment itself, and therefore not be related to the disease per se, as it is known that treatment with xenobiotics can increase P-gp expression (Bauer et al., 2004; Narang et al., 2008). This theory is supported by both in vitro and in vivo studies demonstrating induction of P-gp by the antidepressant venlafaxine (Ehret et al., 2007; de Klerk et al., 2010). Secondly, various cytokines increase the expression and activity of P-gp in vitro (Bauer et al., 2007; Yu et al., 2007; Liptrott et al., 2009) and immune activation, with correspondingly increased circulating cytokine levels, has been widely reported in depressed patients (Schiepers et al., 2005; Dinan, 2009). Therefore, immune activation may contribute to the increased P-gp function observed in medicated depressed patients. However, P-gp activity, as measured by the cerebral volume of distribution of [11C]-verapamil, was reduced in rats which were subjected to chronic foot-shock stress as a model of human depression (de Klerk et al., 2010). This increase in the cerebral volume of distribution of [11C]-verapamil may be reflective of stress-mediated disruption of the BBB through non-P-gp-mediated mechanisms, however, as no other marker was used to verify the integrity of the BBB independent of P-gp. In addition, the translational value of this rat model to processes ongoing at the BBB in depressed patients is unclear. Finally, functional SNPs in the ABCB1 gene may explain the altered P-gp activity observed in depressed patients. Indeed, certain uncommon polymorphisms in ABCB1 were linked to the severity of depressive symptoms in a cohort of Taiwanese depressed patients (Lin et al., 2011). The functional impact of these particular polymorphisms has not yet been characterized, however. It would be of interest to conduct a PET study using [11C]-verapamil in a similar group of patients to determine if BBB P-gp function is related to genotype.
Clinical significance of P-gp efflux in antidepressant treatment
Given that preclinical findings have identified many antidepressants as P-gp substrates, and that medicated depressed patients have increased P-gp activity (de Klerk et al., 2009), it is plausible that P-gp efflux of antidepressants may be clinically relevant in the treatment of depression. Importantly, co-administration of a P-gp inhibitor, itraconazole, increases the bioavailability of paroxetine in humans (Yasui-Furukori et al., 2007) and fluvoxamine and citalopram plasma pharmacokinetics were found to be dependent on polymorphisms in the ABCB1 gene (Fukui et al., 2007; Nikisch et al., 2008), indicating that these antidepressants are P-gp substrates in humans. In addition to these studies demonstrating an association between plasma pharmacokinetics and variants of the ABCB1 gene, it has been hypothesized that P-gp efflux of antidepressants at the BBB may influence clinical response to antidepressant treatment and/or frequency of side effects (Figure 3). Many studies have investigated this hypothesis and, interestingly, different groups have found associations between functional polymorphisms in the ABCB1 gene and antidepressant response and/or frequency of side effects (Roberts et al., 2002; Gex-Fabry et al., 2008; Kato et al., 2008; Nikisch et al., 2008; Uhr et al., 2008; Sarginson et al., 2010). However, there is much disagreement in the literature regarding the involvement of different SNPs.
Figure 3.

Antidepressants as P-gp substrates at the BBB. Representation of an endothelial cell at the BBB, expressing P-gp at its apical surface. Based on numerous in vitro and in vivo studies, it is thought that many antidepressant drugs may be P-gp substrates at the BBB. Extrusion of antidepressant drug molecules from the apical membrane by P-gp could limit drug concentrations at their site of action within the CNS. Therefore, clinically effective brain concentrations might not be achieved in some cases, which in turn may play a role in TRD. This may be of particular significance in light of a recent report suggesting that P-gp function may be increased in depressed patients treated with antidepressants (de Klerk et al., 2010).
The majority of clinical studies in this area have focused on a small number of ABCB1 SNPs, mostly at the 3435 and 2677 sites. An early study found postural hypotension to be significantly more common following treatment with nortriptyline in patients carrying the C3435T SNP (Roberts et al., 2002). It was hypothesized that this may have been due to a relative increase in the accumulation of nortriptyline, or its metabolites, in the brain due to reduced P-gp function. Clinical response to nortriptyline (or fluoxetine) was not associated with the C3435T SNP in this study, however (Roberts et al., 2002). In contrast, paroxetine treatment response has been shown to have a significant association with ABCB1 genotype (Gex-Fabry et al., 2008; Kato et al., 2008). However, the SNPs that were linked to paroxetine treatment response differed between these two studies. Kato and colleagues reported a significant positive association between the G2677T/A SNP and paroxetine treatment response. Furthermore, a link between the ABCB1 haplotype combination 3435C–2677G–1236T and a poor therapeutic response to paroxetine was identified (Kato et al., 2008). These associations did not reach significance in another study, however, in which a link was found between a SNP at the 61 position in the ABCB1 gene and the therapeutic response to paroxetine (Gex-Fabry et al., 2008). In addition, a later study failed to replicate the findings of Kato and colleagues (Mihaljevic Peles et al., 2008). It should, however, be noted that these studies were undertaken in patient cohorts from different ethnic backgrounds (Japanese vs. Caucasians).
Furthermore, the associations observed between ABCB1 SNPs and paroxetine treatment response have not been observed with other antidepressants. In fact, Nikisch et al. (2008) reported directly conflicting findings with regard to citalopram, with the G2677T genotype being significantly more common in non-responders to citalopram treatment. This correlated with significantly lower plasma and cerebrospinal fluid citalopram concentrations in patients with the G2677T genotype relative to carriers of the wild-type allele, while no difference was observed in the same study for the C3435T polymorphism (Nikisch et al., 2008). However, the small number of subjects in this pilot study (n = 15) is a limitation. In addition, no significant correlation was found between the G2677T/A polymorphism and therapeutic response or side effect severity in patients treated with amitriptyline (Laika et al., 2006). Another study failed to find any correlation between the C3435T polymorphism and the frequency of antidepressant-induced mania in bipolar patients, treated with various serotonergic antidepressants (De Luca et al., 2003). However, the wide range of antidepressants involved in the study, some of which have been shown to be P-gp substrates (paroxetine, venlafaxine, fluoxetine, etc.) and others which have not (sertraline, nefazodone, moclobemide), and the focus on an independent polymorphism, as opposed to its role as part of a haplotype, are major confounding factors (De Luca et al., 2003).
In contrast to other studies which focused on a limited number of individual SNPs, Uhr and colleagues adopted a comprehensive fine-mapping approach in their investigation of the functional consequences of ABCB1 SNPs in antidepressant treatment (Uhr et al., 2008). This involved tagging all common variants of this gene in Caucasians, and then determining if there was a link between remission rates in antidepressant-treated patients and any of the ABCB1 gene variants identified. Patients in the study were treated with antidepressants which have been identified as substrates of P-gp in vivo (namely venlafaxine, citalopram, paroxetine and amitriptyline) and mirtazapine, which is not a P-gp substrate. No association was found between antidepressant treatment response and the G2677T or C3435T SNPs (Uhr et al., 2008). This finding in relation to the G2677T and C3435T SNPs was subsequently replicated for citalopram, following analysis of data from the large Sequenced Treatment Alternatives to Relieve Depression (STAR*D) sample of depressed patients (Peters et al., 2008).
However, a significant association was observed between remission rates in patients treated with P-gp substrate antidepressants and other common intronic ABCB1 polymorphisms which were identified in the fine-mapping of the gene (Uhr et al., 2008). Patients carrying the rare alleles of these intronic SNPs and receiving treatment with P-gp substrate antidepressants had a 7.7-fold higher chance to remit after 5 weeks than carriers of the other alleles. This association was not due to differences in dosing or plasma levels, thus suggesting a role for P-gp function at the BBB. In addition, no such association was determined in patients treated with mirtazapine, which is not a P-gp substrate (Uhr et al., 2008), thus supporting the P-gp-related hypothesis. These findings have since been replicated for paroxetine (P-gp substrate) and mirtazapine (not a P-gp substrate) (Sarginson et al., 2010), thus supporting the theory that polymorphisms identified by Uhr and co-workers may indeed be of clinical significance. Interestingly, mirtazapine has been identified as one of the most potent and effective of the new generation of antidepressants (Cipriani et al., 2009). Importantly, in their retrospective analysis of data from the large STAR*D clinical trial population, Peters and colleagues failed to replicate the findings of Uhr and co-workers with regard to an association between certain ABCB1 SNPs and citalopram response (Peters et al., 2008). While the original focus of their study involved investigating potential links between three common ABCB1 variants (C1236T, G2677T/A and C3435T) and citalopram response, two of the ABCB1 SNPs in the first haplotype block reported to be significant by Uhr and colleagues were also genotyped, and were not associated with citalopram response in the STAR*D population (Peters et al., 2008). The authors did not have genotype data on the second haplotype block, and therefore could not determine if this region was associated with citalopram response (Peters et al., 2009). Significant links were also found between escitalopram response and uncommon ABCB1 SNPs in Taiwanese depressed patients (Lin et al., 2011). However, the loci associated with remission in this patient cohort were different to those identified by Uhr and co-workers. Significant associations between duloxetine treatment response and some of the ABCB1 polymorphisms detected by Uhr et al. (2008) were not observed in a later study (Perlis et al., 2010). As the P-gp substrate status of duloxetine has not been established in vitro or in vivo, these findings do not necessarily disagree with earlier work related to these SNPs. Given its place in clinical practice, further studies to determine the impact of P-gp on duloxetine distribution would be of interest.
An additional confounding factor in the association of ABCB1 SNPs with antidepressant response is the expression of other drug efflux pumps at the BBB which may play a role in the transport of antidepressants. For example, citalopram has been demonstrated to be a substrate of the multidrug resistance protein 1 (MRP1/ABCC1) in vitro (Lee et al., 2010), and a SNP in this gene was found to be significantly associated with citalopram response (Lee et al., 2010). Thus, the ability of antidepressants to penetrate the BBB is not solely dependent on P-gp, and other factors need to be considered when interpreting results of studies that focus entirely on P-gp.
Stress, the HPA axis, depression and P-gp
Stress plays a major role in the development of depression. The hypothalamic-pituitary-adrenal (HPA) axis controls the physiological response to stress through the secretion of corticosteroid hormones such as cortisol, the main glucocorticoid in humans. Dysregulation of the HPA axis has been implicated in the pathogenesis of depression (Holsboer, 2000; Julio-Pieper and Dinan, 2010). The HPA axis is regulated by negative feedback inhibition, whereby secreted corticosteroid hormones act on the hypothalamus and pituitary gland to suppress further HPA axis activation by reducing corticotropin-releasing hormone and adrenocorticotropic hormone (ACTH) secretion respectively. Hyperactivity of the HPA axis is one of the most consistent biological findings in depressed patients (Pariante and Lightman, 2008). Depressives often have elevated plasma cortisol (Halbreich et al., 1985) and ACTH (Carroll et al., 2007) levels, and fail to respond to the dexamethasone suppression test (Carroll, 1982a,b), whereby administration of the synthetic glucocorticoid dexamethasone should suppress the secretion of cortisol. This is indicative of central HPA axis overdrive, with compromised negative feedback inhibition at the hypothalamic level of the HPA axis, in depressed patients.
Some important endogenous and synthetic glucocorticoids are P-gp substrates (Ueda et al., 1992; Vankalken et al., 1993; Schinkel et al., 1995; Meijer et al., 1998; Karssen et al., 2001; 2002; Uhr et al., 2002). Thus, to exert control on the HPA axis at the hypothalamic level, glucocorticoids must firstly overcome the barrier presented by P-gp at the BBB, and then reach the intracellular glucocorticoid receptor. Furthermore, there is also evidence of neuronal P-gp expression in rats (Pariante et al., 2003a; Karssen et al., 2004; Volk et al., 2004; Lazarowski et al., 2007). Interestingly, P-gp-knockout abcb1ab (−/−) mice have consistently lower plasma ACTH and corticosterone levels than control animals. This indicates that P-gp may play a key role in the regulation of the HPA axis, and that absence of P-gp results in sustained suppression of the HPA axis (Muller et al., 2003; Yau et al., 2007). Furthermore, treatment with the TCA desipramine reduced both basal and activated HPA axis activity in FVB/N control mice, while the same treatment only reduced an activated HPA axis in abcb1ab (−/−) mice (Yau et al., 2007). This difference observed between P-gp-knockout and wild-type mice further indicates that there may be a P-gp-dependent mechanism at play also in the regulation of the HPA axis.
Increasing recent evidence strongly suggests that corticosterone (the main glucocorticoid in rodents) is not a P-gp substrate at the BBB in mice (Mason et al., 2008; 2010), despite initial reports to the contrary (Uhr et al., 2002). Therefore, the suppressed HPA axis observed in P-gp-knockout mice cannot be explained by enhanced corticosterone entry into the brain due to the absence of P-gp at the BBB leading to greater negative feedback inhibition, as was originally hypothesized (Muller et al., 2003; Yau et al., 2007). Further investigations are therefore needed to fully explain these observations. Furthermore, it now seems that P-gp does not play a major role in the ability of cortisol (the main glucocorticoid in humans) to cross the BBB (Mason et al., 2008; 2010). Regardless of this controversy, successful antidepressant therapy results in normalization of the HPA axis (Herr et al., 2003; Kunzel et al., 2003). Antidepressant-mediated enhancement of glucocorticoid receptor function has been demonstrated in vitro (Pariante et al., 1997; 2001; 2003a,b; Herr et al., 2003). Interestingly, this effect was observed following antidepressant co-incubation with glucocorticoids that are P-gp substrates, such as dexamethasone and cortisol, but was not evident with non-P-gp substrate glucocorticoids, such as corticosterone (Pariante et al., 1997). Co-incubation with the P-gp inhibitor verapamil attenuated or reduced the glucocorticoid-enhancing effect of the antidepressants clomipramine and fluoxetine (Pariante et al., 2001; 2003a,b), thus indicating that antidepressant-mediated P-gp inhibition may be the underlying mechanism at play. Therefore, it has been suggested that increased access of cortisol to the brain by inhibition of P-gp at the BBB, thereby enhancing glucocorticoid-mediated negative feedback on the HPA axis contributes significantly to the clinical mechanism of action of antidepressants (Figure 4) (Pariante et al., 2004).
Figure 4.
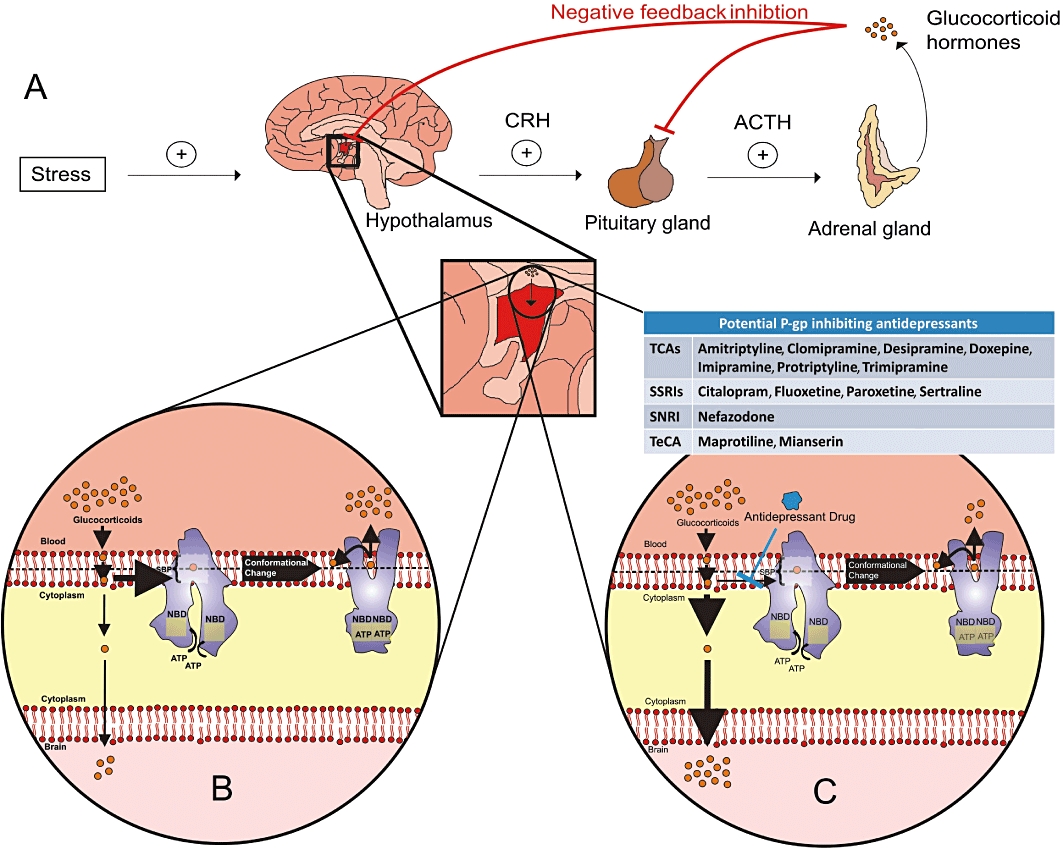
Potential interaction between regulation of the HPA axis and antidepressants as P-gp inhibitors*. (A) Stress activates the HPA axis by triggering the release of corticotropin-releasing hormone <CRH>> from the hypothalamus, which in turn acts on the anterior pituitary gland to secrete ACTH. ACTH stimulates the release of glucocorticoid hormones from the adrenal cortex. These glucocorticoid hormones, including cortisol, the main glucocorticoid in humans, inhibit the release of CRH and ACTH from the hypothalamus and pituitary gland respectively, thus exerting negative feedback control on the system. However, control of the HPA axis is often dysregulated in depressed patients, who may exhibit elevated levels of circulating cortisol and ACTH due to hyperactivity of the HPA axis. (B) Many glucocorticoids are P-gp substrates. Therefore, in depressed patients, P-gp may limit the entry of glucocorticoids into the brain at the BBB, thus resulting in reduced negative feedback inhibition of the HPA axis. (C) Successful treatment of depression results in normalization of the HPA axis, and many antidepressant drugs have been shown to enhance glucocorticoid receptor activity in vitro– an effect attenuated or reduced by co-incubation with a P-gp inhibitor. Therefore, it has been hypothesized that part of the mechanism of action of these antidepressant drugs may be to facilitate the access of glucocorticoids to the hypothalamus by inhibiting P-gp, thereby restoring central negative feedback control of the HPA axis. *It should be noted that this hypothesis is not supported by a recent in vivo study with the antidepressant desipramine (Mason et al., 2011). TeCA, tetracyclic antidepressant.
This theory has, however, been challenged (Weber et al., 2005; 2006). Firstly, it has been questioned if P-gp inhibition by antidepressants could be clinically relevant given that it is only seen at concentrations above therapeutically relevant plasma levels (Weber et al., 2005). Furthermore, it seems that P-gp is present in excess in brain capillaries (Miller, 2010), which may influence the concentration of P-gp inhibitor needed to meaningfully increase substrate transport across a membrane (Kannan et al., 2009). As a result, for antidepressants to exert clinically significant P-gp inhibition at the BBB, concentrations several times higher than their IC50 would need to be achieved (Kalvass and Pollack, 2007). Therefore, it remains unclear if P-gp inhibitory concentrations of antidepressants are reached at the BBB in clinical use.
In the second study challenging the relevance of P-gp inhibition to HPA axis normalizing ability of antidepressants (Weber et al., 2006), a potentially sub-effective dose of amitriptyline was used (Yau et al., 2007). Moreover, it involved the comparison of corticosterone levels in the brain and plasma, and it has subsequently been demonstrated that corticosterone is not a P-gp substrate in vivo (Mason et al., 2008), thus undermining conclusions drawn from the study. Nonetheless, despite ample in vitro data demonstrating P-gp inhibition and P-gp-mediated enhancement of glucocorticoid function by antidepressants, there is a paucity of in vivo data to support the hypothesis that increased penetration of glucocorticoids into the CNS as a result of P-gp inhibition by antidepressants leads to normalization of a hyperactive HPA axis via enhanced negative feedback inhibition. In fact, a very recent publication from the Pariante group (the original proposers of this hypothesis) has failed to demonstrate that either acute or chronic administration of the antidepressant drug desipramine results in P-gp inhibition leading to enhanced brain levels of glucocorticoids in an in situ mouse model (Mason et al., 2011). This study, in conjunction with another reporting enhanced P-gp function following chronic antidepressant treatment (de Klerk et al., 2010), undermines the hypothesis, and therefore it now seems unlikely that antidepressant-mediated inhibition of P-gp contributes to the clinical mechanism of action of antidepressant drugs.
Conclusion: inhibition of P-gp as an antidepressant augmentation strategy?
While several preclinical studies have robustly identified various antidepressants as transported P-gp substrates, these findings have generally not been supported by investigations using in vitro transwell transport assays. From a clinical perspective, interactions between antidepressant drugs and P-gp could potentially lead to altered dose-to-plasma relationships and/or frequency of side effects with altered P-gp function. In particular, increased P-gp-mediated efflux of antidepressants at the BBB would limit the access of antidepressant drugs to their site of action within the brain, therefore potentially contributing to the high rate of treatment failure. Many studies have reported associations between functional SNPs in ABCB1 and antidepressant treatment response. However, there appears to be little consensus among the reported results, with numerous publications claiming antithetical findings. This is unsurprising considering the difficulties in drawing accurate conclusions from genetic epidemiology studies (Chanock et al., 2007; Kraft, 2008). Furthermore, it seems unlikely that any individual SNP or gene alone is responsible for antidepressant response; therefore, a multi-locus approach to predictive pharmacogenetics may be more appropriate (Ising et al., 2009). Nonetheless, the report of Uhr and colleagues in 2008 is extremely promising (Uhr et al., 2008), especially considering some of their findings have been recently replicated (Sarginson et al., 2010), although it must also be noted that others have failed to replicate certain aspects of these findings (Peters et al., 2008). Thus, the importance of the putative role of ABCB1 variants in the clinical efficacy of antidepressants remains controversial, and well-powered, prospective clinical trials are needed to definitively resolve this issue (Peters et al., 2009). Until such time as these trials have taken place, it remains plausible that P-gp inhibitors may augment the effects of certain antidepressants, particularly in treatment-resistant situations. Indeed, anecdotal evidence from one of the authors (Dinan) indicates a beneficial effect of adjunctive verapamil treatment in severely depressed patients who are refractory to SSRI treatment (Clarke et al., 2009). Clinical trials, exercising caution to avoid potential unwanted side effects due to unexpected pharmacokinetic or pharmacodynamic interactions, investigating this possibility may now be warranted.
One common approach used in the treatment of TRD is the augmentation of a failed antidepressant therapy with another agent, such as the antipsychotics aripiprazole, olanzapine, quetiapine or risperidone (Philip et al., 2010). Interestingly, some of these antipsychotics inhibit P-gp in vitro (Wang et al., 2006b; Zhu et al., 2007; Feng et al., 2008); it is tempting to speculate that this property may contribute to their therapeutic efficacy as adjunctive treatments. Furthermore, co-administration of risperidone with sertraline has been shown to result in a trend for increased sertraline concentrations in the brain of CF1 mice in vivo (Wang et al., 2006a). Therefore, one could hypothesize that the mechanistic explanation for this augmentation strategy involves the inhibition of P-gp by the antipsychotic drug, leading to increased central antidepressant concentrations. However, further studies (both in vitro and in vivo) are needed to establish if there is any merit to this hypothesis.
The theory suggesting that P-gp inhibition at the BBB by some antidepressants may contribute to their mechanism of action is certainly interesting, but there is an increasing body of evidence undermining the hypothesis. The single study demonstrating P-gp inhibition by an antidepressant in vivo (Wang et al., 2006a) has not yet been replicated. Furthermore, it has yet to be proven that P-gp inhibitory concentrations of antidepressants are reached at the BBB in the clinical setting. It is also necessary to clarify the underlying mechanism behind the reduced corticosterone levels observed in P-gp-knockout mice relative to controls. Furthermore, P-gp function has been shown to be increased in depressed patients treated with chronic antidepressants relative to healthy controls (de Klerk et al., 2009). This would seem to contradict the theory that antidepressant treatment inhibits P-gp function at the BBB. However, the antidepressants used by the patients in this study were not listed. Therefore, it is not possible to determine if patients were treated with antidepressant medications that are thought to inhibit P-gp. Most importantly, a recent study failed to demonstrate that administration of the antidepressant desipramine results in P-gp inhibition leading to enhanced glucocorticoid entry into the brain, questioning the validity of the original hypothesis (Mason et al., 2011). Therefore, on balance, evidence to support the theory that P-gp inhibition by antidepressants at the BBB contributes to their mechanism of action is controversial and not supported by very recent in vivo studies. More research in this area is needed to prove whether such negative effects generalize to other antidepressants.
In conclusion, recent studies suggest that a complex, and as yet not fully understood, relationship exists between antidepressants and drug efflux pumps, such as P-gp, at the BBB, and that this relationship may impact on the therapeutic efficacy of antidepressant treatment. TRD represents a major challenge in the treatment of depression, and there is a huge unmet medical need for novel approaches to overcome this challenge. Advances in pharmacogenomics, neuroimaging and animal studies, coupled with more sophisticated in vitro assay technology, are sure to shed light on the interaction between antidepressants and P-gp in the coming years, thus potentially resulting in new strategies for adjunctive therapies for TRD.
Acknowledgments
The Alimentary Pharmabiotic Centre is a research centre funded by Science Foundation Ireland (SFI), through the Irish Government's National Development Plan. T. G. D. and J. F. C. are supported by SFI (grant nos 02/CE/B124 and 07/CE/B1368). The centre is also funded by GlaxoSmithKline. The SFI-funded Strategic Research Cluster grant no. 07/SRC/B1154 and the Irish Drug Delivery Network also fund B. T. G. and J. F. C.
Glossary
- A→B
apical-to-basolateral permeability
- ABC
ATP-binding cassette
- ACTH
adrenocorticotropic hormone
- B→A
basolateral-to-apical permeability
- BBB
blood–brain barrier
- BCEC
brain capillary endothelial cell
- BCRP
breast cancer resistance protein
- Caco-2
human colorectal adenocarcinoma cells
- cTR
corrected (B→A)/(A→B) transport ratio
- CYP
cytochrome P450
- HPA
axis, hypothalamic-pituitary-adrenal axis
- Km
Michaelis constant
- KO : WT B/P ratio
brain/plasma drug concentration ratios between P-gp-knockout and wild-type mice
- MDCK
Madine-Darby canine kidney cells
- MDCK-MDR1
ABCB1-transfected MDCK cells
- MDR1
multidrug resistance 1 gene
- MRP
multidrug resistance-associated protein
- NBD
nucleotide-binding domain
- P-gp
P-glycoprotein
- SNP
single nucleotide polymorphism
- SNRI
serotonin–norepinephrine reuptake inhibitor
- SSRI
selective serotonin reuptake inhibitor
- STAR*D
Sequenced Treatment Alternatives to Relieve Depression study
- TCA
tricyclic antidepressant
- TR
(B→A)/(A→B) transport ratio
- TRD
treatment-resistant depression
Conflict of interest
The authors declare no conflict of interest exists.
References
- Abbott NJ, Ronnback L, Hansson E. Astrocyte-endothelial interactions at the blood-brain barrier. Nat Rev Neurosci. 2006;7:41–53. doi: 10.1038/nrn1824. [DOI] [PubMed] [Google Scholar]
- Abbott NJ, Patabendige AA, Dolman DE, Yusof SR, Begley DJ. Structure and function of the blood-brain barrier. Neurobiol Dis. 2010;37:13–25. doi: 10.1016/j.nbd.2009.07.030. [DOI] [PubMed] [Google Scholar]
- Aller SG, Yu J, Ward A, Weng Y, Chittaboina S, Zhuo RP, et al. Structure of P-glycoprotein reveals a molecular basis for poly-specific drug binding. Science. 2009;323:1718–1722. doi: 10.1126/science.1168750. [DOI] [PMC free article] [PubMed] [Google Scholar]
- Armulik A, Genove G, Mae M, Nisancioglu MH, Wallgard E, Niaudet C, et al. Pericytes regulate the blood-brain barrier. Nature. 2010;468:557–561. doi: 10.1038/nature09522. [DOI] [PubMed] [Google Scholar]
- Avdeef A. How well can in vitro brain microcapillary endothelial cell models predict rodent in vivo blood-brain barrier permeability? Eur J Pharm Sci. 2011 doi: 10.1016/j.ejps.2011.04.001. doi: 10.1016/j.ejps.2011.1004.1001. [DOI] [PubMed] [Google Scholar]
- Ballabh P, Braun A, Nedergaard M. The blood-brain barrier: an overview: structure, regulation, and clinical implications. Neurobiol Dis. 2004;16:1–13. doi: 10.1016/j.nbd.2003.12.016. [DOI] [PubMed] [Google Scholar]
- Bauer B, Hartz AMS, Fricker G, Miller DS. Pregnane X receptor up-regulation of P-glycoprotein expression and transport function at the blood-brain barrier. Mol Pharmacol. 2004;66:413–419. doi: 10.1124/mol.66.3.. [DOI] [PubMed] [Google Scholar]
- Bauer B, Hartz AMS, Miller DS. Tumor necrosis factor alpha and endothelin-1 increase P-glycoprotein expression and transport activity at the blood-brain barrier. Mol Pharmacol. 2007;71:667–675. doi: 10.1124/mol.106.029512. [DOI] [PubMed] [Google Scholar]
- Bauer B, Hartz AMS, Lucking JR, Yang XD, Pollack GM, Miller DS. Coordinated nuclear receptor regulation of the efflux transporter, Mrp2, and the phase-II metabolizing enzyme, GST pi, at the blood-brain barrier. J Cereb Blood Flow Metab. 2008;28:1222–1234. doi: 10.1038/jcbfm.2008.16. [DOI] [PubMed] [Google Scholar]
- Begley DJ. ABC transporters and the blood-brain barrier. Curr Pharm Des. 2004;10:1295–1312. doi: 10.2174/1381612043384844. [DOI] [PubMed] [Google Scholar]
- Benet LZ. The drug transporter-metabolism alliance: uncovering and defining the interplay. Mol Pharm. 2009;6:1631–1643. doi: 10.1021/mp900253n. [DOI] [PMC free article] [PubMed] [Google Scholar]
- Bolo NR, Hode Y, Nedelec JF, Laine E, Wagner G, Macher JP. Brain pharmacokinetics and tissue distribution in vivo of fluvoxamine and fluoxetine by fluorine magnetic resonance spectroscopy. Neuropsychopharmacology. 2000;23:428–438. doi: 10.1016/S0893-133X(00)00116-0. [DOI] [PubMed] [Google Scholar]
- Brightman MW, Reese TS. Junctions between intimately apposed cell membranes in vertebrate brain. J Cell Biol. 1969;40:648–677. doi: 10.1083/jcb.40.3.648. [DOI] [PMC free article] [PubMed] [Google Scholar]
- Carroll BJ. Clinical-applications of the dexamethasone suppression test for endogenous-depression. Pharmacopsychiatria. 1982a;15:19–24. doi: 10.1055/s-2007-1019504. [DOI] [PubMed] [Google Scholar]
- Carroll BJ. The dexamethasone suppression test for melancholia. Br J Psychiat. 1982b;140:292–304. doi: 10.1192/bjp.140.3.292. [DOI] [PubMed] [Google Scholar]
- Carroll BJ, Cassidy F, Naftolowitz D, Tatham NE, Wilson WH, Iranmanesh A, et al. Pathophysiology of hypercortisolism in depression. Acta Psychiatr Scand. 2007;115:90–103. doi: 10.1111/j.1600-0447.2007.00967.x. [DOI] [PubMed] [Google Scholar]
- Cascorbi I. Role of pharmacogenetics of ATP-binding cassette transporters in the pharmacokinetics of drugs. Pharmacol Ther. 2006;112:457–473. doi: 10.1016/j.pharmthera.2006.04.009. [DOI] [PubMed] [Google Scholar]
- Cascorbi I, Gerloff T, Johne A, Meisel C, Hoffmeyer S, Schwab M, et al. Frequency of single nucleotide polymorphisms in the P-glycoprotein drug transporter MDR1 gene in white subjects. Clin Pharmacol Ther. 2001;69:169–174. doi: 10.1067/mcp.2001.114164. [DOI] [PubMed] [Google Scholar]
- Chanock SJ, Manolio T, Boehnke M, Boerwinkle E, Hunter DJ, Thomas G, et al. Replicating genotype-phenotype associations. Nature. 2007;447:655–660. doi: 10.1038/447655a. [DOI] [PubMed] [Google Scholar]
- Cipriani A, Furukawa TA, Salanti G, Geddes JR, Higgins JPT, Churchill R, et al. Comparative efficacy and acceptability of 12 new-generation antidepressants: a multiple-treatments meta-analysis. Lancet. 2009;373:746–758. doi: 10.1016/S0140-6736(09)60046-5. [DOI] [PubMed] [Google Scholar]
- Cisternino S, Mercier C, Bourasset F, Roux F, Scherrmann JM. Expression, up-regulation, and transport activity of the multidrug-resistance protein ABCG2 at the mouse blood-brain barrier. Cancer Res. 2004;64:3296–3301. doi: 10.1158/0008-5472.can-03-2033. [DOI] [PubMed] [Google Scholar]
- Clarke G, O'Mahony SM, Cryan JF, Dinan TG. Verapamil in treatment resistant depression: a role for the P-glycoprotein transporter? Hum Psychopharmacol. 2009;24:217–223. doi: 10.1002/hup.1008. [DOI] [PubMed] [Google Scholar]
- Colabufo NA, Berardi F, Cantore M, Contino M, Inglese C, Niso M, et al. Perspectives of P-glycoprotein modulating agents in oncology and neurodegenerative diseases: pharmaceutical, biological, and diagnostic potentials. J Med Chem. 2010;53:1883–1897. doi: 10.1021/jm900743c. [DOI] [PubMed] [Google Scholar]
- Cordoncardo C, O'Brien JP, Casals D, Rittmangrauer L, Biedler JL, Melamed MR, et al. Multidrug-resistance gene (P-glycoprotein) is expressed by endothelial-cells at blood-brain barrier sites. Proc Natl Acad Sci U S A. 1989;86:695–698. doi: 10.1073/pnas.86.2.695. [DOI] [PMC free article] [PubMed] [Google Scholar]
- Cryan JF, Holmes A. The ascent of mouse: advances in modelling human depression and anxiety. Nat Rev Drug Discov. 2005;4:775–790. doi: 10.1038/nrd1825. [DOI] [PubMed] [Google Scholar]
- Cryan JF, Leonard BE, editors. Depression: From Psychopathology to Pharmacotherapy. Basel: Karger; 2010. [Google Scholar]
- Dauchy S, Dutheil F, Weaver RJ, Chassoux F, Daumas-Duport C, Couraud PO, et al. ABC transporters, cytochromes P450 and their main transcription factors: expression at the human blood-brain barrier. J Neurochem. 2008;107:1518–1528. doi: 10.1111/j.1471-4159.2008.05720.x. [DOI] [PubMed] [Google Scholar]
- De Luca V, Mundo E, Trakalo J, Wong GWH, Kennedy JL. Investigation of polymorphism in the MDR1 gene and antidepressant-induced mania. Pharmacogenomics J. 2003;3:297–299. doi: 10.1038/sj.tpj.6500196. [DOI] [PubMed] [Google Scholar]
- Devault A, Gros P. Two members of the mouse mdr gene family confer multidrug resistance with overlapping but distinct drug specificities. Mol Cell Biol. 1990;10:1652–1663. doi: 10.1128/mcb.10.4.1652. [DOI] [PMC free article] [PubMed] [Google Scholar]
- Dinan TG. Inflammatory markers in depression. Curr Opin Psychiatry. 2009;22:32–36. doi: 10.1097/YCO.0b013e328315a561. [DOI] [PubMed] [Google Scholar]
- Doran A, Obach RS, Smith BJ, Hosea NA, Becker S, Callegari E, et al. The impact of P-glycoprotein on the disposition of drugs targeted for indications of the central nervous system: evaluation using the MDR1A/1B knockout mouse model. Drug Metab Dispos. 2005;33:165–174. doi: 10.1124/dmd.104.001230. [DOI] [PubMed] [Google Scholar]
- Dutheil F, Dauchy S, Diry M, Sazdovitch V, Cloarec O, Mellottée L, et al. Xenobiotic-metabolizing enzymes and transporters in the normal human brain: regional and cellular mapping as a basis for putative roles in cerebral function. Drug Metab Dispos. 2009;37:1528–1538. doi: 10.1124/dmd.109.027011. [DOI] [PubMed] [Google Scholar]
- Ebinger M, Uhr M. ABC drug transporter at the blood-brain barrier – effects on drug metabolism and drug response. Eur Arch Psychiatry Clin Neurosci. 2006;256:294–298. doi: 10.1007/s00406-006-0664-4. [DOI] [PubMed] [Google Scholar]
- Eckford PDW, Sharom FJ. ABC efflux pump-based resistance to chemotherapy drugs. Chem Rev. 2009;109:2989–3011. doi: 10.1021/cr9000226. [DOI] [PubMed] [Google Scholar]
- Ehret MJ, Levin GA, Narasimhan M, Rathinavelu A. Venlafaxine induces P-glycoprotein in human Caco-2 cells. Hum Psychopharmacol. 2007;22:49–53. doi: 10.1002/hup.820. [DOI] [PubMed] [Google Scholar]
- Ejsing TB, Linnet K. Influence of P-glycoprotein inhibition on the distribution of the tricyclic antidepressant nortriptyline over the blood-brain barrier. Hum Psychopharmacol. 2005;20:149–153. doi: 10.1002/hup.667. [DOI] [PubMed] [Google Scholar]
- Ejsing TB, Hasselstrom J, Linnet K. The influence of P-glycoprotein on cerebral and hepatic concentrations of nortriptyline and its metabolites. Drug Metabol Drug Interact. 2006;21:139–162. doi: 10.1515/dmdi.2006.21.3-4.139. [DOI] [PubMed] [Google Scholar]
- El Ela AA, Hartter S, Schmitt U, Hiemke C, Spahn-Langguth H, Langguth P. Identification of P-glycoprotein substrates and inhibitors among psychoactive compounds – implications for pharmaccokinetics of selected substrates. J Pharm Pharmacol. 2004;56:967–975. doi: 10.1211/0022357043969. [DOI] [PubMed] [Google Scholar]
- Eyal S, Hsiao P, Unadkat JD. Drug interactions at the blood-brain barrier: fact or fantasy? Pharmacol Ther. 2009;123:80–104. doi: 10.1016/j.pharmthera.2009.03.017. [DOI] [PMC free article] [PubMed] [Google Scholar]
- Fava M. Diagnosis and definition of treatment-resistant depression. Biol Psychiatry. 2003;53:649–659. doi: 10.1016/s0006-3223(03)00231-2. [DOI] [PubMed] [Google Scholar]
- Feng B, Mills JB, Davidson RE, Mireles RJ, Janiszewski JS, Troutman MD, et al. In vitro P-glycoprotein assays to predict the in vivo interactions of P-glycoprotein with drugs in the central nervous system. Drug Metab Dispos. 2008;36:268–275. doi: 10.1124/dmd.107.017434. [DOI] [PubMed] [Google Scholar]
- Fukui N, Suzuki Y, Sawamura K, Sugai T, Watanabe J, Inoue Y, et al. Dose-dependent effects of the 3435 C >T genotype of ABCB1 gene on the steady-state plasma concentration of fluvoxamine in psychiatric patients. Ther Drug Monit. 2007;29:185–189. doi: 10.1097/FTD.0b013e318038d835. [DOI] [PubMed] [Google Scholar]
- Gex-Fabry M, Eap CB, Oneda B, Gervasoni N, Aubry JM, Bondolfi G, et al. CYP2D6 and ABCB1 genetic variability: influence on paroxetine plasma level and therapeutic response. Ther Drug Monit. 2008;30:474–482. doi: 10.1097/FTD.0b013e31817d6f5d. [DOI] [PubMed] [Google Scholar]
- Ghersi-Egea JF, Leninger-Muller B, Suleman G, Siest G, Minn A. Localization of drug-metabolizing enzyme-activities to blood-brain interfaces and circumventricular organs. J Neurochem. 1994;62:1089–1096. doi: 10.1046/j.1471-4159.1994.62031089.x. [DOI] [PubMed] [Google Scholar]
- Gottesman MM, Fojo T, Bates SE. Multidrug resistance in cancer: role of ATP-dependent transporters. Nat Rev Cancer. 2002;2:48–58. doi: 10.1038/nrc706. [DOI] [PubMed] [Google Scholar]
- Grauer MT, Uhr M. P-glycoprotein reduces the ability of amitriptyline metabolites to cross the blood brain barrier in mice after a 10-day administration of amitriptyline. J Psychopharmacol. 2004;18:66–74. doi: 10.1177/0269881104042831. [DOI] [PubMed] [Google Scholar]
- Halbreich U, Asnis GM, Shindledecker R, Zumoff B, Nathan RS. Cortisol secretion in endogenous-depression .1. basal plasma-levels. Arch Gen Psychiatry. 1985;42:904–908. doi: 10.1001/archpsyc.1985.01790320076010. [DOI] [PubMed] [Google Scholar]
- Hawkins BT, Davis TP. The blood-brain barrier/neurovascular unit in health and disease. Pharmacol Rev. 2005;57:173–185. doi: 10.1124/pr.57.2.4. [DOI] [PubMed] [Google Scholar]
- Hayashi Y, Nomura M, Yamagishi SI, Harada SI, Yamashita J, Yamamoto H. Induction of various blood-brain barrier properties in non-neural endothelial cells by close apposition to co-cultured astrocytes. Glia. 1997;19:13–26. [PubMed] [Google Scholar]
- Hermann DM, Bassetti CL. Implications of ATP-binding cassette transporters for brain pharmacotherapies. Trends Pharmacol Sci. 2007;28:128–134. doi: 10.1016/j.tips.2007.01.007. [DOI] [PubMed] [Google Scholar]
- Herr AS, Tsolakidou AF, Yassouridis A, Holsboer F, Rein T. Antidepressants differentially influence the transcriptional activity of the glucocorticoid receptor in vitro. Neuroendocrinology. 2003;78:12–22. doi: 10.1159/000071701. [DOI] [PubMed] [Google Scholar]
- Hoffmeyer S, Burk O, von Richter O, Arnold HP, Brockmoller J, Johne A, et al. Functional polymorphisms of the human multidrug-resistance gene: multiple sequence variations and correlation of one allele with P-glycoprotein expression and activity in vivo. Proc Natl Acad Sci U S A. 2000;97:3473–3478. doi: 10.1073/pnas.050585397. [DOI] [PMC free article] [PubMed] [Google Scholar]
- Holsboer F. The corticosteroid receptor hypothesis of depression. Neuropsychopharmacology. 2000;23:477–501. doi: 10.1016/S0893-133X(00)00159-7. [DOI] [PubMed] [Google Scholar]
- Holthoewer D, Hiemke C, Schmitt U. Induction of drug transporters alters disposition of risperidone – a study in mice. Pharmaceutics. 2010;2:258–274. doi: 10.3390/pharmaceutics2020258. [DOI] [PMC free article] [PubMed] [Google Scholar]
- Ibrahim S, Peggins J, Knapton A, Licht T, Aszalos A. Influence of antipsychotic, antiemetic, and Ca(2+) channel blocker drugs on the cellular accumulation of the anticancer drug daunorubicin: P-glycoprotein modulation. J Pharmacol Exp Ther. 2000;295:1276–1283. [PubMed] [Google Scholar]
- Ising M, Lucae S, Binder EB, Bettecken T, Uhr M, Ripke S, et al. A genomewide association study points to multiple loci that predict antidepressant drug treatment outcome in depression. Arch Gen Psychiatry. 2009;66:966–975. doi: 10.1001/archgenpsychiatry.2009.95. [DOI] [PMC free article] [PubMed] [Google Scholar]
- Ito S, Ieiri I, Tanabe M, Suzuki A, Higuchi S, Otsubo K. Polymorphism of the ABC transporter genes, MDR1, MRP1 and MRP2/cMOAT, in healthy Japanese subjects. Pharmacogenetics. 2001;11:175–184. doi: 10.1097/00008571-200103000-00008. [DOI] [PubMed] [Google Scholar]
- Jaffrezou JP, Chen G, Duran GE, Muller C, Bordier C, Laurent G, et al. Inhibition of lysosomal acid sphingomyelinase by agents which reverse multidrug-resistance. Biochim Biophys Acta. 1995;1266:1–8. doi: 10.1016/0167-4889(94)00219-5. [DOI] [PubMed] [Google Scholar]
- Janzer RC, Raff MC. Astrocytes induce blood-brain barrier properties in endothelial cells. Nature. 1987;325:253–257. doi: 10.1038/325253a0. [DOI] [PubMed] [Google Scholar]
- Johne A, Kopke K, Gerloff T, Mai I, Rietbrock S, Meisel C, et al. Modulation of steady-state kinetics of digoxin by haplotypes of the P-glycoprotein MDR1 gene. Clin Pharmacol Ther. 2002;72:584–594. doi: 10.1067/mcp.2002.129196. [DOI] [PubMed] [Google Scholar]
- Juliano RL, Ling V. Surface glycoprotein modulating drug permeability in chinese-hamster ovary cell mutants. Biochim Biophys Acta. 1976;455:152–162. doi: 10.1016/0005-2736(76)90160-7. [DOI] [PubMed] [Google Scholar]
- Julio-Pieper M, Dinan TG. The hypothalamic-pituitary-adrenal axis in depression. In: Cryan JF, Leonard BE, editors. Depression: From Psychopathology to Pharmacotherapy. Basel: Karger Press; 2010. pp. 20–31. [Google Scholar]
- Kalvass JC, Pollack GM. Kinetic considerations for the quantitative assessment of efflux activity and inhibition: implications for understanding and predicting the effects of efflux inhibition. Pharm Res. 2007;24:265–276. doi: 10.1007/s11095-006-9135-x. [DOI] [PubMed] [Google Scholar]
- Kannan P, John C, Zoghbi SS, Halldin C, Gottesman MM, Innis RB, et al. Imaging the function of p-glycoprotein with radiotracers: pharmacokinetics and in vivo applications. Clin Pharmacol Ther. 2009;86:368–377. doi: 10.1038/clpt.2009.138. [DOI] [PMC free article] [PubMed] [Google Scholar]
- Karlsson L, Schmitt U, Josefsson M, Carlsson B, Ahlner J, Bengtsson F, et al. Blood-brain barrier penetration of the enantiomers of venlafaxine and its metabolites in mice lacking P-glycoprotein. Eur Neuropsychopharmacol. 2010;20:632–640. doi: 10.1016/j.euroneuro.2010.04.004. [DOI] [PubMed] [Google Scholar]
- Karlsson L, Hiemke C, Carlsson B, Josefsson M, Ahlner J, Bengtsson F, et al. Effects on enantiomeric drug disposition and open-field behavior after chronic treatment with venlafaxine in the P-glycoprotein knockout mice model. Psychopharmacology (Berl) 2011;215:367–377. doi: 10.1007/s00213-010-2148-5. [DOI] [PubMed] [Google Scholar]
- Karssen AM, Meijer OC, van der Sandt ICJ, Lucassen PJ, de Lange ECM, de Boer AG, et al. Multidrug resistance P-glycoprotein hampers the access of cortisol but not of corticosterone to mouse and human brain. Endocrinology. 2001;142:2686–2694. doi: 10.1210/endo.142.6.8213. [DOI] [PubMed] [Google Scholar]
- Karssen AM, Meijer OC, van der Sandt ICJ, De Boer AG, De Lange ECM, De Kloet ER. The role of the efflux transporter P-glycoprotein in brain penetration of prednisolone. J Endocrinol. 2002;175:251–260. doi: 10.1677/joe.0.1750251. [DOI] [PubMed] [Google Scholar]
- Karssen AM, Meijer OC, Pons D, De Kloet ER. Localization of mRNA expression of P-glycoprotein at the blood-brain barrier and in the hippocampus. Ann N Y Acad Sci. 2004;1032:308–311. doi: 10.1196/annals.1314.048. [DOI] [PubMed] [Google Scholar]
- Kato M, Fukuda T, Serretti A, Wakeno M, Okugawa G, Ikenaga Y, et al. ABCB1 (MDR1) gene polymorphisms are associated with the clinical response to paroxetine in patients with major depressive disorder. Prog Neuropsychopharmacol. 2008;32:398–404. doi: 10.1016/j.pnpbp.2007.09.003. [DOI] [PubMed] [Google Scholar]
- Kim RB, Leake BF, Choo EF, Dresser GK, Kubba SV, Schwarz UI, et al. Identification of functionally variant MDR1 alleles among European Americans and African Americans. Clin Pharmacol Ther. 2001;70:189–199. doi: 10.1067/mcp.2001.117412. [DOI] [PubMed] [Google Scholar]
- Kimchi-Sarfaty C, Oh JM, Kim IW, Sauna ZE, Calcagno AM, Ambudkar SV, et al. A ‘silent’ polymorphism in the MDR1 gene changes substrate specificity. Science. 2007;315:525–528. doi: 10.1126/science.1135308. [DOI] [PubMed] [Google Scholar]
- Kirschbaum KM, Henken S, Hiemke C, Schmitt U. Pharmacodynamic consequences of P-glycoprotein-dependent pharmacokinetics of risperidone and haloperidol in mice. Behav Brain Res. 2008;188:298–303. doi: 10.1016/j.bbr.2007.11.009. [DOI] [PubMed] [Google Scholar]
- de Klerk OL, Willemsen ATM, Roosink M, Bartels AL, Hendrikse NH, Bosker FJ, et al. Locally increased P-glycoprotein function in major depression: a PET study with [C-11]verapamil as a probe for P-glycoprotein function in the blood-brain barrier. Int J Neuropsychopharmacol. 2009;12:895–904. doi: 10.1017/S1461145709009894. [DOI] [PubMed] [Google Scholar]
- de Klerk OL, Bosker FJ, Willemsen AT, Van Waarde A, Visser AK, de Jager T, et al. Chronic stress and antidepressant treatment have opposite effects on P-glycoprotein at the blood-brain barrier: an experimental PET study in rats. J Psychopharmacol. 2010;24:1237–1242. doi: 10.1177/0269881109349840. [DOI] [PubMed] [Google Scholar]
- Kraft P. Curses-winner's and otherwise-in genetic epidemiology. Epidemiology. 2008;19:649–651. doi: 10.1097/EDE.0b013e318181b865. [DOI] [PubMed] [Google Scholar]
- Kunzel HE, Binder EB, Nickel T, Ising M, Fuchs B, Majer M, et al. Pharmacological and nonpharmacological factors influencing hypothalamic-pituitary-adrenocortical axis reactivity in acutely depressed psychiatric in-patients, measured by the Dex-CRH test. Neuropsychopharmacology. 2003;28:2169–2178. doi: 10.1038/sj.npp.1300280. [DOI] [PubMed] [Google Scholar]
- Kuteykin-Teplyakov K, Luna-Tortos C, Ambroziak K, Loscher W. Differences in the expression of endogenous efflux transporters in MDR1-transfected versus wildtype cell lines affect P-glycoprotein mediated drug transport. Br J Pharmacol. 2010;160:1453–1463. doi: 10.1111/j.1476-5381.2010.00801.x. [DOI] [PMC free article] [PubMed] [Google Scholar]
- Laika B, Leucht S, Steimer W. ABCB1 (P-Glycoprotein/MDR1) Gene G2677T/A Sequence Variation (Polymorphism): lack of association with side effects and therapeutic response in depressed inpatients treated with amitriptyline. Clin Chem. 2006;52:893–895. doi: 10.1373/clinchem.2006.066605. [DOI] [PubMed] [Google Scholar]
- Lazarowski A, Caltana L, Merelli A, Rubio MD, Ramos AJ, Brusco A. Neuronal mdr-1 gene expression after experimental focal hypoxia: a new obstacle for neuroprotection? J Neurol Sci. 2007;258:84–92. doi: 10.1016/j.jns.2007.03.004. [DOI] [PubMed] [Google Scholar]
- Lee SH, Lee MS, Lee JH, Kim SW, Kang RH, Choi MJ, et al. MRP1 polymorphisms associated with citalopram response in patients with major depression. J Clin Psychopharmacol. 2010;30:116–125. doi: 10.1097/JCP.0b013e3181d2ef42. [DOI] [PubMed] [Google Scholar]
- Lin JH. Transporter-mediated drug interactions: clinical implications and in vitro assessment. Expert Opin Drug Metab. 2007;3:81–92. doi: 10.1517/17425255.3.1.81. [DOI] [PubMed] [Google Scholar]
- Lin KM, Chiu YF, Tsai IJ, Chen CH, Shen WW, Liu SC, et al. ABCB1 gene polymorphisms are associated with the severity of major depressive disorder and its response to escitalopram treatment. Pharmacogenet Genomics. 2011;21:163–170. doi: 10.1097/FPC.0b013e32833db216. [DOI] [PubMed] [Google Scholar]
- Liptrott NJ, Penny M, Bray PG, Sathish J, Khoo SH, Back DJ, et al. The impact of cytokines on the expression of drug transporters, cytochrome P450 enzymes and chemokine receptors in human PBMC. Br J Pharmacol. 2009;156:497–508. doi: 10.1111/j.1476-5381.2008.00050.x. [DOI] [PMC free article] [PubMed] [Google Scholar]
- Litman T, Druley TE, Stein WD, Bates SE. From MDR to MXR: new understanding of multidrug resistance systems, their properties and clinical significance. Cell Mol Life Sci. 2001;58:931–959. doi: 10.1007/PL00000912. [DOI] [PMC free article] [PubMed] [Google Scholar]
- Loscher W, Potschka H. Drug resistance in brain diseases and the role of drug efflux transporters. Nat Rev Neurosci. 2005;6:591–602. doi: 10.1038/nrn1728. [DOI] [PubMed] [Google Scholar]
- Maines LW, Antonetti DA, Wolpert EB, Smith CD. Evaluation of the role of P-glycoprotein in the uptake of paroxetine, clozapine, phenytoin and carbamazapine by bovine retinal endothelial cells. Neuropharmacology. 2005;49:610–617. doi: 10.1016/j.neuropharm.2005.04.028. [DOI] [PubMed] [Google Scholar]
- Mason BL, Pariante CM, Thomas SA. A revised role for P-glycoprotein in the brain distribution of dexamethasone, cortisol, and corticosterone in wild-type and ABCB1A/B-deficient mice. Endocrinology. 2008;149:5244–5253. doi: 10.1210/en.2008-0041. [DOI] [PMC free article] [PubMed] [Google Scholar]
- Mason BL, Pariante CM, Jamel S, Thomas SA. Central nervous system (CNS) delivery of glucocorticoids is fine-tuned by saturable transporters at the blood-CNS barriers and nonbarrier regions. Endocrinology. 2010;151:5294–5305. doi: 10.1210/en.2010-0554. [DOI] [PMC free article] [PubMed] [Google Scholar]
- Mason BL, Thomas SA, Lightman SL, Pariante CM. Desipramine treatment has minimal effects on the brain accumulation of glucocorticoids in P-gp-deficient and wild-type mice. Psychoneuroendocrinology. 2011 doi: 10.1016/j.psyneuen.2011.03.008. doi: 10.1016/j.psyneuen.2011.1003.1008. [DOI] [PMC free article] [PubMed] [Google Scholar]
- Meijer OC, de Lange ECM, Breimer DD, de Boer AG, Workel JO, de Kloet ER. Penetration of dexamethasone into brain glucocorticoid targets is enhanced in mdr1A P-glycoprotein knockout mice. Endocrinology. 1998;139:1789–1793. doi: 10.1210/endo.139.4.5917. [DOI] [PubMed] [Google Scholar]
- Merry S, Hamilton TG, Flanigan P, Freshney RI, Kaye SB. Circumvention of pleiotropic drug resistance in subcutaneous tumours in vivo with verapamil and clomipramine. Eur J Cancer. 1991;27:31–34. doi: 10.1016/0277-5379(91)90054-h. [DOI] [PubMed] [Google Scholar]
- Mihaljevic Peles A, Bozina N, Sagud M, Rojnic Kuzman M, Lovric M. MDR1 gene polymorphism: therapeutic response to paroxetine among patients with major depression. Prog Neuropsychopharmacol Biol Psychiatry. 2008;32:1439–1444. doi: 10.1016/j.pnpbp.2008.03.018. [DOI] [PubMed] [Google Scholar]
- Miller DS. Regulation of P-glycoprotein and other ABC drug transporters at the blood-brain barrier. Trends Pharmacol Sci. 2010;31:246–254. doi: 10.1016/j.tips.2010.03.003. [DOI] [PMC free article] [PubMed] [Google Scholar]
- Muller MB, Keck ME, Binder EB, Kresse AE, Hagemeyer TP, Landgraf R, et al. ABCB1 (MDR1)-Type P-glycoproteins at the blood-brain barrier modulate the activity of the hypothalamic-pituitary-adrenocortical system: implications for affective disorder. Neuropsychopharmacology. 2003;28:1991–1999. doi: 10.1038/sj.npp.1300257. [DOI] [PubMed] [Google Scholar]
- Narang VS, Fraga C, Kumar N, Shen J, Throm S, Stewart CF, et al. Dexamethasone increases expression and activity of multidrug resistance transporters at the rat blood-brain barrier. Am J Physiol Cell Physiol. 2008;295:C440–C450. doi: 10.1152/ajpcell.00491.2007. [DOI] [PMC free article] [PubMed] [Google Scholar]
- Neuwelt E, Abbott N, Abrey L, Banks WA, Blakley B, Davis T, et al. Strategies to advance translational research into brain barriers. Lancet Neurol. 2008;7:84–96. doi: 10.1016/S1474-4422(07)70326-5. [DOI] [PubMed] [Google Scholar]
- Neuwelt EA, Bauer B, Fahlke C, Fricker G, Iadecola C, Janigro D, et al. Engaging neuroscience to advance translational research in brain barrier biology. Nat Rev Neurosci. 2011;12:169–182. doi: 10.1038/nrn2995. [DOI] [PMC free article] [PubMed] [Google Scholar]
- Nies AT. The role of membrane transporters in drug delivery to brain tumors. Cancer Lett. 2007;254:11–29. doi: 10.1016/j.canlet.2006.12.023. [DOI] [PubMed] [Google Scholar]
- Nikisch G, Eap CB, Baumann P. Citalopram enantiomers in plasma and cerebrospinal fluid of ABCB1 genotyped depressive patients and clinical response: a pilot study. Pharmacol Res. 2008;58:344–347. doi: 10.1016/j.phrs.2008.09.010. [DOI] [PubMed] [Google Scholar]
- Pardridge WM. The blood-brain barrier: bottleneck in brain drug development. NeuroRx. 2005;2:3–14. doi: 10.1602/neurorx.2.1.3. [DOI] [PMC free article] [PubMed] [Google Scholar]
- Pardridge WM. Blood-brain barrier delivery. Drug Discov Today. 2007;12:54–61. doi: 10.1016/j.drudis.2006.10.013. [DOI] [PubMed] [Google Scholar]
- Pariante CM. The role of multi-drug resistance p-glycoprotein in glucocorticoid function: studies in animals and relevance in humans. Eur J Pharmacol. 2008;583:263–271. doi: 10.1016/j.ejphar.2007.11.067. [DOI] [PubMed] [Google Scholar]
- Pariante CM, Lightman SL. The HPA axis in major depression: classical theories and new developments. Trends Neurosci. 2008;31:464–468. doi: 10.1016/j.tins.2008.06.006. [DOI] [PubMed] [Google Scholar]
- Pariante CM, Pearce BD, Pisell TL, Owens MJ, Miller AH. Steroid-independent translocation of the glucocorticoid receptor by the antidepressant desipramine. Mol Pharmacol. 1997;52:571–581. doi: 10.1124/mol.52.4.571. [DOI] [PubMed] [Google Scholar]
- Pariante CM, Makoff A, Lovestone S, Feroli S, Heyden A, Miller AH, et al. Antidepressants enhance glucocorticoid receptor function in vitro by modulating the membrane steroid transporters. Br J Pharmacol. 2001;134:1335–1343. doi: 10.1038/sj.bjp.0704368. [DOI] [PMC free article] [PubMed] [Google Scholar]
- Pariante CM, Hye A, Williamson R, Makoff A, Lovestone S, Kerwin RW. The antidepressant clomipramine regulates cortisol intracellular concentrations and glucocorticoid receptor expression in fibroblasts and rat primary neurones. Neuropsychopharmacology. 2003a;28:1553–1561. doi: 10.1038/sj.npp.1300195. [DOI] [PubMed] [Google Scholar]
- Pariante CM, Kim RB, Makoff A, Kerwin RW. Antidepressant fluoxetine enhances glucocorticoid receptor function in vitro by modulating membrane steroid transporters. Br J Pharmacol. 2003b;139:1111–1118. doi: 10.1038/sj.bjp.0705357. [DOI] [PMC free article] [PubMed] [Google Scholar]
- Pariante CM, Thomas SA, Lovestone S, Makoff A, Kerwin RW. Do antidepressants regulate how cortisol affects the brain? Psychoneuroendocrinology. 2004;29:423–447. doi: 10.1016/j.psyneuen.2003.10.009. [DOI] [PubMed] [Google Scholar]
- Pauwels EKJ, Erba P, Mariani G, Gomes CMF. Multidrug resistance in cancer: its mechanism and its modulation. Drug News Perspect. 2007;20:371–377. doi: 10.1358/dnp.2007.20.6.1141496. [DOI] [PubMed] [Google Scholar]
- Perlis RH, Fijal B, Dharia S, Heinloth AN, Houston JP. Failure to replicate genetic associations with antidepressant treatment response in duloxetine-treated patients. Biol Psychiatry. 2010;67:1110–1113. doi: 10.1016/j.biopsych.2009.12.010. [DOI] [PubMed] [Google Scholar]
- Peters EJ, Slager SL, Kraft JB, Jenkins GD, Reinalda MS, McGrath PJ, et al. Pharmacokinetic genes do not influence response or tolerance to citalopram in the STAR*D sample. PLoS ONE. 2008;3:e1872. doi: 10.1371/journal.pone.0001872. [DOI] [PMC free article] [PubMed] [Google Scholar]
- Peters EJ, Reus V, Hamilton SP. The ABCB1 transporter gene and antidepressant response. F1000 Biol Rep. 2009;1:23. doi: 10.3410/B1-23. [DOI] [PMC free article] [PubMed] [Google Scholar]
- Philip NS, Carpenter LL, Tyrka AR, Price LH. Pharmacologic approaches to treatment resistant depression: a re-examination for the modern era. Expert Opin Pharmacother. 2010;11:709–722. doi: 10.1517/14656561003614781. [DOI] [PMC free article] [PubMed] [Google Scholar]
- Polli JW, Wring SA, Humphreys JE, Huang L, Morgan JB, Webster LO, et al. Rational use of in vitro p-glycoprotein assays in drug discovery. J Pharmacol Exp Ther. 2001;299:620–628. [PubMed] [Google Scholar]
- Reese TS, Karnovsky MJ. Fine structural localization of a blood-brain barrier to exogenous peroxidase. J Cell Biol. 1967;34:207–217. doi: 10.1083/jcb.34.1.207. [DOI] [PMC free article] [PubMed] [Google Scholar]
- von Richter O, Glavinas H, Krajcsi P, Liehner S, Siewert B, Zech K. A novel screening strategy to identify ABCB1 substrates and inhibitors. Naunyn Schmiedebergs Arch Pharmacol. 2009;379:11–26. doi: 10.1007/s00210-008-0345-0. [DOI] [PubMed] [Google Scholar]
- Roberts RL, Joyce PR, Mulder RT, Begg EJ, Kennedy MA. A common P-glycoprotein polymorphism is associated with nortriptyline-induced postural hypotension in patients treated for major depression. Pharmacogenomics J. 2002;2:191–196. doi: 10.1038/sj.tpj.6500099. [DOI] [PubMed] [Google Scholar]
- Rochat B, Baumann P, Audus KL. Transport mechanisms for the antidepressant citalopram in brain microvessel endothelium. Brain Res. 1999;831:229–236. doi: 10.1016/s0006-8993(99)01461-4. [DOI] [PubMed] [Google Scholar]
- Romsicki Y, Sharom FJ. The membrane lipid environment modulates drug interactions with the P-glycoprotein multidrug transporter. Biochemistry. 1999;38:6887–6896. doi: 10.1021/bi990064q. [DOI] [PubMed] [Google Scholar]
- Rush AJ, Trivedi MH, Wisniewski SR, Nierenberg AA, Stewart JW, Warden D, et al. Acute and longer-term outcomes in depressed outpatients requiring one or several treatment steps: a STAR*D report. Am J Psychiatry. 2006;163:1905–1917. doi: 10.1176/ajp.2006.163.11.1905. [DOI] [PubMed] [Google Scholar]
- Sakurai A, Onishi Y, Hirano H, Seigneuret M, Obanayama K, Kim G, et al. Quantitative structure–activity relationship analysis and molecular dynamics simulation to functionally validate nonsynonymous polymorphisms of human ABC transporter ABCB1 (P-glycoprotein/MDR1) Biochemistry. 2007;46:7678–7693. doi: 10.1021/bi700330b. [DOI] [PubMed] [Google Scholar]
- Salama NN, Yang ZP, Bui T, Ho RJY. MDR1 haplotypes significantly minimize intracellular uptake and transcellular P-gp substrate transport in recombinant LLC-PK1 cells. J Pharm Sci. 2006;95:2293–2308. doi: 10.1002/jps.20717. [DOI] [PubMed] [Google Scholar]
- Sarginson JE, Lazzeroni LC, Ryan HS, Ershoff BD, Schatzberg AF, Murphy GM. ABCB1 (MDR1) polymorphisms and antidepressant response in geriatric depression. Pharmacogenet Genomics. 2010;20:467–475. doi: 10.1097/FPC.0b013e32833b593a. [DOI] [PubMed] [Google Scholar]
- Sarkadi B, Price EM, Boucher RC, Germann UA, Scarborough GA. Expression of the human multidrug resistance cDNA in insect cells generates a high activity drug-stimulated membrane ATPase. J Biol Chem. 1992;267:4854–4858. [PubMed] [Google Scholar]
- Schiepers OJG, Wichers MC, Maes M. Cytokines and major depression. Prog Neuropsychopharmacol. 2005;29:201–217. doi: 10.1016/j.pnpbp.2004.11.003. [DOI] [PubMed] [Google Scholar]
- Schinkel AH. P-Glycoprotein, a gatekeeper in the blood-brain barrier. Adv Drug Deliv Rev. 1999;36:179–194. doi: 10.1016/s0169-409x(98)00085-4. [DOI] [PubMed] [Google Scholar]
- Schinkel AH, Smit JJM, Vantellingen O, Beijnen JH, Wagenaar E, Vandeemter L, et al. Disruption of the mouse Mdr1a P-glycoprotein gene leads to a deficiency in the blood-brain-barrier and to increased sensitivity to drugs. Cell. 1994;77:491–502. doi: 10.1016/0092-8674(94)90212-7. [DOI] [PubMed] [Google Scholar]
- Schinkel AH, Wagenaar E, van Deemter L, Mol CA, Borst P. Absence of the mdr1a P-Glycoprotein in mice affects tissue distribution and pharmacokinetics of dexamethasone, digoxin, and cyclosporin A. J Clin Invest. 1995;96:1698–1705. doi: 10.1172/JCI118214. [DOI] [PMC free article] [PubMed] [Google Scholar]
- Schinkel AH, Mayer U, Wagenaar E, Mol CAAM, vanDeemter L, Smit JJM, et al. Normal viability and altered pharmacokinetics in mice lacking mdr1-type (drug-transporting) P-glycoproteins. Proc Natl Acad Sci U S A. 1997;94:4028–4033. doi: 10.1073/pnas.94.8.4028. [DOI] [PMC free article] [PubMed] [Google Scholar]
- Schwab D, Fischer H, Tabatabaei A, Poli S, Huwyler J. Comparison of in vitro P-glycoprotein screening assays: recommendations for their use in drug discovery. J Med Chem. 2003;46:1716–1725. doi: 10.1021/jm021012t. [DOI] [PubMed] [Google Scholar]
- Shapiro AB, Ling V. Extraction of Hoechst 33342 from the cytoplasmic leaflet of the plasma membrane by P-glycoprotein. Eur J Biochem. 1997;250:122–129. doi: 10.1111/j.1432-1033.1997.00122.x. [DOI] [PubMed] [Google Scholar]
- Sharom FJ. ABC multidrug transporters: structure, function and role in chemoresistance. Pharmacogenomics. 2008;9:105–127. doi: 10.2217/14622416.9.1.105. [DOI] [PubMed] [Google Scholar]
- Siddiqui A, Kerb R, Weale ME, Brinkmann U, Smith A, Goldstein DB, et al. Association of multidrug resistance in epilepsy with a polymorphism in the drug-transporter gene ABCB1. N Engl J Med. 2003;348:1442–1448. doi: 10.1056/NEJMoa021986. [DOI] [PubMed] [Google Scholar]
- Spudich A, Kilic E, Xing HY, Kilic U, Rentsch KM, Wunderli-Allenspach H, et al. Inhibition of multidrug resistance transporter-1 facilitates neuroprotective therapies after focal cerebral ischemia. Nat Neurosci. 2006;9:487–488. doi: 10.1038/nn1676. [DOI] [PubMed] [Google Scholar]
- Stein U, Walther W, Wunderlich V. Point mutations in the Mdr1 promoter of human osteosarcomas are associated with in-vitro responsiveness to multidrug-resistance relevant drugs. Eur J Cancer. 1994;30A:1541–1545. doi: 10.1016/0959-8049(94)00287-f. [DOI] [PubMed] [Google Scholar]
- Stormer E, von Moltke LL, Perloff MD, Greenblatt DJ. P-glycoprotein interactions of nefazodone and trazodone in cell culture. J Clin Pharmacol. 2001;41:708–714. doi: 10.1177/00912700122010609. [DOI] [PubMed] [Google Scholar]
- Syvanen S, Hammarlund-Udenaes M. Using PET studies of P-gp function to elucidate mechanisms underlying the disposition of drugs. Curr Top Med Chem. 2010;10:1799–1809. doi: 10.2174/156802610792927997. [DOI] [PubMed] [Google Scholar]
- Szabo D, Szabo G, Jr, Ocsovszki I, Aszalos A, Molnar J. Anti-psychotic drugs reverse multidrug resistance of tumor cell lines and human AML cells ex-vivo. Cancer Lett. 1999;139:115–119. doi: 10.1016/s0304-3835(99)00020-8. [DOI] [PubMed] [Google Scholar]
- Szakacs G, Paterson JK, Ludwig JA, Booth-Genthe C, Gottesman MM. Targeting multidrug resistance in cancer. Nat Rev Drug Discov. 2006;5:219–234. doi: 10.1038/nrd1984. [DOI] [PubMed] [Google Scholar]
- Thiebaut F, Tsuruo T, Hamada H, Gottesman MM, Pastan I, Willingham MC. Immunohistochemical localization in normal-tissues of different epitopes in the multidrug transport protein P170 – evidence for localization in brain capillaries and crossreactivity of one antibody with a muscle protein. J Histochem Cytochem. 1989;37:159–164. doi: 10.1177/37.2.2463300. [DOI] [PubMed] [Google Scholar]
- Thiel CM, Muller CP, Huston JP, Schwarting RK. High versus low reactivity to a novel environment: behavioural, pharmacological and neurochemical assessments. Neuroscience. 1999;93:243–251. doi: 10.1016/s0306-4522(99)00158-x. [DOI] [PubMed] [Google Scholar]
- Trivedi MH, Rush AJ, Wisniewski SR, Nierenberg AA, Warden D, Ritz L, et al. Evaluation of outcomes with citalopram for depression using measurement-based care in STAR*D: implications for clinical practice. Am J Psychiatry. 2006;163:28–40. doi: 10.1176/appi.ajp.163.1.28. [DOI] [PubMed] [Google Scholar]
- Ueda K, Okamura N, Hirai M, Tanigawara Y, Saeki T, Kioka N, et al. Human P-glycoprotein transports cortisol, aldosterone, and dexamethasone, but not progesterone. J Biol Chem. 1992;267:24248–24252. [PubMed] [Google Scholar]
- Uhr M, Grauer MT. abcblab P-glycoprotein is involved in the uptake of citalopram and trimipramine into the brain of mice. J Psychiatr Res. 2003;37:179–185. doi: 10.1016/s0022-3956(03)00022-0. [DOI] [PubMed] [Google Scholar]
- Uhr M, Steckler T, Yassouridis A, Holsboer F. Penetration of amitriptyline, but not of fluoxetine, into brain is enhanced in mice with blood-brain barrier deficiency due to Mdr1a P-glycoprotein gene disruption. Neuropsychopharmacology. 2000;22:380–387. doi: 10.1016/S0893-133X(99)00095-0. [DOI] [PubMed] [Google Scholar]
- Uhr M, Holsboer F, Muller MB. Penetration of endogenous steroid hormones corticosterone, cortisol, aldosterone and progesterone into the brain is enhanced in mice deficient for both mdr1a and mdr1b P-glycoproteins. J Neuroendocrinol. 2002;14:753–759. doi: 10.1046/j.1365-2826.2002.00836.x. [DOI] [PubMed] [Google Scholar]
- Uhr M, Grauer MT, Holsboer F. Differential enhancement of antidepressant penetration into the brain in mice with abcb1ab (mdr1ab) P-glycoprotein gene disruption. Biol Psychiatry. 2003;54:840–846. doi: 10.1016/s0006-3223(03)00074-x. [DOI] [PubMed] [Google Scholar]
- Uhr M, Namendorf C, Grauer MT, Rosenhagen M, Ebinger M. P-glycoprotein is a factor in the uptake of dextromethorphan, but not of melperone, into the mouse brain: evidence for an overlap in substrate specificity between P-gp and CYP2D6. J Psychopharmacol. 2004;18:509–515. doi: 10.1177/0269881104047278. [DOI] [PubMed] [Google Scholar]
- Uhr M, Grauer MT, Yassouridis A, Ebinger M. Blood-brain barrier penetration and pharmacokinetics of amitriptyline and its metabolites in p-glycoprotein (abcb1ab) knock-out mice and controls. J Psychiatr Res. 2007;41:179–188. doi: 10.1016/j.jpsychires.2005.10.005. [DOI] [PubMed] [Google Scholar]
- Uhr M, Tontsch A, Namendorf C, Ripke S, Lucae S, Ising M, et al. Polymorphisms in the drug transporter gene ABCB1 predict antidepressant treatment response in depression. Neuron. 2008;57:203–209. doi: 10.1016/j.neuron.2007.11.017. [DOI] [PubMed] [Google Scholar]
- Urquhart BL, Kim RB. Blood-brain barrier transporters and response to CNS-active drugs. Eur J Clin Pharmacol. 2009;65:1063–1070. doi: 10.1007/s00228-009-0714-8. [DOI] [PubMed] [Google Scholar]
- Vankalken CK, Broxterman HJ, Pinedo HM, Feller N, Dekker H, Lankelma J, et al. Cortisol is transported by the multidrug resistance gene-product p-glycoprotein. Br J Cancer. 1993;67:284–289. doi: 10.1038/bjc.1993.54. [DOI] [PMC free article] [PubMed] [Google Scholar]
- Varga A, Nugel H, Baehr R, Marx U, Hever A, Nacsa J, et al. Reversal of multidrug resistance by amitriptyline in vitro. Anticancer Res. 1996;16:209–211. [PubMed] [Google Scholar]
- Volk HA, Burkhardt K, Potschka H, Chen J, Becker A, Löscher W. Neuronal expression of the drug efflux transporter P-glycoprotein in the rat hippocampus after limbic seizures. Neuroscience. 2004;123:751–759. doi: 10.1016/j.neuroscience.2003.10.012. [DOI] [PubMed] [Google Scholar]
- Wacher VJ, Wu CY, Benet LZ. Overlapping substrate specificities and tissue distribution of cytochrome-P450 3a and P-Glycoprotein – implications for drug-delivery and activity in cancer-chemotherapy. Mol Carcinog. 1995;13:129–134. doi: 10.1002/mc.2940130302. [DOI] [PubMed] [Google Scholar]
- Wang JS, DeVane CL, Gibson BB, Donovan JL, Markowitz JL, Zhu HJ. Population pharmacokinetic analysis of drug-drug interactions among risperidone, bupropion, and sertraline in CF1 mice. Psychopharmacology. 2006a;183:490–499. doi: 10.1007/s00213-005-0209-y. [DOI] [PubMed] [Google Scholar]
- Wang JS, Zhu HJ, Marokowitz JS, Donovan JL, DeVane CL. Evaluation of antipsychotic drugs as inhibitors of multidrug resistance transporter P-glycoprotein. Psychopharmacology (Berl) 2006b;187:415–423. doi: 10.1007/s00213-006-0437-9. [DOI] [PubMed] [Google Scholar]
- Wang JS, Zhu HJ, Gibson BB, Markowitz JS, Donovan JL, DeVane CL. Sertraline and its metabolite desmethylsertraline, but not bupropion or its three major metabolites, have high affinity for P-glycoprotein. Biol Pharm Bull. 2008;31:231–234. doi: 10.1248/bpb.31.231. [DOI] [PMC free article] [PubMed] [Google Scholar]
- Weber CC, Kressmann S, Ott M, Fricker G, Müller WE. Inhibition of P-glycoprotein function by several antidepressants may not contribute to clinical efficacy. Pharmacopsychiatry. 2005;38:293–300. doi: 10.1055/s-2005-916184. [DOI] [PubMed] [Google Scholar]
- Weber CC, Eckert GP, Muller WE. Effects of antidepressants on the brain/plasma distribution of corticosterone. Neuropsychopharmacology. 2006;31:2443–2448. doi: 10.1038/sj.npp.1301076. [DOI] [PubMed] [Google Scholar]
- Weiss J, Dormann G, Martin-Facklam M, Kerpen CJ, Ketabi-Kiyanvash N, Haefeli WE. Inhibition of P-glycoprotein by newer antidepressants. J Pharmacol Exp Ther. 2003;305:197–204. doi: 10.1124/jpet.102.046532. [DOI] [PubMed] [Google Scholar]
- Wolburg H, Lippoldt A. Tight junctions of the blood-brain barrier: development, composition and regulation. Vascul Pharmacol. 2002;38:323–337. doi: 10.1016/s1537-1891(02)00200-8. [DOI] [PubMed] [Google Scholar]
- Wolburg H, Noell S, Mack A, Wolburg-Buchholz K, Fallier-Becker P. Brain endothelial cells and the glio-vascular complex. Cell Tissue Res. 2009;335:75–96. doi: 10.1007/s00441-008-0658-9. [DOI] [PubMed] [Google Scholar]
- Yamazaki M, Neway WE, Ohe T, Chen IW, Rowe JF, Hochman JH, et al. In vitro substrate identification studies for P-glycoprotein-mediated transport: species difference and predictability of in vivo results. J Pharmacol Exp Ther. 2001;296:723–735. [PubMed] [Google Scholar]
- Yasui-Furukori N, Saito M, Niioka T, Inoue Y, Sato Y, Kaneko S. Effect of itraconazole on pharmacokinetics of paroxetine: the role of gut transporters. Ther Drug Monit. 2007;29:45–48. doi: 10.1097/FTD.0b013e31802bb20d. [DOI] [PubMed] [Google Scholar]
- Yau JLW, Noble J, Thomas S, Kerwin R, Morgan PE, Lightman S, et al. The antidepressant desipramine requires the ABCB1 (Mdr1)-Type p-glycoprotein to upregulate the glucocorticoid receptor in mice. Neuropsychopharmacology. 2007;32:2520–2529. doi: 10.1038/sj.npp.1301389. [DOI] [PubMed] [Google Scholar]
- Yu CH, Kastin AJ, Tu H, Waters S, Pan WH. TNF activates P-glycoprotein in cerebral microvascular endothelial cells. Cell Physiol Biochem. 2007;20:853–858. doi: 10.1159/000110445. [DOI] [PubMed] [Google Scholar]
- Zhang L, Strong JM, Qiu W, Lesko LJ, Huang SM. Scientific perspectives on drug transporters and their role in drug interactions. Mol Pharm. 2006;3:62–69. doi: 10.1021/mp050095h. [DOI] [PubMed] [Google Scholar]
- Zhou SF. Structure, function and regulation of P-glycoprotein and its clinical relevance in drug disposition. Xenobiotica. 2008;38:802–832. doi: 10.1080/00498250701867889. [DOI] [PubMed] [Google Scholar]
- Zhu HJ, Wang JS, Markowitz JS, Donovan JL, Gibson BB, DeVane CL. Risperidone and paliperidone inhibit P-glycoprotein activity in vitro. Neuropsychopharmacology. 2007;32:757–764. doi: 10.1038/sj.npp.1301181. [DOI] [PubMed] [Google Scholar]
- Zlokovic BV. The blood-brain barrier in health and chronic neurodegenerative disorders. Neuron. 2008;57:178–201. doi: 10.1016/j.neuron.2008.01.003. [DOI] [PubMed] [Google Scholar]