

Abstract
Objectives
This study examines the effect of age on rate of cognitive decline in different stages of dementia, of nursing home and assisted-living residents.
Methods
In this longitudinal study, the Mini Mental State Examination (MMSE) was used to measure rate of cognitive decline in subjects who were nondemented [Clinical Dementia Rating (CDR)=0; n=353], questionably demented (CDR=0.5; n=121), or frankly demented (CDR≥1; n=213) at baseline.
Results
A generalized estimating equation was used to model the MMSE scores over time (mean follow-up 2.9±2.0 y). The generalized estimating equation model had the MMSE scores at successive follow-up time points as dependent variables and had linear and quadratic age, follow-up time from baseline, CDR at baseline, and all the interactions among them as independent variables, controlling for MMSE at baseline, sex, race, and education. The mean age of the entire sample was 85.2±7.4 years at baseline. There were no significant interactions of linear age effects with rate of cognitive decline. The analysis of interaction of quadratic age with rate of cognitive decline showed complex relationships: in the nondemented group, there was no substantial quadratic association of age with the rate of cognitive decline (P=0.13); in the questionable demented group, the oldest subjects declined relatively faster (P=0.02); and in the demented group, the youngest and oldest subjects tended to decline relatively less than subjects in the intermediate ages (P=0.07).
Conclusions
This study adds an additional aspect to the complexity of the association between age and rate of cognitive decline, showing that the direction and amplitude of this effect differs according to the stage along the course of cognitive decline.
Keywords: age, dementia stage, cognitive decline, rate, nursing home, assisted living
The world’s population is rapidly aging with rising prevalence of dementia.1 To enable familial financial and residential planning, patients and caregivers should understand the pattern of cognitive decline throughout the entire course of dementia and in predementia stages [cognitively normal elderly and mild cognitive impairment (MCI)]. Such information is also necessary for the design of clinical trials. The progression of dementia is not linear and tends to be slower in the early and late stages of the disease and faster in the middle stages.2 Early disease progression3 and dementia status at baseline4 also affect rate of decline.
The effect of age on dementia progression may differ from its effect on dementia onset. Age is associated with the prevalence and impact of some modifiable risk factors for dementia such as diabetes5,6; therefore, it is the most important single risk factor for dementia.7 Thus, primary and secondary dementia prevention strategies (namely those associated with risk factor modification) may differ according to age. Nonetheless, earlier studies8–10 found no association between age per se and the rate of cognitive decline.
Residents of supporting care facilities [ie, assisted-living facilities (AL) and nursing homes (NH)] have more dementia, morbidity, and mortality11 than community residents. An increasing proportion of the elderly population12 live in such long-term facilities, but dementia may not be recognized until late stages of the disease,13 preventing timely treatment and proper management.
The aim of this study was to examine the effect of age on cognitive decline in residents of supporting care facilities, and to determine whether this effect differs according to the stage of the disease. Therefore, we assessed the interaction of linear and quadratic age with the rate of cognitive decline and included baseline cognitive status [measured by Clinical Dementia Rating (CDR) score] as a predictor in the model.
METHODS
Subjects
The sample consisted of 687 residents of the Jewish Home and Hospital NH, which has been an academic affiliate of the Mount Sinai School of Medicine for over 25 years, and an AL facility, Kittay House, associated with the Jewish Home and Hospital. As part of this affiliation, the Mini Mental State Examination (MMSE) and the CDR scale are administered to all new long-term residents admitted to these facilities. Subjects were included in this study if baseline MMSE score was between 10 and 30, they had at least 1 follow-up assessment, and complete data on CDR, age, sex, race, and level of education. Subjects were not included if they had a baseline diagnosis of cerebrovascular disease, vascular dementia, another non-Alzheimer disease (AD) dementing condition, or a neurologic or psychiatric disorder that might affect cognition, such as Parkinson disease or schizophrenia. Loss of independence in the nondemented subjects (CDR=0) group was because of reasons other than cognitive, usually sensory limitations and physical disabilities. The total number of annual follow-up assessments among the 687 subjects was 2384, and the range of number of follow-up assessments per subject was 1 to 16 (mean 3.5, SD 1.7). The mean follow-up duration was 2.9 years (SD=2.0; minimum=0.134 y and maximum=12.93 y). Subjects with baseline MMSE score below 10 were excluded to minimize floor effects. The follow-up assessments after the subject reached 0 point in the MMSE were also excluded to avoid floor effect confounds.
Assessment Procedures
MMSE
Each subject was serially assessed at approximately annual intervals with a MMSE (assessment intervals were within predefined windows of approximately 12 mo to avoid confounds introduced by medical illness and other life events). The MMSE is a commonly used 30-point scale for assessing cognitive function in the following areas: orientation, registration, attention and calculation, recall, language, and praxis.14
CDR Scale
The CDR was administered to each participant at the same time as the MMSE. The CDR is an established instrument for the assessment of cognitive function and performance in 6 domains: memory, orientation, judgment and problem solving, community affairs, home and hobbies, and personal care.15 An adaptation of the CDR to supporting care facilities16 was used. The overall CDR score is derived by an algorithm that emphasizes memory. Scores are 0 (nondemented), 0.5 (questionable dementia), 1 (mild dementia), 2 (moderate dementia), and 3 (severe dementia). All psychometricians were certified in the CDR administration.17 Although the CDR=0.5 category and the diagnosis of MCI are correlated, there are discrepancies in their classifications18; therefore, we did not designate CDR=0.5 as MCI.
As the purpose of this study was to examine the contribution of age to cognitive decline in subjects with different disease stages at baseline, CDR category at baseline [nondemented (CDR=0), questionably demented (CDR=0.5), or demented (CDR≥1)], was an independent variable and the MMSE was the dependent variable to assess cognitive change. Although CDR and MMSE are highly correlated, both were considered as predictors in the analysis as the MMSE reflects cognitive abilities, whereas the CDR more strongly reflects functional capacities. Using both CDR and MMSE in the analysis evaluates the effect of each controlling for the other. The demented group (CDR≥1) was the reference group for the baseline CDR variable in the generalized estimation equation (GEE) analysis.
Covariates
Age was the independent variable of primary interest. A quadratic association with age was included in the model, to allow for examination of nonlinear associations. Sex (male—reference group), race (White—reference group—vs. all other), baseline MMSE, and years of education (trichotomized to <8, 8 to 12, and >12 y for the GEE analysis, with >12 y of education serving as the reference group) were used as covariates because of their known associations with cognitive performance and impairment.19
Statistical Analysis
This study included all available data from an ongoing longitudinal study so the starting point of each subject was the entry into the longitudinal study and the “end point” was the last observation.
For the entire sample, sex, baseline MMSE, education, race, and CDR were compared descriptively by age quartile, using Pearson χ2 or F tests. We used a GEE to fit the data. In this model, MMSE at successive follow-up time points was the dependent variable; baseline MMSE, sex, categorized education, and ethnicity were the covariates; and time from baseline, baseline age (centered at its mean) linear term, baseline age (centered at its mean) quadratic term, baseline CDR level, and their interactions were the independent variables. Model fitting was carried out in SAS 9.1.3.
A GEE model differs from the usual model in analysis of variance, in which a main effect for a categorical variable compares means for all levels of that variable with the grand mean, with each mean averaged over all the levels of the other main effects. In a GEE model, all the comparisons refer to the mean of a “reference group”—rather than the grand mean—therefore, the main effect is set at zero for the reference group, and the means of each other level are compared with the mean of the reference group. Similarly, the main effects for other predictors are evaluated in the reference group, rather than the entire sample. Correspondingly, the interactions of a predictor with CDR refer to differences between the effect of the predictor in the reference group and its effects in the other CDR groups. Therefore, the sum of the interaction coefficient for another CDR group and the main effect coefficient for the predictor (pertaining to the reference group) describes the effect of the predictor on the other group. For example, if the effect of a predictor in the reference group is in the opposite direction but similar in magnitude to the interaction for another group, the predictor has little effect on that group. Specifically, in this GEE model, the demented group (CDR≥1) was the reference group for the baseline CDR variable. As MMSE performance was the dependent variable, a negative coefficient of the interaction of an independent variable with time indicated an association with decline in MMSE.
RESULTS
Subject Characteristics
There were 353 subjects in the CDR=0 group, 121 in the CDR=0.5 group, and 213 in the CDR≥1 group. The mean age of the overall sample at baseline was 85.2 years (SD=7.4; minimum=60.9 y and maximum=104.5 y) and mean MMSE at baseline was 23.8 (SD=5.7; minimum=10 and maximum=30). The majority of subjects were Whites (79.9%) and women (73.5%). The mean number of years of education was 13.0 years (SD=3.8), and 45.6% of the subjects had 12 years of education or more (Table 1). There were fewer females (P=0.018) and less Whites (P<0.0001) in the youngest quartile, but they did not differ in education, baseline MMSE score, or CDR status.
TABLE 1.
Descriptive Statistics by Age Quartiles
| Age Quartiles | Overall | P | ||||
|---|---|---|---|---|---|---|
| Age range (y) | 60.9–80.7 | 80.7–86.5 | 86.5–90.3 | 90.3–104.5 | 60.9–104.5 | |
| n | 172 | 172 | 172 | 171 | 687 | |
| Mean BL age (y) (SD) | 74.9 (4.8) | 84.1 (1.7) | 88.5 (1.1) | 93.5 (2.8) | 85.2 (7.4) | <0.0001 |
| Sex (% females) | 65.1 | 72.7 | 78.5 | 77.8 | 73.5 | 0.02 |
| Mean BL MMSE (SD) | 24.3 (6.0) | 23.6 (5.8) | 24.1 (5.4) | 23.1 (5.5) | 23.8 (5.7) | 0.19 |
| Mean Edu (SD) | 12.8 (3.8) | 13.4 (3.4) | 13.1 (3.9) | 12.8 (3.9) | 13.0 (3.8) | 0.40 |
| % Edu >12 | 44.2 | 46.5 | 46.5 | 45 | 45.6 | 0.19 |
| % 8<Edu≤12 | 41.9 | 47.1 | 42.4 | 39.2 | 42.7 | |
| Race % Whites | 66.9 | 88.9 | 85.5 | 82.5 | 79.9 | <0.0001 |
| CDR=0 | 58.7 | 46.5 | 51.2 | 49.1 | 51.4 | 0.25 |
| CDR=0.5 | 13.4 | 17.4 | 20.4 | 19.3 | 17.6 | |
| CDR≥1 | 27.9 | 36.1 | 28.5 | 31.6 | 31 | |
BL indicates baseline; CDR, clinical dementia rating scale; Edu, education; MMSE, Mini Mental State Examination.
Table 2 presents the coefficients for the GEE model. For the entire sample, sex and education were not associated with follow-up MMSE performance, but baseline MMSE was very strongly associated with cognition at follow up (P<0.0001), which also differed greatly by baseline CDR. Linear age was not associated with cognition in any of the CDR groups. A negative quadratic association of age with cognition approached significance (P=0.05) for the demented group. There was little quadratic association for the other groups, as their interactions were in the opposite direction from the association for the demented group, but of similar magnitude.
TABLE 2.
Generalized Estimation Equation Modeling Analysis of Quadratic Age as a Predictor of MMSE Decline
| Estimation | SE | P | |
|---|---|---|---|
| Age | −0.03 | 0.07 | 0.64 |
| Sex* | −0.37 | 0.25 | 0.14 |
| MMSE at baseline | 0.79 | 0.05 | <0.0001 |
| Educ: <8 y* | −0.01 | 0.59 | 0.98 |
| Educ: 8-12 y | 0.15 | 0.30 | 0.61 |
| Race* | 0.90 | 0.45 | 0.05 |
| CDR=0* | 3.76 | 0.78 | <0.0001 |
| CDR=0.5* | 1.88 | 0.83 | 0.02 |
| Age×CDR (CDR=0) | 0.007 | 0.07 | 0.92 |
| Age×CDR (CDR=0.5) | 0.11 | 0.08 | 0.14 |
| Time | −1.85 | 0.21 | <0.0001 |
| Time×CDR (CDR=0) | 1.63 | 0.22 | <0.0001 |
| Time×CDR (CDR=0.5) | 1.54 | 0.26 | <0.0001 |
| Age×time | −0.007 | 0.03 | 0.78 |
| Age×time×CDR (CDR=0)* | 0.01 | 0.03 | 0.73 |
| Age×time×CDR (CDR=0.5)* | −0.04 | 0.03 | 0.26 |
| Squared age | −0.009 | 0.005 | 0.05 |
| Squared age×CDR (CDR=0)* | 0.009 | 0.005 | 0.08 |
| Squared age×CDR (CDR=0.5)* | 0.01 | 0.006 | 0.03 |
| Time×squared age | 0.003 | 0.002 | 0.07 |
| Time×squared age×CDR (CDR=0)* | −0.003 | 0.002 | 0.13 |
| Time×squared age×CDR (CDR=0.5)* | −0.005 | 0.002 | 0.02 |
Reference groups: sex: male; education: >12; race: White; CDR: CDR≥1; age×CDR: Age×(CDR ≥1); age×time×CDR interaction: CDR ≥1; squared age×CDR: CDR ≥1; time×squared age×CDR: CDR ≥1.
CDR indicates clinical dementia rating scale; Educ, education; MMSE, Mini Mental State Examination.
There was a very strong negative association of cognitive performance with follow-up time (coefficient=−1.85, P<0.0001), indicating decline over time in the demented reference group. There were also very strong positive interactions with follow-up time (ie, in the opposite direction of the effect in the reference group) for the nondemented (coefficient=1.63, P<0.0001) and questionably demented (coefficient=1.54, P<0.0001) groups, indicating that these groups differed from the reference group by not declining substantially over time.
Association of Age With Rate of Cognitive Decline
There were no significant interactions of linear age effects with time. The interaction of follow-up time with quadratic age approached significance (coefficient=0.0033, P=0.07), suggesting that in the demented reference group—for which there was substantial decline—the youngest and oldest subjects tended to decline relatively less than subjects at intermediate ages. The 3-way interaction for the questionably demented group was stronger (coefficient=−0.0052, P=0.02), but in the opposite direction, indicating that for that group, the youngest and oldest subjects tended to decline relatively more. For the nondemented group, the interaction was also in the opposite direction from the reference group (coefficient= 0.0029, P=0.13), but of similar magnitude, indicating no substantial quadratic association of age with rate of cognitive decline for nondemented subjects.
Figure 1 shows the modeled slope at different ages for the 3 CDR groups. For all ages, there was little decline in the nondemented group. Questionably demented subjects below 90 years of age declined less than a half point on the MMSE per year, but older subjects declined more (Fig. 1). In contrast, demented subjects above 70 years of age, declined by more than a half point per year, with many declining by 1.5 points.
FIGURE 1.
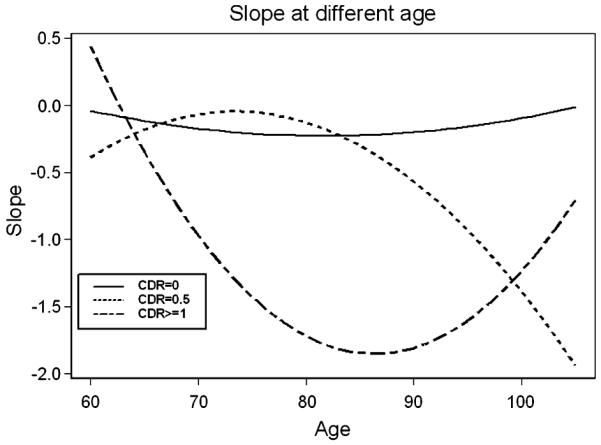
Slope at different age. The x-axis refers to age whereas the y-axis refers to rate of cognitive decline and not to extent of decline (in Mini Mental State Examination points). Thus values that are closer to 0 represent slower rate of decline. CDR indicates Clinical Dementia Rating.
DISCUSSION
This study examined the effects of age on rates of cognitive decline as measured by the MMSE in a sample of NH and AL residents. There were no consistent patterns of association of age with rate of cognitive decline for the entire sample, consistent with associations that differed according to baseline cognitive status: age was not associated with rate of cognitive decline in the group that was cognitively intact at baseline, in the questionably demented group, the oldest tended to decline faster; and in the demented group, subjects in the intermediate-age groups tended to decline faster. It must be noted that rates of decline are estimates of average, with considerable variation among individuals.
NH and AL residents constitute a rapidly growing segment of the population which carries high morbidity rates,20 and a higher risk for cognitive impairment and dementia,21,22 compared with community residents. NH placement has been shown to be associated with an accelerated rate of cognitive decline.23 As age is associated with proneness to dementia,7 we expected higher age to be associated with higher rate of cognitive decline in this vulnerable population. Our results however, showed that the association of age with rate of cognitive decline was not homogenous, and differs in direction and extent between cognitively normal, questionable demented, and frankly demented subjects (Fig. 1). The quadratic effect of age was strongest for the demented subjects, where the intermediate-age groups declined fastest, and more subtle—and in the opposite direction—for the questionably demented, where the oldest declined fastest.
The brains of cognitively intact subjects, even at extreme ages, may be resilient to subtle effects of age, explaining the lack of association between scores on the MMSE over time and increasing age. In the questionably demented group, the association of age on rate of cognitive decline has a J-shaped curve, in which the oldest old declined the fastest. These results may reflect increased amounts of neuropathology and/or decreased amount of brain reserve24 in the oldest questionably demented subjects, who may be more frail and less resilient to the effect of age on cognitive decline than the cognitively intact and the youngest and intermediate age questionably demented, who may still have available reserve. Alternatively, the MMSE may have a ceiling effect, precluding its sensitivity to the effects of age on rate of cognitive decline in the most cognitively intact subjects.25 This possibility, however, is less likely for the questionably demented group, as in another study of this sample, questionably demented subjects were particularly affected by other risk factors.26
In the frankly demented group, lower rates of cognitive decline were observed in the youngest and oldest subjects. This association may resemble the course of dementia, which is slow during the early and very late stages of the disease and faster in the middle stages.2
Other studies differed from ours in their findings regarding the effect of age on rate of cognitive decline in demented subjects: Higher age was associated with faster decline in the MMSE in a longitudinal study of AD patients with a mean baseline MMSE score of 11.2 (range: 1 to 22) and a mean age of 79.5 years (age range: 52 to 102 y).27 The discrepancies between these results and those of our study may be explained by the lower baseline MMSE, reflecting a more advanced dementia compared with that in our study. Alternatively, although the age range of the entire sample is similar to that in our study, the mean age is similar to that of one of intermediate groups in this study, in which higher age was associated with faster cognitive decline. Thus, the effect of age on rate of cognitive decline may be similar to the one observed in the intermediate-age demented group in this study. Age was not associated with the rate of cognitive decline in demented memory clinic subjects,8,28 very old individuals from a community-based sample (mean age at baseline=83 y),10 and in AD subjects from a population-based longitudinal study.9
In some studies, the interaction of age with other factors, rather than age per se, was associated with rate of cognitive decline. Demented subjects aged 85 years or above, who had cardiovascular risk factors demonstrated a more rapid rate of cognitive decline than similarly aged individuals without these risk factors or younger subjects with cardiovascular risk factors.9 Cognition declined faster in demented subjects with cerebrovascular disease compared with subjects with probable/possible AD uncomplicated by cerebrovascular disease in subjects aged 80 years and above. Conversely, in demented subjects younger than 80 years, presence of cerebrovascular disease was associated with a slower rate of cognitive decline.29 A possible interpretation may be that the effect of age by itself on brain pathology is subtle and not always measurable; this effect may potentiate the effect of other factors that affect brain function.30 Alternatively, the effect of age on cognitive decline may reach an asymptote in the preclinical and early stages of dementia and be overshadowed by the dementia process thereafter.31 In nondemented elderly, memory loss over time may be more strongly associated with progression of preclinical dementia rather than with chronologic age.32 This is compatible with the lack of age effect on rate of cognitive decline in cognitively normal participants of this study and accelerated rate of decline in the oldest questionable demented participants.
This study adds an additional aspect to the complexity of the association between age and rate of cognitive decline, showing that the direction and amplitude of this effect differs according to the stage along the course of cognitive decline. These join other factors that have been shown earlier to affect the association of age and cognitive decline, such as comorbidities and type of dementing process.28,33 Stratification of subjects according to dementia type was beyond the scope of this study, but diagnosis of frontotemporal dementia, vascular dementia, and other non-AD dementing conditions were exclusionary criteria for inclusion in this study. Thus, the effect of macrovascular pathology was partly abated, but the potential contribution of incident macrovascular and microvascular pathology to cognitive decline was not measured in this study.
The strengths of this study are the relatively large sample, with a broad age range ranging from 60 to 105 years (and an upper quartile of ages above 90 years).
Acknowledgments
Supported by NIA grants K01 AG023515-01 and R01 AG034087, and the Graubard Fund for Dr Beeri; P01 AG02219 and the Berkman Trust for Dr Haroutunian; P50 AG05138 for Dr Sano; P01 AG02219 and P50 AG05138 for Dr Schmeidler; and P50 AG05138 for Dr Luo.
REFERENCES
- 1.Rockwood K, Stadnyk K. The prevalence of dementia in the elderly: a review. Can J Psychiatry. 1994;39:253–257. doi: 10.1177/070674379403900503. [DOI] [PubMed] [Google Scholar]
- 2.Stern RG, Mohs RC, Davidson M, et al. A longitudinal study of Alzheimer’s disease: measurement, rate, and predictors of cognitive deterioration. Am J Psychiatry. 2010;151:390–396. doi: 10.1176/ajp.151.3.390. [DOI] [PubMed] [Google Scholar]
- 3.Doody RS, Massman P, Dunn JK. A method for estimating progression rates in Alzheimer disease. Arch Neurol. 2001;58:449–454. doi: 10.1001/archneur.58.3.449. [DOI] [PubMed] [Google Scholar]
- 4.Ruitenberg A, Kalmijn S, de Ridder MA, et al. Prognosis of Alzheimer’s disease: the Rotterdam Study. Neuroepidemiology. 2001;20:188–195. doi: 10.1159/000054786. [DOI] [PubMed] [Google Scholar]
- 5.Luchsinger JA. Adiposity, hyperinsulinemia, diabetes and Alzheimer’s disease: an epidemiological perspective. Eur J Pharmacol. 2008;585:119–129. doi: 10.1016/j.ejphar.2008.02.048. [DOI] [PMC free article] [PubMed] [Google Scholar]
- 6.Schnaider BM, Goldbourt U, Silverman JM, et al. Diabetes mellitus in midlife and the risk of dementia three decades later. Neurology. 2004;63:1902–1907. doi: 10.1212/01.wnl.0000144278.79488.dd. [DOI] [PubMed] [Google Scholar]
- 7.Launer LJ. Overview of incidence studies of dementia conducted in Europe. Neuroepidemiology. 1992;11(suppl 1):2–13. doi: 10.1159/000110954. [DOI] [PubMed] [Google Scholar]
- 8.McCarten JR, Hemmy LS, Rottunda SJ, et al. Patient age influences recognition of Alzheimer’s disease. J Gerontol A Biol Sci Med Sci. 2008;63:625–628. doi: 10.1093/gerona/63.6.625. [DOI] [PubMed] [Google Scholar]
- 9.Mielke MM, Rosenberg PB, Tschanz J, et al. Vascular factors predict rate of progression in Alzheimer disease. Neurology. 2007;69:1850–1858. doi: 10.1212/01.wnl.0000279520.59792.fe. [DOI] [PubMed] [Google Scholar]
- 10.Small BJ, Viitanen M, Winblad B, et al. Cognitive changes in very old persons with dementia: the influence of demographic, psychometric, and biological variables. J Clin Exp Neuropsychol. 1997;19:245–260. doi: 10.1080/01688639708403855. [DOI] [PubMed] [Google Scholar]
- 11.Friedman SM, Mendelson DA, Bingham KW, et al. Hazards of hospitalization: residence prior to admission predicts outcomes. Gerontologist. 2008;48:537–541. doi: 10.1093/geront/48.4.537. [DOI] [PubMed] [Google Scholar]
- 12.Golant SM. Do impaired older persons with health care needs occupy US assisted living facilities? An analysis of six national studies. J Gerontol B Psychol Sci Soc Sci. 2004;59B:S68–S79. doi: 10.1093/geronb/59.2.s68. [DOI] [PubMed] [Google Scholar]
- 13.Macdonald AJ, Carpenter GI. The recognition of dementia in “non-EMI” nursing home residents in South East England. Int J Geriatr Psychiatry. 2003;18:105–108. doi: 10.1002/gps.779. Ref ID: 122. [DOI] [PubMed] [Google Scholar]
- 14.Folstein MF, Folstein SE, McHugh PR. “Mini-mental state.” A practical method for grading the cognitive state of patients for the clinician. J Psychiatr Res. 1975;12:189–198. doi: 10.1016/0022-3956(75)90026-6. [DOI] [PubMed] [Google Scholar]
- 15.Morris J. The clinical dementia rating (CDR): current version and scoring rules. Neurology. 2010;43:2412–2414. doi: 10.1212/wnl.43.11.2412-a. [DOI] [PubMed] [Google Scholar]
- 16.Marin DB, Flynn S, Mare M, et al. Reliability and validity of a chronic care facility adaptation of the clinical dementia rating scale. Int J Geriatr Psychiatry. 2001;16:745–750. doi: 10.1002/gps.385. [DOI] [PubMed] [Google Scholar]
- 17.Alzheimer’s Disease Research Center (ADRC) 2010 http://www.alz.washington.edu/NONMEMBER/cdr2.html.
- 18.Saxton J, Snitz BE, Lopez OL, et al. Functional and cognitive criteria produce different rates of mild cognitive impairment and conversion to dementia. J Neurol Neurosurg Psychiatry. 2009;80:737–743. doi: 10.1136/jnnp.2008.160705. [DOI] [PMC free article] [PubMed] [Google Scholar]
- 19.Jones RN, Gallo JJ. Education bias in the mini-mental state examination. Int Psychogeriatr. 2001;13:299–310. doi: 10.1017/s1041610201007694. [DOI] [PubMed] [Google Scholar]
- 20.McNabney MK, Samus QM, Lyketsos CG, et al. The spectrum of medical illness and medication use among residents of assisted living facilities in central Maryland. J Am Med Dir Assoc. 2008;9:558–564. doi: 10.1016/j.jamda.2008.03.003. [DOI] [PMC free article] [PubMed] [Google Scholar]
- 21.Magsi H, Malloy T. Underrecognition of cognitive impairment in assisted living facilities. J Am Geriatr Soc. 2005;53:295–298. doi: 10.1111/j.1532-5415.2005.53117.x. [DOI] [PubMed] [Google Scholar]
- 22.Zimmerman S, Gruber-Baldini AL, Sloane PD, et al. Assisted living and nursing homes: apples and oranges. Gerontologist. 2003;43:107–117. doi: 10.1093/geront/43.suppl_2.107. [DOI] [PubMed] [Google Scholar]
- 23.Wilson RS, McCann JJ, Li Y, et al. Nursing home placement, day care use, and cognitive decline in Alzheimer’s disease. Am J Psychiatry. 2007;164:910–915. doi: 10.1176/ajp.2007.164.6.910. [DOI] [PubMed] [Google Scholar]
- 24.Mortimer JA. Brain reserve and the clinical expression of Alzheimer’s disease. Geriatrics. 1997;52(suppl 2):S50–S53. [PubMed] [Google Scholar]
- 25.Galasko DR, Gould RL, Abramson IS, et al. Measuring cognitive change in a cohort of patients with Alzheimer’s disease. Stat Med. 2000;19:1421–1432. doi: 10.1002/(sici)1097-0258(20000615/30)19:11/12<1421::aid-sim434>3.0.co;2-p. [DOI] [PubMed] [Google Scholar]
- 26.Ravona-Springer R, Luo X, Schmeidler J, et al. Diabetes is associated with increased rate of cognitive decline in questionably demented elderly. Dement Geriatr Cogn Disord. 2010;29:68–74. doi: 10.1159/000265552. [DOI] [PMC free article] [PubMed] [Google Scholar]
- 27.Guk-Hee S, Young-Su J, Byeong KY, et al. A longitudinal study of Alzheimer’s disease: rates of cognitive and functional decline. Int J Geriatr Psychiatry. 2010;19:817–824. doi: 10.1002/gps.1168. [DOI] [PubMed] [Google Scholar]
- 28.Bruandet A, Richard F, Bombois S, et al. Alzheimer disease with cerebrovascular disease and vascular dementia: clinical features and course compared with Alzheimer disease. J Neurol Neurosurg Psychiatry. 2009;80:133–139. doi: 10.1136/jnnp.2007.137851. [DOI] [PubMed] [Google Scholar]
- 29.Mungas D, Reed BR, Ellis WG, et al. The effects of age on rate of progression of Alzheimer disease and dementia with associated cerebrovascular disease. Arch Neurol. 2001;58:1243–1247. doi: 10.1001/archneur.58.8.1243. [DOI] [PubMed] [Google Scholar]
- 30.Drachman DA. Aging of the brain, entropy, and Alzheimer disease. Neurology. 2006;67:1340–1352. doi: 10.1212/01.wnl.0000240127.89601.83. [DOI] [PubMed] [Google Scholar]
- 31.Backman L, Jones S, Small BJ, et al. Rate of cognitive decline in preclinical Alzheimer’s disease: the role of comorbidity. J Gerontol B Psychol Sci Soc Sci. 2003;58:228–236. doi: 10.1093/geronb/58.4.p228. [DOI] [PubMed] [Google Scholar]
- 32.Sliwinski MJ, Hofer SM, Hall C, et al. Modeling memory decline in older adults: the importance of preclinical dementia, attrition, and chronological age. Psychol Aging. 2003;18:658–671. doi: 10.1037/0882-7974.18.4.658. [DOI] [PubMed] [Google Scholar]
- 33.Rascovsky K, Salmon DP, Lipton AM, et al. Rate of progression differs in frontotemporal dementia and Alzheimer disease. Neurology. 2005;65:397–403. doi: 10.1212/01.wnl.0000171343.43314.6e. [DOI] [PubMed] [Google Scholar]