

Abstract
Aim. Arterial occlusion is a leading cause of cardiovascular disease. The main mechanism causing vessel occlusion is thrombus formation, which may be initiated by the activation of platelets. The focus of this study is on the mechanical aspects of platelet-mediated thrombosis which includes the motion, collision, adhesion and aggregation of activated platelets in the blood. A review of the existing continuum-based models is given. A mechanical model of platelet accumulation onto the vessel wall is developed using the dissipative particle dynamics (DPD) method in which the blood (i.e. colloidal-composed medium) is treated as a group of mesoscale particles interacting through conservative, dissipative, attractive and random forces.
Methods. Colloidal fluid components (plasma and platelets) are discretized by mesoscopic (micrometre-size) particles that move according to Newton's law. The size of each mesoscopic particle is small enough to allow tracking of each constituent of the colloidal fluid, but significantly larger than the size of atoms such that, in contrast to the molecular dynamics approach, detailed atomic level analysis is not required.
Results. To test this model, we simulated the deposition of platelets onto the wall of an expanded tube and compared our computed results with the experimental data of Karino et al. (Miscrovasc. Res. 17, 238–269, 1977). By matching our simulations to the experimental results, the platelet aggregation/adhesion binding force (characterized by an effective spring constant) was determined and found to be within a physiologically reasonable range.
Conclusion. Our results suggest that the DPD method offers a promising new approach to the modelling of platelet-mediated thrombosis. The DPD model includes interaction forces between platelets both when they are in the resting state (non-activated) and when they are activated, and therefore it can be extended to the analysis of kinetics of binding and other phenomena relevant to thrombosis.
Keywords: thrombosis, dissipative particle dynamics, modelling
1. Introduction
Platelets circulate with the blood and aid in the repair of traumatic injuries of the vessel wall. Platelets are cell fragments produced from megakaryocyte during differentiation. Physiological concentration varies from 150 to 350×109 l−1. Owing to their small size, platelets occupy less than 0.3% of the blood's volume. Their basic shape is disc-like and they can adhere to the vessel wall as well as to each other. There are a large number of receptors of various types, which could be upregulated to the surface of the platelet membrane, participating in the interactions between vessel walls (endothelium), other platelets and different coagulation factors. The impaired function of these interactions causes excessive bleeding or pathological thrombosis within vessels (Vander et al. 1998).
Platelet coagulation may be initiated by the expression of tissue factor molecules and the activation of the coagulation cascade. Platelet activation can also be induced by a direct contact between platelets and collagen, enhanced by thrombin or other agonists such as ADP (Fogelson & Kuharsky 1998; Loscalzo & Schafer 2003), or when blood is exposed to a reactive surface, e.g. the synthetic surface of a cardiovascular device (Guyton 1991; Resmi et al. 2004). Also, other platelets in the plasma can cohere and can then adhere to the platelets already attached to the wall.
Pathological platelet aggregation is triggered when the balance between pro- and anti-coagulation factors present in the blood is not sustained. This imbalance initiates the coagulation cascade (a series of enzymatic reactions) that enhances platelet activation and leads to thrombus formation. Details about the conditions leading to thrombosis development are given elsewhere (e.g. Kuharsky & Fogelson 2001; Loscalzo & Schafer 2003). A schematic of platelet adhesion and aggregation is shown in figure 1.
Figure 1.

Schematic of the mechanisms of platelet adhesion and aggregation in flowing blood (based on Fogelson & Guy 2004).
It is of particular importance in the context of this study to note that platelet aggregation, adhesion and detachment are affected by factors of a mechanical nature, among which the shear rate, or the shear stress, is dominant. Numerous studies have shown that the shear stress enhances the thrombosis process and can, without any exogenous agonist, even directly cause platelet activation (e.g. Alkhamis et al. 1988, 1990; Strony et al. 1993; Bluestein et al. 1999; Einav & Bluestein 2004; Spieker et al. 2004; Yamazaki et al. 2005). In a flow field with high shear rate, the interaction between GPIb receptors and vWF multimers can initiate the tethering of circulating platelets to the vessel wall and to already adherent platelets (Fogelson & Guy 2004).
When a platelet is activated, its shape changes and its surface becomes sticky due to the expression of surface receptors (GPIIb/IIIa; Sorensen 2002). These receptors interact with the plasma protein fibrinogen (figure 1). Fibrinogen binds to the receptors of two activated platelets and forms a molecular bond between platelets (Fogelson & Guy 2004).
The focus of this study is on the mechanical aspects of activated platelet–wall and platelet–platelet interactions. We have stated above that platelets must contact the damaged vessel tissue in order to start the process of aggregation. Fluid flow plays the main role for transport of platelets by convection and diffusion. Also, the duration of platelet activation and the proximity of the activated platelets to the damaged tissue are important. Furthermore, high-flow shear stress significantly affects the process of breaking the bonds of existing aggregated platelets. Thus, many aspects of thrombosis are intricately related to the nature of the local blood flow. Many experimental results suggest that vessel branches, recirculation zones near protruding atherosclerotic plaques and bends are zones most favourable for thrombosis (Karino & Goldsmith 1980; Karino & Motomiya 1984).
The mechanical events of platelet-mediated thrombosis include the motion, collision, adhesion and aggregation of activated platelets in the colloidal medium (blood plasma and blood cells). We assume that these mechanical events are governed by external forces (e.g. gravity, inertia) and by internal interaction forces with neighbouring platelets, plasma and other blood constituents. The fluid flow and aggregate growth are mutually coupled, since the fluid flow induces platelet aggregation and the already developed occlusion has a direct influence on the haemodynamics.
Currently, there is considerable effort to model these mechanical processes by computer simulation. The most commonly used computational models treat blood as a continuous homogeneous medium. In this approach, blood flow is usually defined by the continuity equation and the Navier–Stokes equations, and the distributions of platelets and proteins relevant to thrombosis are described by the diffusion–convection reaction equations (Fogelson 1992; Sorensen et al. 1999a,b). These studies use simplifications such as diffusion-limited rates of platelet–surface adhesion, simple flow fields (Poiseuille or Couette) and constant platelet–surface reactivity. These simplifications allow solutions to be obtained in an analytical closed form (Basmadjian 1990). Although these models are based on significant simplifications, they have been helpful in qualitatively describing the relative effects of convection, diffusion and surface reaction on platelet aggregation (Strong et al. 1987).
Numerous computational and experimental investigations have been performed to describe, qualitatively, the effects of flow characteristics, such as recirculation and separation flow region, and shear stress, on platelet deposition (Karino & Goldsmith 1979; Badimon & Badimon 1989). These studies are useful owing to the clinical evidence of high prediction of thrombosis in the areas of these flow regions (Ruggeri 2000).
Fogelson (1992) investigated platelet activation, agonist transport and bulk aggregation using a continuum model. A fictitious fluid-dynamic body force field was introduced to simulate flow disturbances due to platelet aggregation. Another discrete-platelet model of platelet–surface adhesion and bulk aggregation was proposed by the same author, but has not been experimentally validated (Fogelson 1984). Sorenson et al. (1999a,b) formulated a two-dimensional continuum model that includes platelet–platelet and platelet–surface adhesion, platelet activation by relevant agonists, platelet-phospholipid-dependent thrombin generation and thrombin inhibition by anti-thrombin III with heparin catalysis.
A major drawback of these types of models is that they treat ‘blood’ as a homogeneous medium and do not describe the behaviour of individual blood constituents (e.g. platelets, red blood cells (RBCs), white blood cells). Blood is a highly complex suspension of chemically and electrostatically active cells suspended in an electrolytic fluid with active proteins and organic substances (Boryczko et al. 2003). Especially in microvascular vessels, blood flow cannot be treated as a homogeneous fluid flow but rather the motion of RBCs lubricated by the rest of the colloidal suspension. Therefore, to get an insight into the nature of platelet activation, aggregation and adhesion, it would be instructive to track an individual platelet in the sequence of the process. Boryczko et al. (2003) demonstrated such a Lagrangian type computational approach; Chopard et al. (2006) applied the lattice Boltzmann approach to model blood flow and platelet-induced clotting; and Harrison et al. (2007) modelled flow-related clotting by the lattice Boltzmann method. The objective of this study is to apply a new computational dissipative particle dynamics (DPD) approach to simulate platelet-mediated thrombosis in a simple model system.
In what follows, we first describe a DPD computational model of fluid flow with simple interaction forces. Besides the usual DPD interaction forces, additional platelet–wall adhesion forces are included. The modelling is implemented for a few numerical examples and verified by comparison with experimental results from the literature. These simulations involved up to 2.5 million particles. Finally, we discuss and summarize the computational results.
2. Methods
The aim of this study is to develop a DPD model of the platelet adhesion process. We first model fluid flow as a motion of mesoscale DPD particles, and then simulate the thrombosis development through platelet accumulation onto the wall. The basic idea in the model of the platelet adhesion process is to parametrize the bonding interaction force, involved in the process of sticking of activated platelets to the vessel wall, by a characteristic ‘effective bond stiffness’ (or spring constant), kbw, whose magnitude is unknown. The values of the parameter kbw are obtained by fitting the DPD model simulation results to the in vitro experimental data of platelet adhesion onto the wall surface in plasma shear flows.
(a) Basic DPD equations
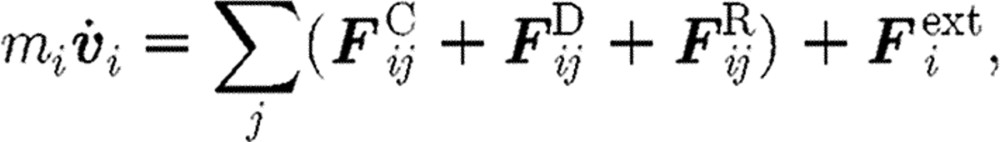
Flow of a colloidal fluid is viewed as a motion of the collection of DPD mesoscale particles. The motion of each DPD particle (further called ‘particle’) is described by the following Newton's law equation:
 |
(2.1) |
where mi is the mass of particle ‘i’;  is the particle acceleration as the time derivative of velocity;
  ,
,  and
and  are the conservative (repulsive), dissipative and random (Brownian) interaction forces that particle ‘j’ exerts on particle ‘i’, respectively, provided particle j is within the radius of influence rc of particle i; and
  is the external force exerted on particle i, which usually represents gradient of pressure or gravity force as a driving force for the fluid domain (Boryczko et al. 2003). Hence, the total interaction force
  (figure 2) between the two particles is
 |
(2.2) |
The component forces can expressed as (Español & Warren 1995)
| (2.3) |
Here, aij is the maximum repulsion force per unit mass; rij is the distance between particles i and j;  is the unit vector pointing in direction from j to i; γ stands for the friction coefficient; and σ is the amplitude of the random force. Also, wD and wR are the weight functions for dissipative and random forces, dependent on the distance r from the particle i, and ξij is a random number with zero mean and unit variance. The interaction force is equal to zero outside the domain of influence rc, hence Fij=0 for rij>rc.
Figure 2.

Interaction forces in the DPD approach. 
Furthermore, in order that a DPD fluid system possesses a Gibbs–Boltzmann equilibrium state, the following relation between the amplitudes of the weight functions of dissipative and random forces, wD and wR, must hold (Español & Warren 1995):
 |
(2.4) |
Also the amplitude of the random force σ is related to the absolute temperature T,
 |
(2.5) |
where kB is the Boltzmann constant. The weight functions can be expressed in a form (Groot & Warren 1997) given as
 |
(2.6) |
The particles used in this study represent both plasma fluid particles and platelets. The interaction forces between any two particles are defined in equation (2.2), while an additional attractive force is introduced between platelets and the wall (see §2d).
(b) DPD boundary conditions
The implementation of boundary conditions at the wall in DPD is not simple and straightforward. There are several approaches for imposing wall boundary conditions. The layer of particles at a wall is assumed to be frozen, but they interact with other particles.
Free-slip and no-slip conditions at the rigid walls can be imposed by employing the specular and bounce-back approaches, respectively. The local specular reflection is expressed by the following equations:
 |
(2.7) |
where  is the unit tensor; the minus and plus superscripts denote velocities before and after collision, respectively, with the wall;
  stands for the velocity of particle j relative to the wall velocity; and nW is a unit vector perpendicular to the wall. Thus, only the normal component is reflected while the tangential components remain unaltered. The bounce-back reflection is expressed by the relation (Haber et al. 2006; Filipovic et al. 2008a,b)
 |
(2.8) |
In this study, we used the frozen layers of particles on the walls as well as bounce-back reflection for the particles that reach the walls.
Also, at the inlet boundary a parabolic velocity profile is prescribed while at the outlet boundary the periodic boundary conditions are implemented.
(c) Integration of DPD equations
In integrating differential equations of motion (2.1) with a time step Δt, we evaluate the resulting interaction force Fi for the particle i as
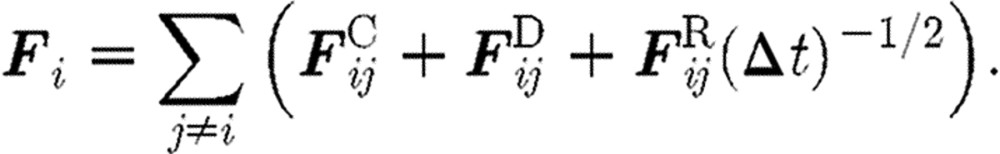 |
(2.9) |
The coefficient  multiplying the random force comes from the integration of the stochastic equations of motion (Español & Warren 1995). Groot & Warren (1997) gave a physical interpretation of this coefficient. They found that the spread of the random force increases if a given physical time interval is divided into more and more time steps. Thus, a step-size dependence of the random force is precisely generated by the coefficient of
  .
.
A ‘usual or common’ approach to perform the integration of differential equation (2.1) is to implement a simple Euler forward method. It was, however, shown that a so-called velocity Verlet algorithm (Groot & Warren 1997) gives more accurate results. The integration scheme for a time step n is as given in table 1, where the left upper indices n and n+1 correspond, respectively, to the start and end of time step. We note that the particle position  at the end of time step is calculated by the Euler forward method, while the force
  and velocity
  are determined with a use of a mid-step velocity
  .
.
Table 1.
The Verlet algorithm for integration of the DPD differential equations.
step 1: 
|
step 2: 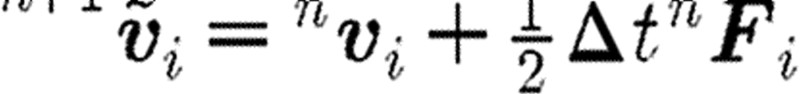
|
step 3: 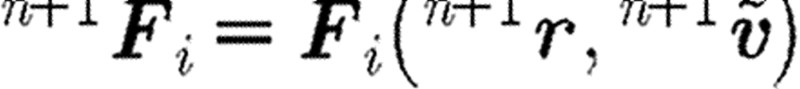
|
step 4: 
|
(d) DPD modelling of platelet adhesion to the wall
When an activated platelet comes close to the wall and if shear rate allows, it binds to the wall. However, when adhered platelets are exposed simultaneously to other forces stronger than the binding forces, the bonds break. To incorporate platelet adhesion to vessel walls, we introduce an attractive (bonding) force,  , in addition to the conservative, viscous and random interaction forces. As an approximation, we model the attractive force with a linear spring attached to the platelet's surface. The spring is attached to the vessel wall or to an already adhered platelet. The effective spring constant for platelet adhesion on the vessel wall, or to another stationary activated platelet, is denoted by kbw (figure 3).
Figure 3.

Platelet aggregation and adhesion. Activated platelets in the vicinity of an injured wall epithelium. Binding of platelets at the walls represented by springs and interaction forces for two aggregated platelets.
The additional parameter involved in the model is the size of the domain from the collagen-coated wall  for which the action of attractive force needs to be considered. We take the attractive force as
 |
(2.10) |
where Lw is the distance of the activated platelet from the wall.
Platelets are activated when some platelet agonists reach the level that is equal to or above threshold in the concentration around the platelets. Although platelet agonists are known to act synergistically (Ware et al. 1987), very little quantitative information is available about the kinetics of these interactions. Fogelson (1992) introduced a single agonist in his continuum platelet aggregation model. Sorensen et al. (1999a,b) analysed multiple platelet agonists, rather than single, as well as the possibility of agonist inhibition via a simplistic linear rate assumption. All agonists in this model have equal weight in determining the rate of platelet activation, with the approximation of time for activation to be 1 s. We here combine finite-element (FE) convective–diffusion equation in order to simulate local agonist concentrations. The governing equation for the concentration is
 |
(2.11) |
where ci denotes the concentration of agonist i; vx, vy and vz are the velocity components in the coordinate system x, y, z, calculated from the Navier–Stokes equations for velocity field; and Di is the constant diffusion coefficient of agonist i, while Si is the source term for agonist i. Therefore, we have the concentration of agonists around the platelets moving inside the plasma as well as around the platelet already adhered to the wall (Kojic et al. 2008b).
(e) DPD simulation protocol for modelling of platelet adhesion to the wall
Prior to the DPD calculations, we determine the agonist concentration by solving equation (2.11). We use the FE method and assume the steady-state flow conditions. The attractive force defined in equation (2.10) is scaled by a factor, between 0 and 1, proportional to the concentration at the space position of the considered platelet, where 1 corresponds to the maximum agonist concentration in the whole field.
The DPD simulation protocol was as follows.
Calculation of steady-state fluid flow by running corresponding time steps in DPD. This phase does not include platelets as particles.
After steady-state fluid flow is reached, platelet DPD particles were introduced at the inlet boundary.
At each time step, the displacement/velocity was calculated for each DPD particle (plasma or platelet) and those platelet particles that adhered to the wall within time step were identified.
The total number of adhered platelets was calculated along the vessel wall.
The inlet and outlet boundary conditions of the channel were updated.
Steps (iii)–(v) were repeated until the total time period of the analysis was reached.
The computed axial density distribution of adhered platelets was compared with the experimental results using the least-squares method.
Steps (iii)–(vii) were repeated by adjusting the effective spring constant (kbw) until the best fit with the experimental results was achieved.
3. Results
In this section, we first present modelling of plasma flow in a microchannel with narrowing (stenosis) and then platelet aggregation on the collagen surface inside a tubular chamber and inside a tubular expansion, using the DPD method.
(a) Example 3-1. Plasma flow in a microchannel with narrowing
Steady blood flow between two parallel plates with narrowing is considered (figure 4a). We investigate applicability of DPD to the modelling of stenosis inside microvessels. For the comparison, we also present the FE solution (Kojic et al. 1998). Parameters of both the FE and DPD models are given in the caption of figure 4.
Figure 4.
Steady blood flow in a channel with narrowing. (a) Geometry of the channel and velocity field. (b) Velocity profiles (FE (solid curves) and DPD (circles) solutions). Data: (1) FE model—density 1 g cm−3, dynamic viscosity 0.1 g cm−1 s−1; (2) DPD model—the conservative force parameter aij=25, and the dissipative force parameter γ=4.5. H=5 μm, L=0.5 μm, R=0.125 μm.
FE boundary conditions consist of the prescribed inlet parabolic velocity profile, which corresponds to the Poiseuille flow far from the stenosis, and zero traction at the outlet. For the DPD model, we use the prescribed inflow particle velocities of the parabolic profile, bounce-back boundary conditions for the walls and preserve a constant number of particles within the fluid domain.
Velocity profiles, in the region far and at the middle of stenosis, are shown in figure 4b. The solution using the DPD method compares well with the FE solution.
(b) Example 3-2. Platelet deposition in a perfusion chamber
To test application of the DPD method to thrombosis simulation, with the assumption about the wall attractive force, we model platelet deposition in a perfusion chamber. The model corresponds to the experiment of Hubbell & McIntire (1986), who measured platelet accumulation on a collagen wall after 120 s from heparinized whole human blood flowing between parallel plates under steady conditions. The flow is characterized by wall shear rates of 500 s−1 and 1500 s−1, while the entrance platelet concentration is 2.0×10⁸ ml−1.
A constant inflow flux of plasma and the entering platelet concentration are imposed. The flow domain is represented by a simple lattice with 10 000×100 particles and periodic boundary conditions along the direction of the fluid flow. The necessary external body force in the flow direction is used to reach wall shear rates of the experiments. The conservative force parameter is taken as aij=25 and the dissipative force parameter as γ=4.5 (see §2). It is taken that be the whole chamber gap (200 μm) for the calculation of the wall attractive force (equation (2.10)). The solid walls are modelled by freezing the DPD particles at the wall surface, without possibility of breaking the bond. We use the bounce-back boundary condition for particles that reach the walls (see §2, equation (2.8)).
The experimental results and the computed results for the adhered platelet distribution after 120 s for the shear rates of 500 s−1 and 1500 s−1 are shown in figure 5. It is found that the best fit of the numerical solution and experiment is achieved for the value of spring constant kbw=50 N m−1 (Filipovic et al. 2008a,b).
Figure 5.

Number of adhered platelets on collagen wall as predicted by computer modelling using the DPD method, and experimental results of Hubbell & McIntire (1986) after 120 s. (a) Shear rate at the wall=500 s−1 and (b) shear rate at the wall=1500 s−1. Circles, experimental; triangles, computed.
The results are also in agreement with the theoretical continuum-based solution of a diffusion-controlled transport of platelets over a very reactive surface (Kojic et al. 2008b).
(c) Example 3-3. Adhesion of platelet to collagen inside a tubular expansion
It is well known that platelet adhesion is increased in regions of disturbed flow, such as in the vortex downstream of a sudden expansion of vessel lumen. We analyse the blood flow inside a tubular expansion using a two-dimensional DPD model. The geometry of the model is shown in figure 6a. This problem was studied experimentally by Karino & Goldsmith (1979). In their experiments, they used a suspension of washed platelet with 5×10⁵ cells μl−1 and reconstituted blood with 20% haematocrit (2.5×10⁵ cells μl−1). We compare our DPD numerical results using Re=37.5, steady flow condition and platelet concentration of 5×10⁵ cells μl−1.
Figure 6.

(a) Basic geometrical data of the tubular expansion model, (b) streamlines from FE (solid curve) and DPD (squares), (c) DPD simulation and experimental results for the number of adhered platelets as a function of distance from the origin of expansion for Re=37.5. Solid curve, experiment (Karino & Goldsmith 1979); circles, DPD calculation.
The velocity profiles of plasma with constant platelet concentration are prescribed at the inlet and the outlet of the model in order to accelerate steady-state DPD solution for hydrodynamic macroscale behaviour. We first calculated the two-dimensional fluid flow field by the FE and DPD methods in order to verify the DPD solution for the considered tubular expansion conditions. The computational DPD model geometry is represented by a rectangular box with dimension 10 000×300 in the x, y directions, respectively, the first being the direction of the flow. At the inflow boundary, the velocity parabolic profile of plasma and platelet particles is prescribed, as shown in figure 6a.
At each time step, the total number of DPD particles (plasma+platelets) in the model is kept balanced. Some platelets are deposited at the bottom wall and some go out of the model. The concentration of platelets is kept constant by introducing the corresponding number of new platelets at the inlet flow at each time step. The no-slip conditions at the wall surface have been imposed using a simple bounce-back rule (Haber et al. 2006). The number of fluid particles used for this computation was 2 500 000, while 317 500 frozen particles were employed to simulate the walls and narrowed region (figure 6a). The results are obtained by subdividing the domain into 1000×400 bins. The computation was run over 300 000 time steps and the results were averaged over every 30 000 time steps. The CPU time for this calculation was 76 hours on INTEL Core 2 Duo E4500 2.2 GHz.
Karino & Goldsmith (1979) used various Re numbers and flow conditions (steady and pulsatile). Experimental results from Karino & Goldsmith (1979) and DPD simulation results for Re=37.5 and steady flow condition are shown in figure 6c.
The results show that immediately after tubular expansion, the number density of adhered platelets rapidly increases until approximately 4 mm and then starts to sharply decline until approximately 5.3 mm which corresponds to the reattachment point of the fluid. As a substantial flow divergence towards upstream and downstream occurs in the vicinity of the reattachment point, the number density of adhered platelets shows a local minimum. After this point, the number density of adhered platelets starts to increase again approaching an asymptotic constant value at the distal part of the tube. The spring constant of the platelet–vessel wall adhesion interaction as well as platelet–platelet interaction, which gives the best fit to the experiment, was kbw=70 N m−1. We used the least-squares criteria for the best fitting between computational and experimental results.
4. Concluding remarks
The most distinct feature of the DPD method, over the continuum-based methods, such as the FE method, is that the behaviour of each individual particle (plasma particle or platelet in our case) can be tracked in time sequence and thus can be analysed. This has a tremendous advantage over the traditional continuum-based methods in terms of studying its mechanical interaction, including binding, with soundings (i.e. sounding particles) in detail. The drawback of the DPD method, however, is that the simulation is currently limited within small spatial and time domains because DPD models require a very large number of particles (large number of equations). However, the DPD method may be used since platelet aggregation occurs within a local region of blood flow, where molecular and biochemical processes take place in micro time and micro length scales (e.g. Michelson 2002; Loscalzo & Schafer 2003).
DPD calculations generate a large system of equations (of the order of billions for a domain of millimetres in size), which needs to be solved successively over very small time steps (of the order of microseconds). This requires massive parallel computation and the application of the DPD method is currently limited to the simulation within small domains, such as those that exist in microvessels, and for a short period of time. An approach to overcome these limitations in the DPD thrombosis modelling is by using a multiscale modelling, where the classical FE analysis can be implemented over large blood vessel domain, while only a small clinically important zone is modelled by the DPD method (Kojic et al. 2008a).
We have demonstrated that the DPD method can be used in modelling platelet-mediated thrombosis. It is shown that not only the experimental findings of platelet accumulation to a collagen wall can be matched, but also the attractive interaction force acting on each platelet generated by the collagen surface can be quantified.
Acknowledgments
This research was supported by the Ministry of Science of Serbia, TR6209, OI144028 and National Heart, Lung and Blood Institute grants NIH HL054885, HL070542 and HL074022.
Footnotes
One contribution of 11 to a Theme Issue ‘The virtual physiological human: building a framework for computational biomedicine II’.
References
- Alkhamis T.M, Beissinger R.L, Chediak J.R.1988Red blood cell effect on platelet adhesion and aggregation in low-stress shear flow. Myth or fact?. ASAIO Trans. 34, 868–873. [PubMed] [Google Scholar]
- Alkhamis T.M, Beissinger R.L, Chediak J.R.1990Artificial surface effect on red blood cells and platelets in laminar shear flow. Blood. 75, 1568–1575. [PubMed] [Google Scholar]
- Badimon L, Badimon J.J.1989Mechanisms of arterial thrombosis in nonparallel streamlines: platelet thrombi grow on the apex of stenotic severely injured vessels. Experimental study in the pig model. J. Clin. Invest. 84, 1134–1144. 10.1172/JCI114277. [DOI] [PMC free article] [PubMed] [Google Scholar]
- Basmadjian D.1990The effect of flow and mass transport in thrombogenesis. Ann. Biomed. Eng. 18, 685–709. 10.1007/BF02368455. [DOI] [PubMed] [Google Scholar]
- Bluestein D, Gutierrez C, Londono M, Schoephoerster R.T.1999Vortex shedding in steady flow through a model of an arterial stenosis and its relevance to mural platelet deposition. Ann. Biomed. Eng. 27, 763–773. 10.1114/1.230. [DOI] [PubMed] [Google Scholar]
- Boryczko K, Dzwinel W, Yuen D.2003Dynamical clustering of red blood cells in capillary vessels. J. Mol. Model. 9, 16–33. [DOI] [PubMed] [Google Scholar]
- Chopard B, Ouared R, Rufenacht D.A.2006A lattice Boltzmann simulation of clotting in stented aneurysms and comparison with velocity or shear rate reductions. Math. Comput. Simul. 72, 108–112. 10.1016/j.matcom.2006.05.025. [DOI] [Google Scholar]
- Einav S, Bluestein D.2004Dynamics of blood flow and platelet transport in pathological vessels. Ann. N. Y. Acad. Sci. 1015, 351–366. 10.1196/annals.1302.031. [DOI] [PubMed] [Google Scholar]
- Español P, Warren P.1995Statistical mechanics of dissipative particle dynamics. Europhys. Lett. 30, 191–196. 10.1209/0295-5075/30/4/001. [DOI] [Google Scholar]
- Filipovic N, Ravnic D.J, Kojic M, Mentzer S.J, Haber S, Tsuda A.Interactions of blood cell constituents: experimental investigation and computational modeling by discrete particle dynamics algorithm. Microvasc. Res. 75, 2008a279–284. [DOI] [PubMed] [Google Scholar]
- Filipovic N, Haber S, Kojic M, Tsuda A.Dissipative particle dynamics simulation of flow generated by two rotating concentric cylinders. Part II: lateral dissipative and random forces. J. Phys. D Appl. Phys. 41, 2008b035 504. 10.1088/0022-3727/41/3/035504. [DOI] [PubMed] [Google Scholar]
- Fogelson A.L.1984A mathematical model and numerical method for studying platelet adhesion and aggregation during blood clotting. J. Comp. Phys. 56, 111–134. 10.1016/0021-9991(84)90086-X. [DOI] [Google Scholar]
- Fogelson A.L.1992Continuum models of platelet aggregation: formulation and mechanical properties. SIAM J. Appl. Math. 52, 1089–1110. 10.1137/0152064. [DOI] [Google Scholar]
- Fogelson A.L, Guy R.D.2004Platelet–wall interactions in continuum models of platelet thrombosis: formulation and numerical solution. Math. Med. Biol. 21, 293–334. 10.1093/imammb/21.4.293. [DOI] [PubMed] [Google Scholar]
- Fogelson A.L, Kuharsky A.L.1998Membrane binding-site density can modulate activation thresholds in enzyme systems. J. Theor. Biol. 193, 1–18. 10.1006/jtbi.1998.0670. [DOI] [PubMed] [Google Scholar]
- Groot R.D, Warren P.B.1997Dissipative particle dynamics: bridging the gap between atomistic and mesoscopic simulation. J. Chem. Phys. 107, 4423–4435. 10.1063/1.474784. [DOI] [Google Scholar]
- Guyton A.C.Textbook of medical physiology. In Saunders 8th edn.1991Philadelphia, PA:Saunders [Google Scholar]
- Haber H, Filipovic N, Kojic M, Tsuda A.2006Dissipative particle dynamics simulation of flow generated by two rotating concentric cylinders. Phys. Rev. E. 74, 046 701. 10.1103/PhysRevE.74.046701. [DOI] [PubMed] [Google Scholar]
- Harrison S.E, Smith S.M, Bernsdorf J, Hose D.R, Lawford P.V.2007Application and validation of the lattice Boltzmann method for modelling flow-related clotting. J. Biomech. 40, 3023–3028. 10.1016/j.jbiomech.2007.01.026. [DOI] [PubMed] [Google Scholar]
- Hubbell J.A, McIntire L.V.1986Technique for visualization and analysis of mural thrombogenesis. Rev. Sci. Instrum. 57, 892–897. 10.1063/1.1138830. [DOI] [PubMed] [Google Scholar]
- Karino T, Goldsmith H.L.1979Adhesion of human platelets to collagen on the walls distal to a tubular expansion. Microvasc. Res. 17, 238–262. 10.1016/S0026-2862(79)80002-3. [DOI] [PubMed] [Google Scholar]
- Karino T, Goldsmith H.L.1980Disturbed flow in models of branching vessels. Trans. Am. Soc. Artif. Intern. Organs. 50, 500–506. [PubMed] [Google Scholar]
- Karino T, Motomiya M.1984Flow through a venous valve and its implication for thrombus formation. Thromb. Res. 36, 245–257. 10.1016/0049-3848(84)90224-X. [DOI] [PubMed] [Google Scholar]
- Kojic M, Filipovic N, Slavkovic R, Zivkovic M, Grujovic N.PAK-finite element program for solid and fluid mechanics, heat transfer, coupled problems and biomechanics. In University of Kragujevac 1998Kragujevac, Serbia:University of Kragujevac [Google Scholar]
- Kojic M, Filipovic N, Tsuda A.A mesoscopic bridging scale method for fluids and coupling dissipative particle dynamics with continuum finite element method. Comp. Meth. Appl. Mech. Eng. 197, 2008a821–833. 10.1016/j.cma.2007.09.011. [DOI] [PMC free article] [PubMed] [Google Scholar]
- Kojic, M., Filipovic, N., Stojanovic, B. & Kojic, N. 2008b Computer modeling in bioengineering—theoretical background, examples and software. New York, NY: Wiley.
- Kuharsky A.L, Fogelson A.L.2001Surface-mediated control of blood coagulation: the role of binding site densities and platelet deposition. Biophys. J. 80, 1050–1074. [DOI] [PMC free article] [PubMed] [Google Scholar]
- Loscalzo J, Schafer A.I.Thrombosis and hemorrhage. In Lippincott Williams & Wilkins 3rd edn.2003Philadelphia, PA:Lippincott Williams & Wilkins [Google Scholar]
- Michelson A.D.2002San Diego, CA:Academic Press [Google Scholar]
- Resmi K.R, Varghese N, Krishnan L.K.2004Procedure for quantification of platelet adhesion to biomaterials by radioscintigraphy. Thromb. Res. 114, 121–128. 10.1016/j.thromres.2004.05.014. [DOI] [PubMed] [Google Scholar]
- Ruggeri Z.M.2000Old concepts and new developments in the study of platelet aggregation. J. Clin. Invest. 105, 699–701. 10.1172/JCI9604. [DOI] [PMC free article] [PubMed] [Google Scholar]
- Sorensen, E. N. 2002 Computational simulation of platelet transport, activation and deposition. PhD thesis, University of Pittsburgh.
- Sorensen E.N, Burgreen G.W, Wagner W.R, Antaki J.F.Computational simulation of platelet deposition and activation: I. Model development and properties. Ann. Biomed. Eng. 27, 1999a436–448. 10.1114/1.200. [DOI] [PubMed] [Google Scholar]
- Sorensen E.N, Burgreen G.W, Wagner W.R, Antaki J.F.Computational simulation of platelet deposition and activation: II. Results of Poiseulle flow over collagen. Ann. Biomed. Eng. 27, 1999b439–458. [DOI] [PubMed] [Google Scholar]
- Spieker L.E, Ruschitzka F, Badimon J.J, Noll G, Corti R.2004Shear stress-dependent platelet function after LDL cholesterol apheresis. Thromb. Res. 113, 395–398. 10.1016/j.thromres.2004.04.001. [DOI] [PubMed] [Google Scholar]
- Strong A.B, Stubley G.D, Chang G, Absolom D.R.1987Theoretical and experimental analysis of cellular adhesion to polymer surfaces. J. Biomed. Mater. Res. 21, 1039–1055. 10.1002/jbm.820210810. [DOI] [PubMed] [Google Scholar]
- Strony J, Beaudoin A, Brands D, Adelman B.1993Analysis of shear stress and hemodynamic factors in a model of coronary artery stenosis and thrombosis. Am. J. Physiol. 265, H1787–H1796. [DOI] [PubMed] [Google Scholar]
- Vander A, Sherman J, Luciano D.Human physiology: the mechanism of body function. In WCB McGraw-Hill 7th edn.1998Burr Ridge, IL:WCB McGraw-Hill [Google Scholar]
- Ware J.A, Smith M, Salzman E.W.1987Synergism of platelet-aggregating agonists. Role of elevation of cytoplasmic calcium. J. Clin. Invest. 80, 267–271. 10.1172/JCI113058. [DOI] [PMC free article] [PubMed] [Google Scholar]
- Yamazaki M, Uchiyama S, Xiong Y, Nakano T, Nakamura T, Iwata M.2005Effect of remnant-like particle on shear-induced activation and its inhibition by antiplatelet agents. Thromb. Res. 115, 211–218. 10.1016/j.thromres.2004.08.029. [DOI] [PubMed] [Google Scholar]