

Abstract
Advances in genetic engineering of non-pathogenic Escherichia coli (E. coli) have made this organism an attractive candidate for gene delivery carrier. However, proliferation and transport behaviors of E. coli in three-dimensional (3D) tumor environment are still unclear. To this end, we developed a novel microfluidics-based tumor model that permitted direct in situ visualization of E. coli in a 3D environment with densely packed tumor cells (B16.F10 or EMT6). The E. coli was engineered to co-express two proteins invasin and mCherry (inv+) so that they had the ability to enter mammalian cells and could be visualized via fluorescence microscopy. E. coli expressing mCherry alone (inv−) was used as the control counterpart. The inv− bacteria proliferated to a higher extent than inv+ bacteria in both the 3D tumor model and a 2D monolayer culture model. Meanwhile, the proliferation appeared to be tumor cell type dependent since bacteria did not proliferate as well in the EMT6 model compared to the B16.F10 model. These differences in bacterial proliferation were likely to be caused by inhibitors secreted by tumor cells, as suggested by our data from the bacterial-tumor cell monolayer co-culture experiment. The bacterial proliferation provided a driving force for cell spreading in the 3D interstitial space of tumors. These findings are useful for researchers to develop novel strategies for improvement of oncolysis or bacteria-mediated gene delivery in cancer treatment.
Keywords: bacterial delivery, three-dimensional tumor model, engineered bacteria, microfluidics, invasin
Introduction
Various bacterial species have been investigated as potential therapeutic agents for cancer treatment or carriers for therapeutic genes 1–7. Among them, Salmonella, Listeria, and Shigella have been successfully engineered for delivery of therapeutic genes 2, 7–16. Bacterial strains of Clostridia and Salmonella can selectively replicate in tumors for targeted cancer treatment 8, 10, 17–20. However, pathogenicity is a major concern and additional measures must be developed to attenuate these strains to reduce the possibility of systemic infection 10. For this reason, some attention has been focused on engineering non-pathogenic bacteria to target tumor cells 21–23.
One such genetic modification is the engineering of non-pathogenic bacteria, such as Escherichia coli (E. coli), to confer the normally non-invading bacterial species with the ability to penetrate into non-phagocytic mammalian cells 1, 21, 24–27. The approach is based on transfection of E. coli with inv gene isolated from Yersinia pseudotuberulosis that encodes invasin, a 103 kDa protein, expressed on the outer membrane of bacteria that can bind specifically to β1 integrins on the surface of mammalian cells 24, 28, 29. Studies highlighting the ability of invasin-expressing E. coli to infect tumor cells and transfer therapeutic genes have been conducted in two-dimensional monolayers 1, 24, 25 and in solid tumor models in vivo 25. Furthermore, progress has been made in the direction of engineering E. coli to exhibit tumor targeting capability by responding to microenvironmental cues 1. With the advances in engineering E. coli as a gene carrier to tumors, it has become more important to understand the intratumoral transport mechanisms of this bacterial species. However, there is no study to date that has investigated the proliferation behavior of E. coli in a three-dimensional (3D) tumor environment. Compared to the 2D counterparts, 3D models contain interstitial space between cells that is critical for extracellular transport studies. They can also more closely imitate the microenvironment observed in native tissues since 3D cell-cell interactions can have significant effects on properties, behaviors, and functions of cells 30–35. Furthermore, 3D models with high cell density would provide more realistic barriers to bacterial transport observed in tumor tissues.
To gain insight into effects of the 3D tumor environment on the ability of E. coli to propagate throughout tumor tissues, we developed a novel 3D in vitro tumor model based on a microfluidic system 36. Microfluidic systems have been developed to mimic tumor microenvironment in previous studies of cell migration and drug and bacterial delivery 37–39. The existing approaches to 3D culture of mammalian cells in microfluidic systems utilize hydrogels to provide 3D structures 40–45, the gels added for providing extracellular matrix (ECM) differ from those produced naturally by cells themselves. Additionally, the use of hydrogels for cell packing sacrifices the ability to achieve a high in vivo-like cell packing density since cells are now separated by the polymeric matrix. Therefore, our new model did not use gels to achieve 3D packing of cells. The main advantage of this model was that it afforded simultaneously a high density of tumor cells and easy manipulation of tumor microenvironment and cell-cell interactions observed in tumor tissues in vivo. Furthermore, the new model allowed continuous perfusion of tumor cells while permitting direct in situ microscopic visualization of bacterial and tumor cells, a luxury that was not as easily achieved with most animal models or other in vitro 3D models such as tumor spheroids or multicellular layers 31, 46–54.
The goal of this study is to investigate effects of invasin expression and tumor cell type on the proliferation behavior of E. coli. Using the new 3D tumor model, we investigated the proliferation behavior of non-invasin-expressing (inv−) E. coli which does not invade non-phagocytic cells and the invasin-expressing (inv+) version of the same bacteria which can invade mammalian cells 24, 26, 28, 55. Two tumor cell lines were used in this study – B16.F10 (mouse melanoma) and EMT6 (mouse mammary carcinoma). Using an immunofluorescence technique, a previous study showed that both cell lines expressed α5β1 on the cell surface although the expression level was lower in B16.F10 cells than in EMT6 cells 56. The findings of this study suggested that bacterial proliferation depended on interactions of invasin with β1 integrins and that tumor cells could secrete inhibitors to reduce bacterial proliferation. This information would be useful for engineering bacteria-mediated gene delivery and control of bacterial population dynamics in tissues.
Results
The design of the microfluidic system is shown in Figure 1. Tumor cells stained with calcein-AM were mixed with mCherry-expressing E. coli and then loaded into the central channel. Immediately after the cell loading, only a few E. coli cells could be observed in the image (see Figure 2). The bacterial cell density was low, compared to the density in the initial cell suspension, because of the washout of bacteria into the outer channels during the cell loading. The fraction of bacterial cells left in the central channel was small but reproducible as suggested by the experimental data of final bacterial concentration at the end of the 12-hr incubation period to be discussed later. The tumor cells in the central channel exhibited rounded morphology (see Figure 2), since they were initially suspended as single cells in the medium. This morphology was dramatically changed over the 12-hr incubation period as shown in Figure 3, although the density of tumor cells was minimally changed. They became elongated and enlarged. As a result, the inter-cellular space decreased significantly. During the same period, the number of bacterial cells increased rapidly through proliferation. Most bacteria, including inv+ cells, accumulated outside the tumor cells. Proliferation appeared generally uniform throughout the cell channel. However, bacterial proliferation depended on invasin expression and tumor cell type (see Figure 3).
Figure 1.

The schematic of three-dimensional tumor model based on a microfluidic system. The device contained three channels. Each was 30 μm in height. The width of the central channel was 100 μm, and the widths of outer channels were 200 μm each. The space between adjacent micro-posts was 4 μm. The dimension of the square micro-posts was 50 μm. Bacterial and tumor cells were loaded into the central channel. The outer channels were perfused with cell culture medium. The open circles represent outlets on the left and inlets on the right.
Figure 2.
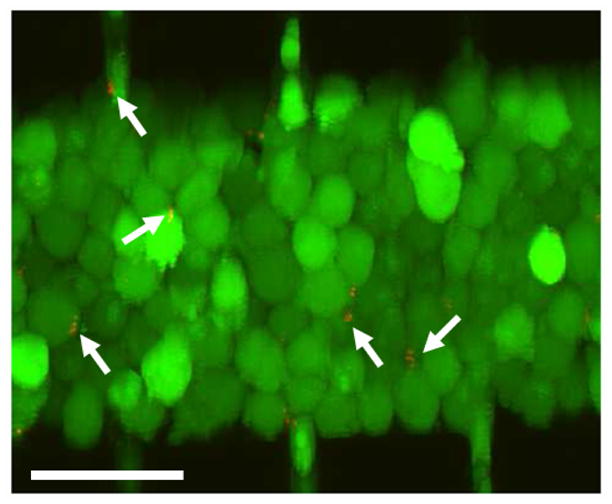
Stacked optical slices showing distributions of B16.F10 and E. coli cells immediately after they were loaded into the microchannel. The tumor cells were stained with calcein-AM (green) and mCherry-expressing E. coli cells were red (arrows). Scale bar = 50 μm.
Figure 3.

Confocal images of calcein-AM-stained tumor cells (green) following overnight co-culture with mCherry-expressing E. coli (red) with (inv+) or without (inv−) invasin co-expression. The figure shows three representative images of the B16.F10 model in Panel (a) and three representative images of the EMT6 model in Panel (b). Two images in Panel (b) had a higher magnification compared to other images in order to show details of interstitial and intracellular distributions of E. coli. Scale bars in all images represent 20 μm.
Bacterial cell proliferation in B16.F10 tumor model
Microscopic observation shown in Figure 3a revealed a remarkable difference in the distribution and concentration of inv− versus inv+ bacterial cells in the presence of the densely packed B16.F10 cells. Proliferation appeared to be more extensive for inv− bacteria compared to inv+ bacteria shown in the same figure. This difference in proliferation between inv+ versus inv− bacteria was not observed when the E. coli cells were cultured overnight under normal conditions, in the absence of tumor cells. It was observed that the final concentrations (bacterial cell number per unit μl) were 4.2±2.2×10⁶ (n = 9) in the inv+ bacterial sample and 3.8±1.8×10⁶ (n = 9) in the inv− bacterial sample. They were statistically the same (p > 0.5, Mann-Whitney U test).
The inv− bacteria cultured in the microfluidic system appeared to be distributed throughout the tumor cell compartment. Unlike the case of tumor cells co-cultured with inv+ bacteria, few tumor cells appeared to retain the calcein dye, indicating that the higher proliferation of inv− bacteria caused cell death or loss of membrane integrity in tumors. The calcein-stained areas also appeared to be smaller than the size of tumor cells infected with inv+ E. coli, suggesting that the calcein dye retained in the regions was localized mainly inside cell nuclei. This massive tumor cell death did not occur in every region of the samples. It occurred only in regions with high bacterial cell densities following the 12-hr culture period. The heterogeneity in bacterial cell density was likely to be caused by non-uniform initial bacterial distribution since we could not control it due to washing out of bacterial cells during cell loading as mentioned above. This initial non-uniformity would then be amplified significantly when bacterial cells proliferated rapidly during the 12-hr incubation period. Regions that had low initial bacterial cell density were less likely to develop high concentrations of bacteria after the 12-hr culture period. Figure 3a shows the regions with the most dramatic bacterial proliferation; and a quantitative analysis of all samples will be described later.
Bacterial cell proliferation in EMT6 tumor model
The experiments described above with B16.F10 cells were repeated using EMT6 cells. Distribution of bacterial cells in the EMT6 model is shown in Figure 3b. After 12 hrs of co-culture of tumor cells with inv+ E. coli, bacterial cells did not appear to proliferate as uniformly as they did in the B16.F10 model. There were regions with a profusion of bacterial cells but other regions devoid of bacteria. Generally, the EMT6 cells, which had been stained with calcein-AM prior to mixing with bacterial cells, did not appear to retain the fluorescent dye as well as the B16.F10 cells did. The dye loss was unlikely to be caused by bacteria-mediated tumor cell death (see the data discussed below). One potential mechanism for the dye loss was that calcein in EMT6 was secreted by P-glycoprotein 57, a molecular pump related to multidrug resistance. Confocal microscopy examination also revealed that some tumor cells were highly infected with bacterial cells while some adjacent cells internalized only 2 or 3 bacteria or none at all.
Proliferation of inv− E. coli in the EMT6 model after the overnight incubation was evident as shown in Figure 3b, though not as pervasive as in the B16.F10 model (see Figure 3a). The distribution of bacterial cells was non-uniform throughout the central channel, which was similar to the results of inv+ E. coli. The contrast between inv+ and inv− groups was not dramatic in the EMT6 model as compared with the B16.F10 model. There was no noticeable difference in the retention of calcein (green fluorescence dye) by EMT6 cells after they were co-cultured with inv+ versus inv− bacteria.
Viability staining of tumor cells after bacterial infection
After 12-hr co-incubation of tumor cells with inv+ or inv− E. coli, CellTracker Green CMFDA was used to assess tumor cell viability. This molecule functions via a similar principle to calcein-AM where fluorescence is activated by enzymatic cleavage in viable cells. However, it was found to be much more effective than calcein-AM at staining the densely-packed tumor cells in situ and could penetrate the entire width of the cell culture region while calcein-AM provided only a peripheral staining. This difference in penetration depth was presumably because CellTracker Green CMFDA is a smaller molecule than calcein-AM. The results of staining are shown in Figure 4. Both B16.F10 and EMT6 cells co-cultured with inv+ bacteria exhibited strong green fluorescence after staining, indicating that the tumor cells were still alive despite the overnight co-culture with E. coli. However, co-culture with inv− bacteria caused a significant reduction in the viability of tumor cells, especially in regions with high bacterial concentration. Furthermore, the distribution of live tumor cells in the central channel was tumor cell type dependent. In the B16.F10 model, the live and dead cells formed large, continuous regions in which the density of inv− bacterial cells was inversely correlated with the intensity of green fluorescence from live cells (see Figures 4b1 and 4b2). In the EMT6 model, the distribution of live tumor cells was discontinuous. They appeared to be isolated spots (see Figure 4d1), which was in contrast with the distribution of the live EMT6 cells co-cultured with inv+ bacteria (see Figure 4c). Individual EMT6 cells, stained strongly with the CellTracker Green dye, could be observed throughout the entire central channel.
Figure 4.

Confocal images of B16.F10 (a, b) and EMT6 (c, d) cells stained with CellTracker Green CMFDA for visualization of cell viability following 12-hr co-incubation with mCherry-expressing E. coli (red). E. coli cells were either co-expressing invasin (inv+) (a, c) or expressing mCherry alone (inv−) (b, d). To clearly demonstrate inv− bacterial proliferation-induced tumor cell death, red and green fluorescence channels in images b and d were split into two images to show distributions of live tumor and bacterial cells separately. They are denoted as b1 (green channel of b), b2 (red channel of b), d1 (green channel of d), and d2 (red channel of d).
Bacterial concentration profiles
To quantitatively analyze the distribution of bacterial cells in tumor models, fluorescence intensity profiles, determined by distributions of bacteria expressing mCherry, were measured in fluorescence images taken at three different positions of the central channel – the region nearest to the dead end, the middle portion, and the region nearest to the inlet. The intensity profiles were generated by subtracting the background intensity, which was measured at the micro-posts, from the fluorescence intensity in the cell compartment. Figure 5 shows typical profiles generated for B16.F10 and EMT6 models. In the B16.F10 model, the intensity profiles at different locations along the channel were similar in shape and magnitude, indicating a relatively uniform distribution of bacteria. However, concentration profiles of bacteria in the EMT6 model demonstrated wide variability, indicating that bacterial cell distribution was non-uniform.
Figure 5.

Typical mean fluorescence intensity profiles of mCherry-expressing E. coli after 12-hr co-incubation with B16.F10 (a, b) and EMT6 (c, d) cells in microchannels. Bacteria were either non-invasin-expressing (inv−) or invasin-expressing (inv+). Individual curves represent fluorescence profiles at the dead end, the middle portion, and the inlet of the central channel.
The intensity profiles shown in Figure 5 were averaged for each microchip and the results from three trials are shown in Figure 6. Overall, proliferation of inv− E. coli was slower in the EMT6 model than in the B16.F10 model. The difference was more pronounced for the inv+ case, where the average fluorescence intensity in the B16.F10 model was approximately six times as high as that in the EMT6 model. These data and the confocal images shown in Figure 3 also demonstrated a higher prolificacy of inv− bacteria compared to inv+ ones. The narrow spread of data points for each sample type demonstrated the reproducibility of experimental data, which also suggested that the fraction of bacterial cells left in the central channel immediately after cell loading did not vary significantly in repeated trials.
Figure 6.
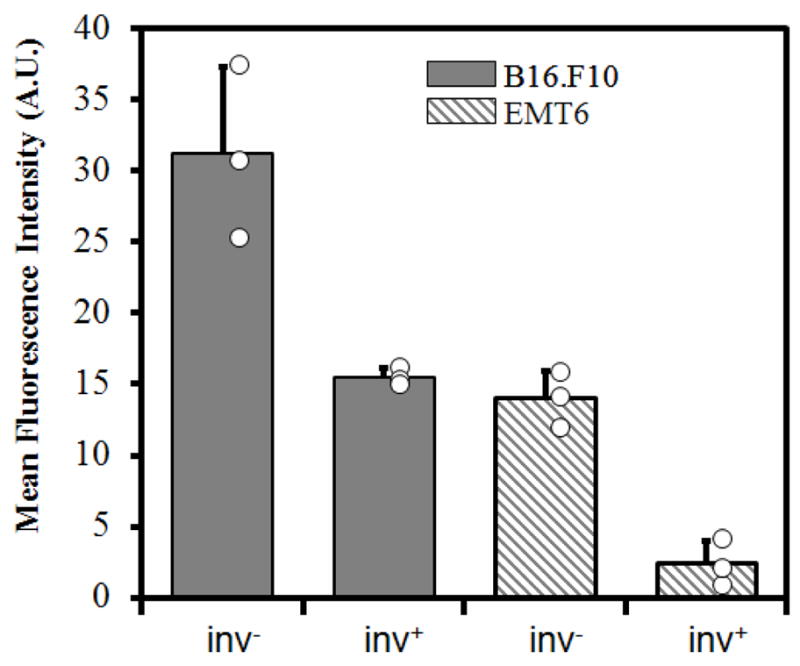
Average fluorescence intensities. The intensity profiles shown in Figure 5 were averaged to obtain the mean fluorescence intensity of each channel. The open circles represent the intensities of individual samples, and the bars and the error bars represent means and standard deviations over three trials, respectively.
Factors secreted by tumor cells and their effects on bacterial cell proliferation
To further investigate how bacteria proliferation was affected by tumor cells, 6-well plate assays were performed to determine the rate of bacterial cell proliferation in the presence of tumor cell monolayers or their conditioned media. OD600, which was directly proportional to bacterial cell concentration, was measured for samples taken from each well after a 4-hr incubation period. The change in OD600, ΔOD, of each sample over the incubation period was normalized by the ΔOD in control wells over the same period. The data are summarized in Figure 7a. Bacteria concentrations were significantly lower in EMT6-conditioned media than B16.F10-conditioned media for both inv+ and inv− E. coli (p < 0.02). In both conditioned media, the proliferation of inv− bacteria was reduced more significantly than that of inv+ bacteria. In fact, the proliferation of inv+ bacteria was unchanged in B16.F10-conditioned media compared to the control.
Figure 7.

Proliferation and cellular uptake of bacteria co-cultured with tumor cell monolayers or cultured in tumor cell conditioned media. (a) Average increase in OD600 of media in 6-well plates after 4-hr static incubation of E. coli with (inv+) or without (inv−) invasin expression. The bacteria were incubated in the presence of tumor cell conditioned media (CM), tumor cell monolayers (ML), or fresh media (control). The average increases in OD600 (ΔOD) in the CM or ML group were normalized by the data in the control group. The brackets indicate the data pair to be significantly different (p < 0.02). (b) Confocal microscopic images of B16.F10 and EMT6 cells in monolayers stained with Calcein-AM after a 4-hr co-incubation with invasin-expressing (inv+) and non-invasin-expressing (inv−) E. coli. Scale bar = 50 μm.
Contrary to the data from the conditioned media, co-culture of bacteria with a monolayer of either EMT6 or B16.F10 cells in fresh media for 4 hours resulted in a higher concentration of inv− bacteria than inv+ bacteria. The concentration difference was unlikely to be caused by tumor cell uptake of bacteria because the amount of E. coli in the medium above the monolayers was much more than that internalized by tumor cells, indicating that the concentration difference in the medium was mainly due to the difference in bacterial proliferation. This difference was particularly prominent for the B16.F10 monolayer group, where the concentration of inv+ bacteria appeared to be less than a third of the inv− counterpart. However, this drastic difference in proliferation between inv+ and inv− bacteria was not observed during normal bacterial cell culture without tumor cells (see the data shown above), indicating that the difference was possibly caused by chemical inhibitors in the medium released by tumor cells. Figure 7a also shows that there was no significant difference between the proliferation rates of inv− bacteria in the presence of B16.F10 and EMT6 monolayers, respectively, suggesting that release of the inhibitors depended on receptor-ligand interactions between bacterial and tumor cells.
To visualize the interactions, confocal images of tumor and bacteria cells were taken after a 4-hour co-incubation. The images shown in Figure 7b demonstrated intracellular accumulation of inv+ E. coli in both B16.F10 and EMT6 cells; and the distribution of bacteria was heterogeneous in both images. However, few inv− E. coli cells could be internalized by tumor cells since they did not express the ligand for β1 integrin receptors. These bacteria remained primarily in the extracellular media but could adsorb on the surface of monolayers through non-specific interactions.
Discussion
The use of a newly developed in vitro tumor model made it possible, for the first time, to compare the spreading of inv+ versus inv− bacteria in a 3D tumor-like environment. Previous studies have already shown that compared to 2D models, 3D tissue models create a cellular microenvironment that more accurately mimics the native tissue microenvironment 30, 35, 58–61. Because environmental cues can have significant effects on properties, behaviors, and functions of cells, the use of this 3D tumor model to study the proliferative behavior of E. coli could provide profound insights into effects of a cell-dense, 3D tumor environment on the ability of this bacterial species to spread in a solid tumor in vivo.
Data from the study indicated that both inv+ and inv− E. coli could effectively spread in the interstitial space of tumors; and the extent of spreading depended on tumor microenvironment and expression of invasin that facilitated binding of bacteria to β1 integrin receptors on tumor cell membrane. The data also showed that both B16.F10 and EMT6 cells secreted factors that could reduce the rate of bacteria proliferation; and the amounts of secretion were higher when tumor cells were co-cultured with inv+ E. coli, compared to those by tumor cells co-cultured with inv− E. coli. While internalization of inv+ bacteria by tumor cells was observed in the study, the majority of bacterial cells remained in the interstitial space. After 12-hr incubation, tumor cells were still alive in regions with bacteria at low density. In regions with high bacterial density, few viable tumor cells were observed.
Bacterial proliferation during co-culture with tumor cells
As previously mentioned, bacteria harboring the inv gene proliferated at a rate similar to inv− E. coli when cultured under normal conditions in the absence of tumor cells. However, upon incorporation into the tumor models, dramatic differences in proliferation were observed between inv+ and inv− E. coli. Most inv+ E. coli cells appeared to accumulate in the interstitial space and on the outer membrane of tumor cells, as revealed by confocal microscopy of micro-channels, suggesting that they proliferated primarily in the narrow intercellular regions. Only a small fraction of inv+ E. coli cells were observed within tumor cells, indicating that while they could indeed be internalized by tumor cells, it is unlikely that intracellular bacteria proliferated appreciably. The inv− E. coli cells in the 3D tumor models were not internalized and remained in the interstitial space, proliferating to a greater extent than inv+ E. coli in both tumor models (see Figures 3 and 6). The results suggested that the enhanced tumor cell-bacteria interactions, afforded by the expression of invasin, might have reduced the proliferative capacity of inv+ bacteria.
To further explore mechanisms of the proliferation difference between inv+ and inv− E. coli, bacterial density was quantified after a 4-hr culture period in the presence of tumor cell monolayers or tumor cell conditioned media (with no tumor cell present). The data shown in Figure 7 demonstrated that the growth of inv+ E. coli was less sensitive to chemicals present in the conditioned media than inv− E. coli. In fact, inv+ E. coli proliferation in B16.F10-conditioned media was not significantly different from that in fresh medium.
In contrast, inv+ E. coli grew slower in the presence of tumor cell monolayers than inv− E. coli, which was consistent with the observations in the 3D tumor models. Internalization or binding of inv+ E. coli to tumor cells could contribute to but would not completely account for the drastic decrease in extracellular bacterial concentration since only a small fraction of bacteria could be taken up by tumor cells in the experiment. A more possible explanation was that both types of tumor cells might be actively secreting chemicals that were toxic to bacteria or inhibitory to bacterial proliferation, and that this secretion was enhanced in the inv+ case where invasin bound to β1 integrins that were constitutively expressed on the membrane of both B16.F10 and EMT6 cells 2, 24, 56. Therefore, the slower proliferation of inv+ E. coli observed in both the 2D and 3D tumor cell cultures was likely because inv+ bacteria stimulated tumor cells to secrete more growth inhibitors or new, more potent inhibitors via interactions with β1 integrins (see Figure 8). Data shown in Figure 7a further support this hypothesis, since there was no significant difference in the proliferation of inv− in the presence of the monolayer versus conditioned media. Examples of the inhibitors may include pro-inflammatory cytokines in response to bacterial cell invasion 62, and reactive oxygen species produced as a defensive response to bacterial infection. The fact that the proliferation of inv− bacteria in the presence of monolayers was cell-type independent while proliferation of inv+ bacteria significantly differed between cell types, further supported the notion that ligand-receptor interactions were involved in the inhibition of inv+ bacterial proliferation. Further studies will need to be conducted to identify the substances that diminish bacterial cell viability or proliferation.
Figure 8.
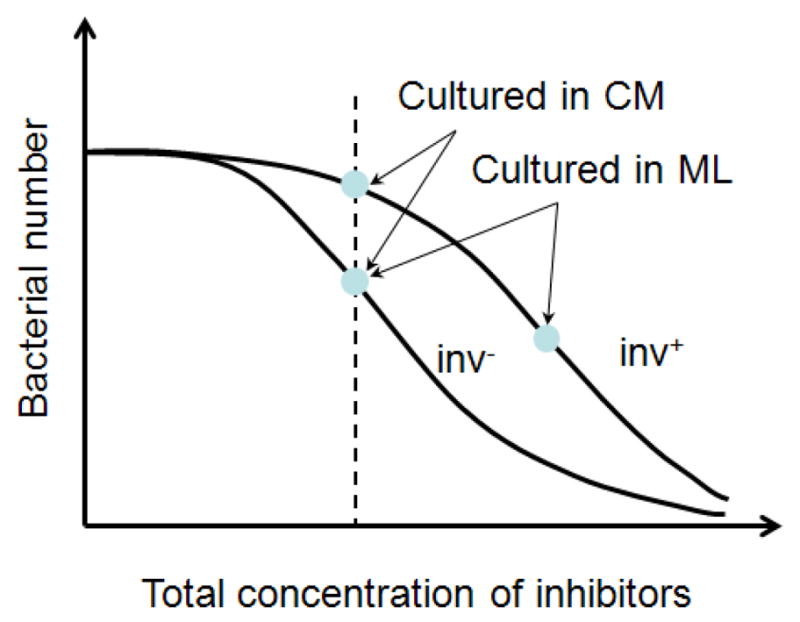
Schematic of bacterial responses to growth inhibitors secreted by tumor cells. It was observed that there was minimal difference in proliferation rates between inv+ and inv−E. coli under normal conditions in the absence of tumor cells. Data in Figure 7 show that inv− E. coli was more sensitive to the inhibitors than inv+ E coli in tumor cell conditioned media (CM). However, there was minimal difference in concentrations of inv− E. coli between the CM group and the monolayer (ML) group, suggesting that the growth rates of inv− E. coli under these two conditions were similar to each other. However, the growth of inv+ E. coli was significantly slower in the presence of tumor ML than in CM, suggesting that interactions between invasin and β1 integrins might stimulate tumor cells to release more of the same inhibitors or new, more potent inhibitors.
Another interesting observation in this study was that the concentration of bacteria was lower in the media retrieved from EMT6 culture than B16.F10-conditioned media for both inv+ and inv− bacteria, implying that EMT6 tumor cells might be releasing a higher concentration of toxic factors or more potent inhibitors, than B16.F10 cells. Additional studies are needed to determine the extent to which specific anti-microbial factors are possibly being secreted by different tumor cells.
Extracellular and intracellular spreading of E. coli cells
Despite the initial low concentration after being loaded into the microchannel (see Figure 2), the bacterial cells appeared to have spread throughout the entire microchannel with densely packed tumor cells after the 12-hr incubation period. Also, bacteria were more uniformly distributed in B16.F10 model than in EMT6 model at the 12-hr time point. Potential explanations for this difference are as follows. During the cell loading, it appeared that EMT6 cells were less able to conform to fill small void spaces in the central channel than B16.F10 cells. This resulted in apparently larger void spaces between EMT6 tumor cells immediately after loading compared to freshly loaded B16.F10 cells. Hence, one potential explanation for the more irregular distribution of bacteria in the EMT6 model after the 12-hr culture is that bacteria might have simply proliferated to a higher extent in regions that were initially the void spaces, suggesting that the physical barrier presented by tumor cells reduced the proliferative capability of E. coli.
While the larger void spaces present immediately after EMT6 cells loading may have better facilitated E. coli proliferation, these larger spaces may have also contributed to the lower total bacterial concentration in the EMT6 model at the 12-hr time point, compared to the B16.F10 model. This was because bacteria were able to escape from the cell compartment and enter the side channels via convection during the cell loading, i.e., the washout effect discussed above. The convection was less restricted in the EMT6 model because of the presence of larger void spaces between tumor cells in the central channel. As a result, the bacterial density in the microchannel immediately after cell loading was possibly lower in the EMT6 model than in the B16.F10 model, thereby leading to the lower total bacterial concentration after the 12-hr culture period in the EMT6 model. In the future, it would be helpful to compare the cell volume fraction of various tumor cell types in the microchannel to determine the effect of void spaces on the distribution patterns of bacteria.
The driving force for bacterial spreading was likely to be generated from bacterial growth since the bacterial strain, MC4100, used in this experiment is non-motile due to a known flagellar defect 63. However, even motile bacteria cannot swim in the narrow interstitial space 64. Flagella-independent twitching, driven by forces generated through retraction of Type IV pili 65, 66, could also contribute to spreading of some bacterial cells, but the cells used in this study do not have this molecular machinery when cultured under standard laboratory conditions 67.
The high prolificacy of the inv− bacteria in the 3D tumor models suggested that inv− bacteria could be an attractive candidate for delivery of therapeutic proteins to the extracellular space. By programming the bacterial vector to express a desired therapeutic protein, it may be possible to achieve effective levels of the protein without the need for bacterial cell invasion into tumor cells. A possible drawback to the high proliferative capacity of the inv− bacteria is the increased immunogenicity, but this problem could be minimized in the near future by exploiting phenomena such as quorum sensing for bacterial population control or targeted delivery of bacteria to tumors 1, 68. Advances in the field of synthetic biology have made it possible to design gene circuits to control bacterial behavior and allow bacteria to respond specifically to environmental cues in solid tumors.
While invasin-expressing E. coli has been shown to successfully deliver functional DNA to the cytoplasm of tumor cells 4, 27, it has been found to be more efficient in the delivery of proteins (by expressing genes controlled by prokaryotic promoters) rather than the delivery of genes for expression by mammalian cells 21, 25. These findings may support our visual examination of bacterial cell distribution within tumor cells in the 3D model. The inv+ E. coli internalized by B16.F10 cells in the 3D model were primarily localized near the plasma membrane, suggesting that the intracellular transport of bacteria could be significantly hindered by barriers formed by cytoskeleton and other organelles.
The uptake of inv+ bacteria by tumor cells depended on expressions of β1 integrin receptors. Data in the literature show that there is a correlation between receptor concentration and inv+ bacteria affinity to the plasma membrane of many cell types 69. Immunofluorescence staining assays suggested that EMT6 cells in 2D culture expressed a slightly higher level of α5β1 integrin than B16.F10 cells 56. However, Isberg and colleagues have shown that multiple integrin subunit structures, namely α3β1,α4β1, α5β1, and α6β1, are receptors for invasin and that different mammalian cell types may predominantly express different integrins 55. It has also been demonstrated in mouse melanoma and mammary carcinoma tissues that β1 integrin receptor expressions can be further affected by the stage of tissue differentiation 70, 71. Further studies are required to characterize the composition and density of specific β1 receptors expressed by B16.F10 and EMT6 cell lines in both 3D and 2D models.
Viability of tumor cells co-cultured with bacteria
Tumor cells infected with inv+ bacteria maintained viability after the 12-hr incubation in the microchannel. This was in agreement with previous studies, in which tumor cells infected with inv+ E. coli maintained viability in vitro for > 72 hrs 25. However, cells co-cultured with inv− bacteria showed more compromised viability in the 3D models. The reduced viability was possibly due to the fact that inv− bacteria proliferated more extensively and may have consumed more of the available nutrients supplied via the perfusion of the side channels.
In summary, this study elucidated effects of invasin expression and tumor cell type on bacterial cell proliferation behaviors. It was observed that bacteria could proliferate and spread effectively in the 3D tumor models in vitro. The proliferation in both 2D and 3D cultures could be inhibited by chemicals secreted by tumor cells, and the secretion was likely to be enhanced through interactions between invasin and β1-integrins. In the absence of tumor cells, these chemicals had stronger effects on proliferation of inv− E. coli than inv+ cells. In 3D tumor models, bacteria were more uniformly distributed in B16.F10 model than in EMT6 model. Future efforts can be directed toward increasing the culture period to give tumor cells more time to secrete ECM components and thus better mimic the additional barrier, presented by the ECM, to bacterial spreading. The valuable information gained could be helpful in designing bacteria-mediated gene delivery systems for anti-cancer therapy. In addition, the microfluidics approach would be an ideal platform for determining the efficiency of bacteria-based drug or gene delivery systems.
Materials and Methods
Microfluidic device fabrication
The schematic of the microfluidic device is shown in Figure 1. All channels were 0.25 cm in length and 30 μm in height. A layer of square micro-posts was placed on either side of the central channel to serve as a barrier for cell retention in the central channel. The outer channels were used for media supply. It should be mentioned that the channel height is not limited to 30 μm in this design which was suitable for confocal microscopy. For microfluidic systems with higher channels, two-photon microscopy is a better choice than confocal microscopy for 3-D imaging of cell distributions.
Standard procedures were used in the fabrication of the microfluidic device. In brief, the pattern shown in Figure 1 was designed using AUTOCAD software and used to make a chrome mask. Negative photoresist SU-8 3035 (MicroChem Corp, Newton, MA) and photolithography techniques were used to prepare the silicon template from the chrome mask. After preparing the template, the height of the photoresist on the silicon wafer (30 μm) was verified using NanoSpec 210 (Nanometrics, Milpitas, CA). The template was then replica-molded with poly(dimethylsiloxane) (PDMS) (Dow Corning USA, Midland, MI) to obtain microfluidic channels and micro-posts. After curing PDMS at 60°C for 1 hr, 3 inlets and 2 outlets were cored using a razor-sharp 20G round punch (Technical Innovations, Angleton, TX). The prepared PDMS chips were then sterilized by submerging in 70% ethanol for 5 min, rinsing with sterile water, and allowing to air dry completely under a sterile hood. The PDMS was then bonded to sterilized glass coverslips and placed in a 100°C oven overnight to improve bonding strength. It was found that oxygen plasma treatment was not necessary for sufficient bonding in this study. At each inlet of the completed device, ½-inch 23G stainless steel tubing was inserted; and flexible polyethylene tubing was used to connect the stainless steel tubing and 5-ml syringe via standard 23G luer stubs.
To prepare for cell loading, the devices were first vacuum-filled with sterile phosphate-buffered saline (PBS) to remove air from micro-channels. While still submerged in sterile PBS, a 1:1 mixture of collagen type 1 from calf skin (C8919, Sigma-Aldrich, St. Louis, MO) and 100% ethanol was infused by hand into each of the two outer channels of the device, one channel at a time. Inlets and outlets for the channels not being infused were blocked to prevent the escape of the collagen mixture into the central channel. Once each outer channel was filled with the collagen solution, the entire device, submerged in PBS, was incubated at 37°C for 30 min.
Plasmid and bacterial strain
The engineered bacteria used in this study were the MC4100 strain of E. coli carrying the plasmid placCherry-Inv or placCherry. The placCherry-Inv plasmid contained the inv gene encoding invasin from Y. pseudotuberculosis, and the genes encoding kanamycin resistance for selectivity and mCherry for enabling red fluorescence detection of bacterial cells. The placCherry plasmid was similar to placCherry-Inv, except that the inv gene was deleted. All bacterial cells harbored either the placCherry-Inv (inv+) or placCherry (inv−) plasmid.
To characterize the invasiveness of these bacteria, 106 B16.F10 cells were first added into each well of a 6-well plate containing 1.5 ml DMEM supplemented with 10% FBS. Cells were cultured in the wells overnight at 37°C, 95% air, and 5% CO2 to allow them to form a ~ 90% confluent monolayer. The culture medium in each well was then replaced with 1 ml fresh medium supplemented with kanamycin (50 μg/ml) before adding 50 μl of either inv+ or inv− overnight bacterial suspension with OD600 being 0.8 to 1.0. A gentamicin protection assay was then used to quantify internalized bacterial cells. Briefly, after incubating the plates for 2 hrs, the monolayers were washed 3 times with DMEM and then incubated with gentamicin (100 μg/ml) for 1.5 hrs. At the end of incubation, the monolayers were washed 3 times with PBS and trypsinized to form single tumor cell suspensions. The tumor cells were lysed with 1% Triton X100 in PBS and lysate was plated on kanamycin-supplemented agar plates at dilutions of 103, 104, and 105 for a 24-hr incubation period at 37°C. The colony forming units (CFUs) were then counted to determine the infection efficiency of the bacteria, which was defined as the percentage of the number of CFU relative to the total number of the same bacterial cells inoculated into a well. In an experiment using B16.F10 cells, it was observed that the infection efficiencies were 12.5% ± 9.1% for inv+ bacteria (n = 4) but only 0.05% ± 0.07% for inv− bacteria (n = 4). The difference was approximately 250-fold. The non-zero efficiency for inv− bacteria could be due to the inability in our experiment to wash away all extracellular bacterial cells that bound non-specifically to the membrane of tumor cells in monolayers.
Preparing bacterial cell suspension for transport studies
Glycerol stocks of engineered E. coli were stored at −80°C. On the day before bacterial proliferation experiments, bacteria from glycerol stock were added to 4 ml LB broth (MoBio, Carlsbad, CA) with kanamycin (50 μg/ml) in round-bottomed polystyrene tubes with loosened caps. Samples were cultured in a shaker/incubator (New Brunswick C-24 Scientific, Edison, NJ) at 37°C with vigorous shaking at 250 rpm for 15 hrs until the measured optical density of the suspension at 600 nm wavelength (OD600)was approximately 1.0.
Tumor cell culture
B16.F10 mouse melanoma cells and EMT6 mouse mammary carcinoma cells were cultured at 37°C, 95% air and 5% carbon dioxide. The culture medium consisted of high-glucose Dulbecco’s Modified Eagle Medium (DMEM) containing L-glutamine and sodium pyruvate (Gibco-Invitrogen, Grand Island, NY) supplemented with 10% HyClone Bovine Growth Serum (Thermo Scientific, Rockford, IL). Confluent, adherent cells were rinsed with PBS and incubated at 37°C with 1 ml 0.25% Trypsin/EDTA for 10 min to allow cells to detach. Cells were re-suspended in the culture medium before transferring a portion of the cell suspension to a fresh culture flask with a culture surface area of 75 cm2. Additional culture medium was added to a final volume of 15 ml. Cells were removed from flask when the culture was completely confluent again. Unless otherwise stated, all cell culture reagents were obtained from Gibco-Invitrogen.
Cell loading into microfluidic device
Using a syringe pump (Harvard Apparatus, Holliston, MA), outer channels of the collagen-treated device were simultaneously perfused at a rate of 0.05 ml/hr for 5 min prior to cell loading. The perfusion medium consisted of DMEM supplemented with 10% fetal bovine serum (FBS) (Sigma-Aldrich), 60 mM HEPES buffer, and 50 μg/ml kanamycin. B16.F10 or EMT6 tumor cells removed from culture flasks were re-suspended in serum-free DMEM at a concentration of 5 – 6 × 10⁶ cells/ml. The total volume was ~1.5 ml. For co-visualization of tumor cells and bacteria, 15 μl of calcein acetoxymethyl ester (calcein-AM) solution (1 mM) was added to the cell suspension and incubated at 37°C for 15 min prior to being loaded into the microfluidic device. 10 μl of the overnight bacterial culture (3 – 6 × 10⁷ bacteria) was then mixed with 500 μl of tumor cell suspension; and the mixture was loaded into a 1 ml syringe in which the number of bacterial cells was approximately 10 times that of tumor cells.
The cell suspension was infused by hand into the central channel, using very gentle pressure – sometimes merely tapping the syringe lightly – to reduce the escape of cells into to the outer channels through the spaces between the micro-posts. Medium in the cell suspension that was infused into the central channel was able to flow out into the outer channels via the space between the micro-posts and eventually exited through both open outlets. During loading, the microchip was placed on an inverted microscope stage to ensure proper packing of cells. After loading cells into the central channel, the tubing connected to the central channel was clamped to prevent backflow of cells toward the inlet and allow cells to stabilize in the channel. The medium for tumor cell culture mentioned above was supplied in a one-pass perfusion manner using two syringes, one for each outer channel, at a flow rate of 0.07 ml/hr. The entire device was floated in a water bath maintained at 37°C and the bath was kept covered during the overnight culture to maintain high humidity and thus prevent evaporation of media from within the device and formation of air bubbles.
Cell viability staining
To assess the viability, tumor cells were not stained with Calcein-AM before loading into the central channel. Instead, they were stained in situ in the microfluidic device by infusing a fluorescent viability dye, CellTracker Green CMFDA (Molecular Probes, Invitrogen, Eugene, OR), at a concentration of 5 μM in serum-free DMEM via the outer channels at a flow rate of 0.1 ml/hr for 20 min at 37°C in a water bath. Cells were immediately imaged by confocal microscopy (Axioskop 2 with LSM 510, Zeiss, Thornwood, NY). Optical slicing was performed to visualize the entire depth of the cellular structure in the central channel.
Generation of bacterial concentration profiles
Using an inverted fluorescence microscope (Axiovert TV100, Zeiss) equipped with a digital camera (Axiocam MRc, Zeiss), black-and-white snapshots were taken along the length (i.e., y-axis) of the cell channel after the 12-hr culture period. Image analysis was performed using Matlab software where pixel intensity values for each image were obtained as a function of spatial coordinates. Mean intensity profiles in the x direction were obtained by averaging the pixel intensities in the y direction in each image (see Figure 1 for the axes definition). The profiles were generated for images captured at the dead-end, the middle regions, and the region nearest to the inlet of the central channel. This experiment was repeated three times to verify reproducibility.
E. coli proliferation and infection of tumor cells in monolayers
Two types of assays were carried out to study E. coli proliferation in a 6-well plate. In the first assay, 106 B16.F10 or EMT6 cells were added to each well of a 6-well plate containing 1.5 ml DMEM supplemented with 10% FBS. Cells were cultured in the wells overnight at 37°C, 95% air, and 5% CO2 to allow them to form a ~ 90% confluent monolayer. The culture medium in each well was then replaced with 1 ml fresh medium supplemented with kanamycin (50 μg/ml) before adding 50 μl of bacterial suspension with OD600 ~ 1.0. Bacteria were also added to control wells containing fresh media but no tumor cells. After incubating the plates for 4 hrs under the same conditions as described above, OD600 was measured using the Victor X plate reader (Perkin-Elmer, Waltham, MA).
In the second 6-well plate assay, culture media was removed from an overnight culture of B16.F10 or EMT6 cells in the 6-well plates and 1 ml of this conditioned media, without cells, was added to each well of a new plate before inoculating with 50 μl bacterial suspension with OD600 of ~1.0. Control wells in the new plate contained media that had been incubated overnight without tumor cells. The rest of the experiment was the same as that in the first assay. These experiments were repeated 5 times for each combination of tumor cell type and inv+ or inv− E. coli. Statistical significance of sample difference was evaluated with the Mann-Whitney U test.
To visualize E. coli interactions with tumor cells, 1.5 ml of DMEM supplemented with 10% FBS plus 0.5 ml of B16.F10 or EMT6 cell suspension (approximately 3 × 10⁶ cells/ml) were added to each well of a 6-well plate. Cells were incubated in plates overnight at 37°C, 95% air, and 5% CO2 to obtain confluent monolayers. For co-visualization of tumor cells and bacteria, tumor cells were stained prior to bacterial infection by incubating with 1 μM Calcein-AM in serum-free DMEM at 37°C for 15 min. The medium in each well was then replaced with fresh, serum-supplemented medium and kanamycin (50 μg/ml). Monolayers were inoculated with 40 μl of an overnight culture of E. coli (OD600 ~1.0) and incubated at 37°C, 95% air, and 5% CO2 for 4 hrs. Medium was then removed from each well and monolayers were gently washed three times with PBS before visualizing with confocal microscopy (Zeiss LSM 510).
Acknowledgments
This work was supported in part by a grant from the National Science Foundation (BES-0828630). NTE was supported in part by an NIH predoctoral fellowship (CA123714).
References
- 1.Anderson JC, Clarke EJ, Arkin AP, Voigt CA. J Mol Biol. 2006;355:619–627. doi: 10.1016/j.jmb.2005.10.076. [DOI] [PubMed] [Google Scholar]
- 2.Courvalin P, Goussard S, Grillot-Courvalin C. C R Acad Sci III. 1995;318:1207–1212. [PubMed] [Google Scholar]
- 3.Falkow S, Isberg RR, Portnoy DA. Annu Rev Cell Biol. 1992;8:333–363. doi: 10.1146/annurev.cb.08.110192.002001. [DOI] [PubMed] [Google Scholar]
- 4.Grillot-Courvalin C, Goussard S, Courvalin P. Curr Opin Biotechnol. 1999;10:477–481. doi: 10.1016/s0958-1669(99)00013-0. [DOI] [PubMed] [Google Scholar]
- 5.Forbes NS, Munn LL, Fukumura D, Jain RK. Cancer Res. 2003;63:5188–5193. [PubMed] [Google Scholar]
- 6.Laner A, Goussard S, Ramalho AS, Schwarz T, Amaral MD, Courvalin P, Schindelhauer D, Grillot-Courvalin C. Gene Ther. 2005;12:1559–1572. doi: 10.1038/sj.gt.3302576. [DOI] [PubMed] [Google Scholar]
- 7.Vassaux G, Nitcheu J, Jezzard S, Lemoine NR. J Pathol. 2006;208:290–298. doi: 10.1002/path.1865. [DOI] [PubMed] [Google Scholar]
- 8.Bermudes D, Low KB, Pawelek J, Feng M, Belcourt M, Zheng LM, King I. Biotechnol Genet Eng Rev. 2001;18:219–233. doi: 10.1080/02648725.2001.10648014. [DOI] [PubMed] [Google Scholar]
- 9.Bermudes D, Low B, Pawelek J. Adv Exp Med Biol. 2000;465:57–63. doi: 10.1007/0-306-46817-4_6. [DOI] [PubMed] [Google Scholar]
- 10.Pawelek JM, Low KB, Bermudes D. Cancer Res. 1997;57:4537–4544. [PubMed] [Google Scholar]
- 11.Tangney M, Gahan CG. Curr Gene Ther. 2010;10:46–55. doi: 10.2174/156652310790945539. [DOI] [PubMed] [Google Scholar]
- 12.Stritzker J, Pilgrim S, Szalay AA, Goebel W. BMC Cancer. 2008;8:94. doi: 10.1186/1471-2407-8-94. [DOI] [PMC free article] [PubMed] [Google Scholar]
- 13.Grillot-Courvalin C, Goussard S, Courvalin P. Cell Microbiol. 2002;4:177–186. doi: 10.1046/j.1462-5822.2002.00184.x. [DOI] [PubMed] [Google Scholar]
- 14.Ganai S, Arenas RB, Forbes NS. Br J Cancer. 2009;101:1683–1691. doi: 10.1038/sj.bjc.6605403. [DOI] [PMC free article] [PubMed] [Google Scholar]
- 15.Guo H, Zhang J, Inal C. Gene Ther. 2011;18:95–105. doi: 10.1038/gt.2010.112. [DOI] [PubMed] [Google Scholar]
- 16.Sinnathamby G, Lauer P, Zerfass J, Hanson B, Karabudak A, Krakover J, Secord AA, Clay TM, Morse MA, Dubensky TW, Jr, Brockstedt DG, Philip R, Giedlin M. J Immunother. 2009;32:856–869. doi: 10.1097/CJI.0b013e3181b0b125. [DOI] [PubMed] [Google Scholar]
- 17.Lemmon MJ, van Zijl P, Fox ME, Mauchline ML, Giaccia AJ, Minton NP, Brown JM. Gene Ther. 1997;4:791–796. doi: 10.1038/sj.gt.3300468. [DOI] [PubMed] [Google Scholar]
- 18.Liu F, Zhao M, Zhang L, Hoffman R. Cell Cycle. 2010;9:4518–4524. doi: 10.4161/cc.9.22.13744. [DOI] [PMC free article] [PubMed] [Google Scholar]
- 19.Yam C, Zhao M, Hayashi K, Ma H, Kishimoto H, McElroy M, Bouvet M, Hoffman RM. J Surg Res. 2010;164:248–255. doi: 10.1016/j.jss.2009.02.023. [DOI] [PMC free article] [PubMed] [Google Scholar]
- 20.Hayashi K, Zhao M, Yamauchi K, Yamamoto N, Tsuchiya H, Tomita K, Hoffman RM. J Cell Biochem. 2009;106:992–998. doi: 10.1002/jcb.22078. [DOI] [PMC free article] [PubMed] [Google Scholar]
- 21.Critchley RJ, Jezzard S, Vassaux G. Discov Med. 2004;4:194–197. [PubMed] [Google Scholar]
- 22.Fujimori M. Breast Cancer. 2006;13:27–31. doi: 10.2325/jbcs.13.27. [DOI] [PubMed] [Google Scholar]
- 23.Yazawa K, Fujimori M, Amano J, Kano Y, Taniguchi S. Cancer Gene Ther. 2000;7:269–274. doi: 10.1038/sj.cgt.7700122. [DOI] [PubMed] [Google Scholar]
- 24.Grillot-Courvalin C, Goussard S, Huetz F, Ojcius DM, Courvalin P. Nat Biotechnol. 1998;16:862–866. doi: 10.1038/nbt0998-862. [DOI] [PubMed] [Google Scholar]
- 25.Critchley RJ, Jezzard S, Radford KJ, Goussard S, Lemoine NR, Grillot-Courvalin C, Vassaux G. Gene Ther. 2004;11:1224–1233. doi: 10.1038/sj.gt.3302281. [DOI] [PubMed] [Google Scholar]
- 26.Isberg RR, Voorhis DL, Falkow S. Cell. 1987;50:769–778. doi: 10.1016/0092-8674(87)90335-7. [DOI] [PubMed] [Google Scholar]
- 27.Narayanan K, Warburton PE. Nucleic Acids Res. 2003;31:e51. doi: 10.1093/nar/gng051. [DOI] [PMC free article] [PubMed] [Google Scholar]
- 28.Rankin S, Isberg RR, Leong JM. Infect Immun. 1992;60:3909–3912. doi: 10.1128/iai.60.9.3909-3912.1992. [DOI] [PMC free article] [PubMed] [Google Scholar]
- 29.Isberg RR, Leong JM. Proc Natl Acad Sci U S A. 1988;85:6682–6686. doi: 10.1073/pnas.85.18.6682. [DOI] [PMC free article] [PubMed] [Google Scholar]
- 30.Petersen OW, Ronnov-Jessen L, Howlett AR, Bissell MJ. Proc Natl Acad Sci U S A. 1992;89:9064–9068. doi: 10.1073/pnas.89.19.9064. [DOI] [PMC free article] [PubMed] [Google Scholar]
- 31.Sutherland RM, Durand RE. Curr Top Radiat Res Q. 1976;11:87–139. [PubMed] [Google Scholar]
- 32.Brown JM, Giaccia AJ. Cancer Res. 1998;58:1408–1416. [PubMed] [Google Scholar]
- 33.Bush RS, Jenkin RD, Allt WE, Beale FA, Bean H, Dembo AJ, Pringle JF. Br J Cancer Suppl. 1978;37:302–306. [PMC free article] [PubMed] [Google Scholar]
- 34.Gatenby RA, Kessler HB, Rosenblum JS, Coia LR, Moldofsky PJ, Hartz WH, Broder GJ. Int J Radiat Oncol Biol Phys. 1988;14:831–838. doi: 10.1016/0360-3016(88)90002-8. [DOI] [PubMed] [Google Scholar]
- 35.Elliott NT, Yuan F. J Pharm Sci. 2010;100:59–74. doi: 10.1002/jps.22257. [DOI] [PubMed] [Google Scholar]
- 36.Elliott NT. PhD Thesis. Department of Biomedical Engineering, Duke University; Durham, NC: 2010. [Google Scholar]
- 37.Walsh CL, Babin BM, Kasinskas RW, Foster JA, McGarry MJ, Forbes NS. Lab Chip. 2009;9:545–554. doi: 10.1039/b810571e. [DOI] [PMC free article] [PubMed] [Google Scholar]
- 38.Chung S, Sudo R, Mack PJ, Wan CR, Vickerman V, Kamm RD. Lab Chip. 2009;9:269–275. doi: 10.1039/b807585a. [DOI] [PubMed] [Google Scholar]
- 39.Vickerman V, Blundo J, Chung S, Kamm R. Lab Chip. 2008;8:1468–1477. doi: 10.1039/b802395f. [DOI] [PMC free article] [PubMed] [Google Scholar]
- 40.Toh YC, Ng S, Khong YM, Samper V, Yu H. Assay Drug Dev Technol. 2005;3:169–176. doi: 10.1089/adt.2005.3.169. [DOI] [PubMed] [Google Scholar]
- 41.Toh YC, Zhang C, Zhang J, Khong YM, Chang S, Samper VD, van Noort D, Hutmacher DW, Yu H. Lab Chip. 2007;7:302–309. doi: 10.1039/b614872g. [DOI] [PubMed] [Google Scholar]
- 42.Kim MS, Yeon JH, Park JK. Biomed Microdevices. 2007;9:25–34. doi: 10.1007/s10544-006-9016-4. [DOI] [PubMed] [Google Scholar]
- 43.Toh YC, Ho ST, Zhou Y, Hutmacher DW, Yu H. Biomaterials. 2005;26:4149–4160. doi: 10.1016/j.biomaterials.2004.10.033. [DOI] [PubMed] [Google Scholar]
- 44.Wong AP, Perez-Castillejos R, Christopher Love J, Whitesides GM. Biomaterials. 2008;29:1853–1861. doi: 10.1016/j.biomaterials.2007.12.044. [DOI] [PMC free article] [PubMed] [Google Scholar]
- 45.Ng CP, Pun SH. Biotechnol Bioeng. 2008;99:1490–1501. doi: 10.1002/bit.21698. [DOI] [PMC free article] [PubMed] [Google Scholar]
- 46.Hicks KO, Fleming Y, Siim BG, Koch CJ, Wilson WR. Int J Radiat Oncol Biol Phys. 1998;42:641–649. doi: 10.1016/s0360-3016(98)00268-5. [DOI] [PubMed] [Google Scholar]
- 47.Tannock IF, Lee CM, Tunggal JK, Cowan DS, Egorin MJ. Clin Cancer Res. 2002;8:878–884. [PubMed] [Google Scholar]
- 48.Grantab R, Sivananthan S, Tannock IF. Cancer Res. 2006;66:1033–1039. doi: 10.1158/0008-5472.CAN-05-3077. [DOI] [PubMed] [Google Scholar]
- 49.Sutherland RM, Durand RE. Recent Results Cancer Res. 1984;95:24–49. doi: 10.1007/978-3-642-82340-4_2. [DOI] [PubMed] [Google Scholar]
- 50.Casciari JJ, Sotirchos SV, Sutherland RM. Cell Prolif. 1992;25:1–22. doi: 10.1111/j.1365-2184.1992.tb01433.x. [DOI] [PubMed] [Google Scholar]
- 51.Durand RE. Cell Tissue Kinet. 1990;23:141–159. doi: 10.1111/j.1365-2184.1990.tb01111.x. [DOI] [PubMed] [Google Scholar]
- 52.Freyer JP, Sutherland RM. Adv Exp Med Biol. 1983;159:463–475. doi: 10.1007/978-1-4684-7790-0_39. [DOI] [PubMed] [Google Scholar]
- 53.Kunz-Schughart LA, Freyer JP, Hofstaedter F, Ebner R. J Biomol Screen. 2004;9:273–285. doi: 10.1177/1087057104265040. [DOI] [PubMed] [Google Scholar]
- 54.Zhang X, Wang W, Yu W, Xie Y, Zhang Y, Ma X. Biotechnol Prog. 2005;21:1289–1296. doi: 10.1021/bp050003l. [DOI] [PubMed] [Google Scholar]
- 55.Isberg RR, Leong JM. Cell. 1990;60:861–871. doi: 10.1016/0092-8674(90)90099-z. [DOI] [PubMed] [Google Scholar]
- 56.Lee TJ. PhD Thesis. Department of Biomedical Engineering, Duke University; Durham, NC: 2010. [Google Scholar]
- 57.Liminga G, Nygren P, Larsson R. Exp Cell Res. 1994;212:291–296. doi: 10.1006/excr.1994.1146. [DOI] [PubMed] [Google Scholar]
- 58.Griffith LG, Swartz MA. Nat Rev Mol Cell Biol. 2006;7:211–224. doi: 10.1038/nrm1858. [DOI] [PubMed] [Google Scholar]
- 59.Yamada KM, Cukierman E. Cell. 2007;130:601–610. doi: 10.1016/j.cell.2007.08.006. [DOI] [PubMed] [Google Scholar]
- 60.Becker JL, Prewett TL, Spaulding GF, Goodwin TJ. J Cell Biochem. 1993;51:283–289. doi: 10.1002/jcb.240510307. [DOI] [PubMed] [Google Scholar]
- 61.Becker JL, Blanchard DK. J Surg Res. 2007;142:256–262. doi: 10.1016/j.jss.2007.03.016. [DOI] [PubMed] [Google Scholar]
- 62.Jung HC, Eckmann L, Yang SK, Panja A, Fierer J, Morzycka-Wroblewska E, Kagnoff MF. J Clin Invest. 1995;95:55–65. doi: 10.1172/JCI117676. [DOI] [PMC free article] [PubMed] [Google Scholar]
- 63.Komeda Y., II J Bacteriol. 1979;139:721–729. doi: 10.1128/jb.139.3.721-729.1979. [DOI] [PMC free article] [PubMed] [Google Scholar]
- 64.Mannik J, Driessen R, Galajda P, Keymer JE, Dekker C. Proc Natl Acad Sci U S A. 2009;106:14861–14866. doi: 10.1073/pnas.0907542106. [DOI] [PMC free article] [PubMed] [Google Scholar]
- 65.Harshey RM. Annu Rev Microbiol. 2003;57:249–273. doi: 10.1146/annurev.micro.57.030502.091014. [DOI] [PubMed] [Google Scholar]
- 66.Proft T, Baker EN. Cell Mol Life Sci. 2009;66:613–635. doi: 10.1007/s00018-008-8477-4. [DOI] [PMC free article] [PubMed] [Google Scholar]
- 67.Sauvonnet N, Gounon P, Pugsley AP. J Bacteriol. 2000;182:848–854. doi: 10.1128/jb.182.3.848-854.2000. [DOI] [PMC free article] [PubMed] [Google Scholar]
- 68.You L, Cox RS, 3rd, Weiss R, Arnold FH. Nature. 2004;428:868–871. doi: 10.1038/nature02491. [DOI] [PubMed] [Google Scholar]
- 69.Tran Van Nhieu G, Isberg RR. Embo J. 1993;12:1887–1895. doi: 10.1002/j.1460-2075.1993.tb05837.x. [DOI] [PMC free article] [PubMed] [Google Scholar]
- 70.Zutter MM, Sun H, Santoro SA. J Mammary Gland Biol Neoplasia. 1998;3:191–200. doi: 10.1023/a:1018798907544. [DOI] [PubMed] [Google Scholar]
- 71.Hart IR, Birch M, Marshall JF. Cancer Metastasis Rev. 1991;10:115–128. doi: 10.1007/BF00049409. [DOI] [PubMed] [Google Scholar]