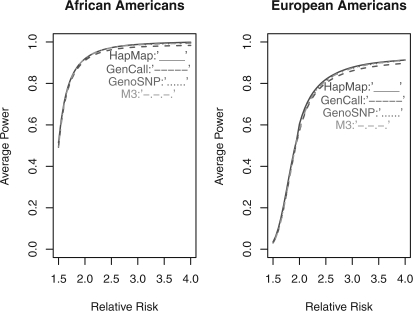
Fig. 3.
The average power to detect risk alleles for overall SNPs by HapMap, GenCall, GenoSNP and M3. Red solid line: the ideal power measured by the HapMap project; blue dash line: the average power measured by the GenCall; purple dot line: the average power measured by GenoSNP; green dot dash line: the average power measured by M3; cutoff: 5×10⁻⁸.

