Abstract
In this report, we show the collection of spatial information through a turbid medium by coherent Raman microspectroscopic imaging. In particular, the technique is capable of identifying anthrax endospores inside a sealed paper envelope.
Keywords: anthrax detection, microscopy, hyperspectral imaging, nonlinear Raman spectroscopy
Chemically specific optical imaging and sensing play a pivotal role in biomedical imaging, environmental sensing, and preventive measures to counter chemical and biological warfare. Frequently, objects to be imaged and identified are not present on a surface, and the light probe has to pass through layers of scattering material.
In particular, the detection of weaponized anthrax in the mail room is an important problem of current interest. Clearly, it would be highly desirable to identify the chemical content of an unopened envelope (i.e., image through layers of paper and chemically distinguish common biological and chemical threats from nonhazardous materials). However, the detection of a chemically specific target in a scattering medium presents several problems. First, targeted molecules are not directly accessible for interrogation, and a remote sensing technique has to be used. On passing through the scattering medium, both the incident and signal light are substantially diminished, weakening the signal and diffusing the spatial information about the signal's origin. Second, the chemical specificity of anthrax detection has to be maintained in the presence of a substantial background from surrounding chemicals, such as paper.
Coherent Raman spectroscopy has been recently shown to be a reliable tool for identifying endospores. Nonlinear Raman spectroscopy [e.g., anti-Stokes Raman scattering (CARS)] (1–3) can provide an alternative and very efficient solution to the problem of detecting endospores. We have recently shown how to detect anthrax-type spores by a coherent Raman microscopy (2–4) and coherent Raman spectroscopy at a distance in real time (5).
In this paper, we report the use of the chemical recognition capability of CARS microspectroscopy in a scattering medium. By using long excitation wavelength, we substantially reduce the effect of scattering, and microspectroscopic arrangements allow spatial and spectral discrimination of the signal from endospores within the closed paper envelope. We anticipate that the proposed approach will find numerous applications in chemical sensing and biomedical imaging.
The signal in CARS spectroscopy is detected at the frequency ωCARS = 2ωpump − ωStokes, where ωpump and ωStokes are the frequencies of the pump and Stokes beams, respectfully, and is blue-shifted with respect to the excitation wavelength. Thus, the signal wavelength can be shifted into the high-sensitivity spectral region of conventional Si detectors if the wavelength of the pump beam does not exceed 1,100 nm. CARS microscopy/microspectroscopy, being based on multiphoton excitation, also provides the means of improving sectioning capabilities, because the generated signal predominantly comes from a confined focal region of the laser beam (6).
CARS spectroscopy is often limited by a strong so-called nonresonant background, which originates from a nonspecific four-wave mixing, and the line shapes in CARS spectra are rather complicated. Conventional methods of suppressing the nonresonant background [e.g., using time-delayed probing and/or polarization properties of the nonresonant CARS signal (7) and interferometric detection to heterodyne the CARS signal (8, 9)] do not work in a turbid medium. Hence, to extract the signal, we assume that the nonresonant tensor component,  , is real and frequency-independent, and we use a maximum entropy technique (10) to extract the imaginary part of the resonant tensor component,
  , which is directly proportional to the Raman signal. The resultant Raman spectrum does not rely on any other assumptions and can be used successfully in both transparent and a highly scattering media (11); we call it the retrieved Raman spectrum.
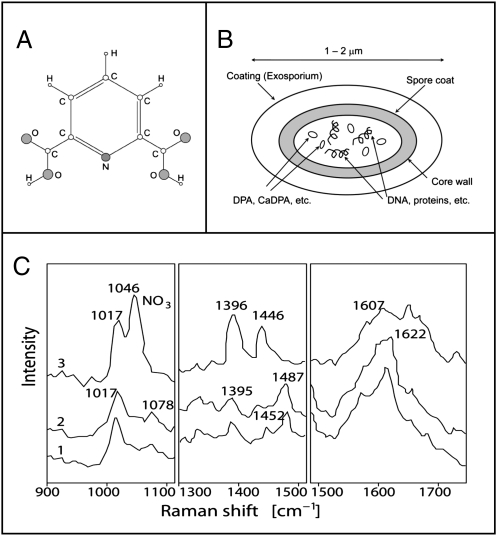
In these experiments, we used a powder of a dipicolinic acid (DPA), whose chemical structure is shown in Fig. 1A, because it is a major chemical component of bacterial endospores (1) (Fig. 1B). The comparative Raman spectra of different bacteria endospores have the common Raman lines (see ref. 12), corresponding to the Raman lines of DPA (Fig. 1C), and as was shown earlier, it can serve as a chemical marker to detect endospores by means of coherent Raman spectroscopy (2, 3). Using these vibrational lines as an indicator for the presence of the DPA powder, we image its distribution through a regular envelope in the presence of other lookalike powders [e.g., chalk or calcium carbonate (CaCO3)].
Fig. 1.
(A) Chemical structure of DPA. (B) Sketch of a bacterial endospore that indicates that the DPA and its salts (e.g., Ca-DPA) are contained in the core. (C) UV resonance Raman spectra of spores of Bacillus megaterium (trace 1), spores of Bacillus cereus (trace 2), and calcium dipicolinate (trace 3) in three spectral regions. All samples are excited at 242 nm. Modified from ref. 1.
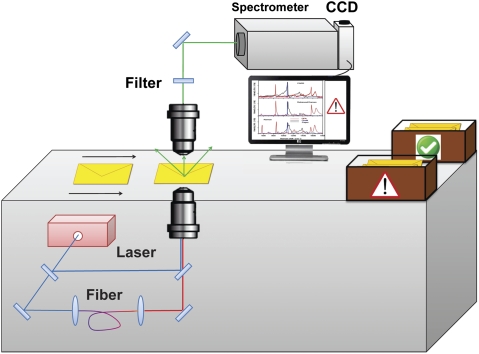
Our experimental setup is very similar to the one described elsewhere (2, 13) and is shown schematically in Fig. 2. In brief, a megahertz-rate home-built picosecond Nd:YVO4 laser was amplified by a diode-pumped Nd:YVO4 amplifier to achieve 5 μJ/pulse at a repetition rate of 1 MHz and a pulse duration of about 10 ps. Approximately 2 μJ energy were sent into a large-mode diameter single-mode fiber, which was doped with GeO2 to promote efficient stimulated Raman scattering, leading to a broadband continuum generation in the spectral region from 1,000 to 1,500 nm (13). This supercontinuum radiation served as a broadband Stokes pulse, whereas the rest of the fundamental radiation at 1,064 nm was used as a narrow band (<5 cm−1) pump pulse to achieve a simultaneous excitation of all Raman modes in the spectral region of interest (200–3,000 cm−1). The two beams were combined together and collinearly focused onto the sample using an achromatic aspherical lens (ThorLabs, Inc.), which was placed on a computer-controlled translational stage. The signal was collected in a transmission geometry using an achromatic objective (N.A. = 0.55; Mitutoyo) and directed through an anti-Stokes Raman filter (Omega Optical) into a 0.5-m spectrometer (Horiba) with the attached CCD camera (Andor). All of the collected CARS spectra were normalized to the CARS spectra of fused silica, which does not have strong Raman lines in the spectral region of interest. Normalization procedures allowed us to avoid most of the problems caused by a number of spectral features of the supercontinuum, spectral transmission function of all optical components, etc.
Fig. 2.
Schematic diagram of the experimental setup for CARS microspectroscopy imaging.
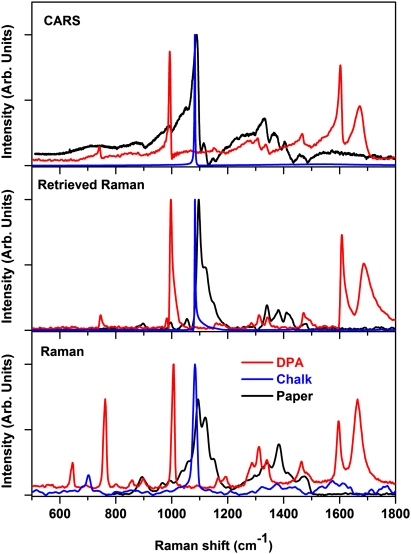
Typical CARS, retrieved Raman, and experimentally collected Raman spectra for DPA and calcium carbonate are shown in Fig. 3. Raman spectra were collected using a home-built confocal Raman microscope, which uses an intracavity frequency-doubled Nd:YVO4 laser (λ = 532 nm) as the excitation source. Some minor discrepancies of the retrieved Raman and experimentally measured Raman spectra are attributed to a large difference in the excitation wavelength. However, all of the spectral features are essentially identical.
Fig. 3.
(Top) CARS spectrum, (Middle) retrieved Raman spectrum, and (Bottom) experimentally measured Raman spectrum of DPA, calcium carbonate (chalk), and paper. All spectra were taken for materials placed separately on a transparent glass slide.
Small amounts of powders of DPA, chalk, and a mixture of the two substances were placed inside the envelope. Then, CARS images of the powder were collected when the envelope was inspected by a transmission optical microscope.
As expected, the amplitude of the CARS signal dramatically decreased because of the reduced light intensity as a result of light scattering. However, all of the spectral features of the DPA and chalk were clearly pronounced. This definition allows a hyperspectral imaging to be performed at a spatial resolution of about 2 μm, which was roughly the size of the focal spot on transmission through the first layer of paper. To do this procedure, we first focused on an upper paper surface and injected 500 μm into the sample to position the focal spot between the paper layers of the envelope. The 2D scanning was performed in the plane perpendicular to the beam propagation.
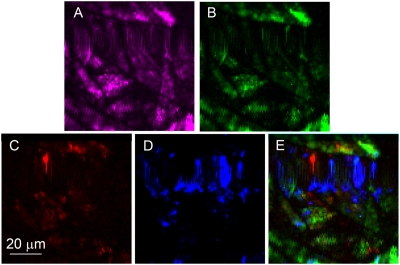
A nonspecific CARS image is shown in Fig. 4A, where the intensity of CARS signal is evaluated at around 2,000 cm−1, because there are no specific vibrations, and signal is caused by a nonresonant background. After we retrieved Raman spectra from CARS spectra and plotted the same area to display the intensity of Raman intensity at around 1,150 cm−1, where Raman spectrum is dominated by the Raman spectrum of paper, we get a distribution of paper material in the scanned area, which is shown in Fig. 4B. Repeating the same procedure for 1,000 (a sharp vibrational line of Ca-DPA), and 1,090 cm−1 (a characteristic vibration of calcium carbonate), we get the distribution of DPA and chalk, which are shown in Fig. 4 C and D, respectively. Finally, we can combine all these images into one image (Fig. 4E), where each color represents the concentration of different chemicals in the scanned area (red, DPA; blue, chalk; green, paper).
Fig. 4.
(A) Nonspecific CARS image, (B) paper-specific CARS image, (C) DPA-specific CARS image, (D) calcium carbonate-specific CARS image, and (E) an overlaid image of DPA (red), calcium carbonate (blue), and paper (green) distributions. All images were taken for materials placed inside a standard mailing envelop.
In summary, we have shown the unique capability of CARS microspectroscopy to provide spatially selective, chemically specific imaging of molecular species in a turbid medium. At this point, the limiting parameter for high-speed imaging is the amplitude of the signal. It takes less than 1 ms to attain a good-quality CARS spectrum in an optically transparent system, whereas it takes 100 ms or more to achieve the same quality spectrum from a powder species hidden beneath a scattering medium, like envelope paper. One way to improve the signal strength is to increase the light intensity on the sample, while simultaneously increasing the beam spot size on the sample. This improvement would require a substantial increasing of the incident power, but given the recent spectacular progress of ultrafast fiber technology, it is feasible to use laser beams 10 times more powerful, leading to three orders of magnitude signal enhancement (14). Beam multiplexing through a multifoci focusing imaging array (15) will also speed up the data acquisition. With the above-mentioned upgrades, we anticipate at least four orders of magnitude improvement in image clarity and the time required for the data acquisition. Furthermore, because the suspicious area inside an envelope can be easily identified in a regular transmission optical microscope, there is no need to scan the whole envelope area, which will also reduce the inspector's time requirements.
Supplementary Material
Acknowledgments
This work was partially supported by National Institutes of Health Grants R21EB011703 and R15EY020805 and National Science Foundation Grants ECS-0925950 and DBI-0964225. Work at Texas A&M and Princeton Universities was supported by National Science Foundation Grant EEC-0540832 (“Mid-InfraRed Technologies for Health and the Environment” Engineering Research Center), the Office of Naval Research, and Robert A. Welch Foundation Grant A-1261 at Texas A&M University.
Footnotes
The authors declare no conflict of interest.
This article contains supporting information online at www.pnas.org/lookup/suppl/doi:10.1073/pnas.1115242108/-/DCSupplemental.
References
- 1.Scully MO, et al. FAST CARS: Engineering a laser spectroscopic technique for rapid identification of bacterial spores. Proc Natl Acad Sci USA. 2002;99:10994–11001. doi: 10.1073/pnas.172290899. [DOI] [PMC free article] [PubMed] [Google Scholar]
- 2.Petrov GI, et al. Comparison of coherent and spontaneous Raman microspectroscopies for noninvasive detection of single bacterial endospores. Proc Natl Acad Sci USA. 2007;104:7776–7779. doi: 10.1073/pnas.0702107104. [DOI] [PMC free article] [PubMed] [Google Scholar]
- 3.Pestov D, et al. Optimizing the laser-pulse configuration for coherent Raman spectroscopy. Science. 2007;316:265–268. doi: 10.1126/science.1139055. [DOI] [PubMed] [Google Scholar]
- 4.Evans CL, Xie XS. Coherent anti-stokes Raman scattering microscopy: Chemical imaging for biology and medicine. Annu Rev Anal Chem (Palo Alto Calif) 2008;1:883–909. doi: 10.1146/annurev.anchem.1.031207.112754. [DOI] [PubMed] [Google Scholar]
- 5.Pestov D, et al. Single-shot detection of bacterial endospores via coherent Raman spectroscopy. Proc Natl Acad Sci USA. 2008;105:422–427. doi: 10.1073/pnas.0710427105. [DOI] [PMC free article] [PubMed] [Google Scholar]
- 6.Zumbusch A, Holtom GR, Xie XS. Three-dimensional vibrational imaging by coherent anti-Stokes Raman scattering. Phys Rev Lett. 1999;82:4142–4145. [Google Scholar]
- 7.Oudar J-L, Smith RW, Shen YR. Polarization-sensitive CARS. Appl Phys Lett. 1979;34:758–760. [Google Scholar]
- 8.Potma EO, Evans CL, Xie XS. Heterodyne coherent anti-Stokes Raman scattering (CARS) imaging. Opt Lett. 2006;31:241–243. doi: 10.1364/ol.31.000241. [DOI] [PubMed] [Google Scholar]
- 9.Jurna M, Korterik JP, Otto C, Offerhaus HL. Shot noise limited heterodyne detection of CARS signals. Opt Express. 2007;15:15207–15213. doi: 10.1364/oe.15.015207. [DOI] [PubMed] [Google Scholar]
- 10.Variainen EM. Phase retrieval approach for coherent anti-Stokes Raman scattering spectrum analysis. J Opt Soc Am B. 1992;9:1209–1214. [Google Scholar]
- 11.Arora R, Petrov GI, Yakovlev VV. Analytical capabilities of coherent anti-stokes Raman scattering microspectroscopy. J Mod Opt. 2008;55:3237–3254. doi: 10.1080/09500340802168639. [DOI] [PMC free article] [PubMed] [Google Scholar]
- 12.Manoharan R, et al. UV resonance Raman spectra of bacteria, bacterial spores, protoplasts and calcium dipicolinate. J Microbiol Methods. 1990;11:1–15. [Google Scholar]
- 13.Yakovlev V, Petrov GI. Enhancing red-shifted white-light continuum generation in optical fibers for applications in nonlinear Raman microscopy. Opt Express. 2005;13:1299–1306. doi: 10.1364/opex.13.001299. [DOI] [PubMed] [Google Scholar]
- 14.Arora R, Petrov GI, Liu J, Yakovlev VV. Improving sensitivity in nonlinear Raman microspectroscopy imaging and sensing. J Biomed Opt. 2011;16:021114. doi: 10.1117/1.3533317. [DOI] [PMC free article] [PubMed] [Google Scholar]
- 15.Minamikawa T, Hashimoto M, Fujita K, Kawata S, Araki T. Multi-focus excitation coherent anti-Stokes Raman scattering (CARS) microscopy and its applications for real-time imaging. Opt Express. 2009;17:9526–9536. doi: 10.1364/oe.17.009526. [DOI] [PubMed] [Google Scholar]
Associated Data
This section collects any data citations, data availability statements, or supplementary materials included in this article.


