

Graphical abstract

Keywords: Cytosolic phospholipase A2α, cPLA2α, Inflammation, Pharmacophore modeling, Virtual screening
Abstract
The release of arachidonic acid, a precursor in the production of prostaglandins and leukotrienes, is achieved by activity of the cytosolic phospholipase A2α (cPLA2α). Signaling mediated by this class of bioactive lipids, which are collectively referred to as eicosanoids, has numerous effects in physiological and pathological processes. Herein, we report the development of a ligand-based pharmacophore model and pharmacophore-based virtual screening of the National Cancer Institute (NCI) database, leading to the identification of 4-(hexadecyloxy)-3-(2-(hydroxyimino)-3-oxobutanamido)benzoic acid (NSC 119957) as cPLA2α inhibitor in cell-free and cell-based in vitro assays.
During the last decade, efforts have been made to identify novel selective inhibitors of cytosolic phospholipase A2α (cPLA2α), which is a member of the PLA2 family.1 In general, the members of this superfamily have a crucial role in the production of prostaglandins (PGs) and leukotrienes (LTs). These lipolytic enzymes cleave arachidonic acid (AA) from the esters of membrane phospholipids in sn-2 position. The further production of PGs and LTs, collectively referred to as eicosanoids, is catalyzed by several downstream-functioning enzymes such as cyclooxygenases or 5-lipoxygenase.2–4
Several non-selective and selective inhibitors of cPLA2α have been reported (Fig. 1). The published in vivo data of these inhibitors in models of inflammation confirms their efficacy.5–11 Therefore, and based on data obtained from cPLA2α deficient mice, cPLA2α is considered an interesting target for the treatment of several inflammatory and allergic diseases.12,13 Recently, the role of cPLA2α in prostate cancer was characterized.14
Figure 1.

Reported cPLA2α inhibitors with published in vivo data (for details see Ref.5–11).
The active site of cPLA2α is arranged around a catalytic dyad, composed of Ser228 and Asp549. The translocation of cPLA2α to the perinuclear membrane is induced by an increase of the intracellular Ca2+ concentration. The interaction of the enzyme with the lipid interface is assumed to induce a substantial change of the enzyme conformation including the movement of a loop that covers the active site, referred to as lid region. This profound change allows the lipid substrate to bind to the active site. Furthermore, phosphorylation of the enzyme at Ser505 by mitogen-activated protein kinases (MAPKs) alters the active site conformation.15 In summary, large changes of the enzyme conformation result from interaction with the lipid interface and from phosphorylation by MAPKs. Therefore, the X-ray crystal structure of cPLA2α (PDB ID: 1cjy), representing an inactive state of the hydrolase, was not used for structure-based modeling. Instead, virtual screening was conducted by using a ligand-based 3D pharmacophore model. In general, 3D pharmacophore modeling and pharmacophore-based screening have been established in drug discovery for several applications that include lead identification, lead optimization, and de novo design.16,17 To our best knowledge, pharmacophore modeling of cPLA2α inhibitors has not been reported before. Herein, we report the development of a ligand-based pharmacophore model for cPLA2α inhibitors as well as pharmacophore-based virtual screening, in order to identify novel chemical classes of cPLA2α ligands.
In order to develop ligand-based pharmacophore models, the 3D models were generated using the HipHop refine module in Catalyst 4.11 from Accelrys (http://www.accelrys.com).18 The discriminatory power of the retrieved pharmacophore models was investigated by screening two datasets. The first one was a test set of highly active inhibitors that were not included in the training set. As putatively inactive molecules, so-called decoys, a compound collection assembled from the ChEMBL 03, from which reported inhibitors of all PLA2 subtypes had previously been removed, was screened. The enrichment obtained in the screening experiments was quantitatively investigated by two enrichment metrics. The model with the highest enrichment of active compounds was selected for a virtual screening campaign of the National Cancer Institute (NCI) database. Afterward, compounds were submitted for evaluation in biological testings after visual inspection of the hit list (Fig. 2).
Figure 2.
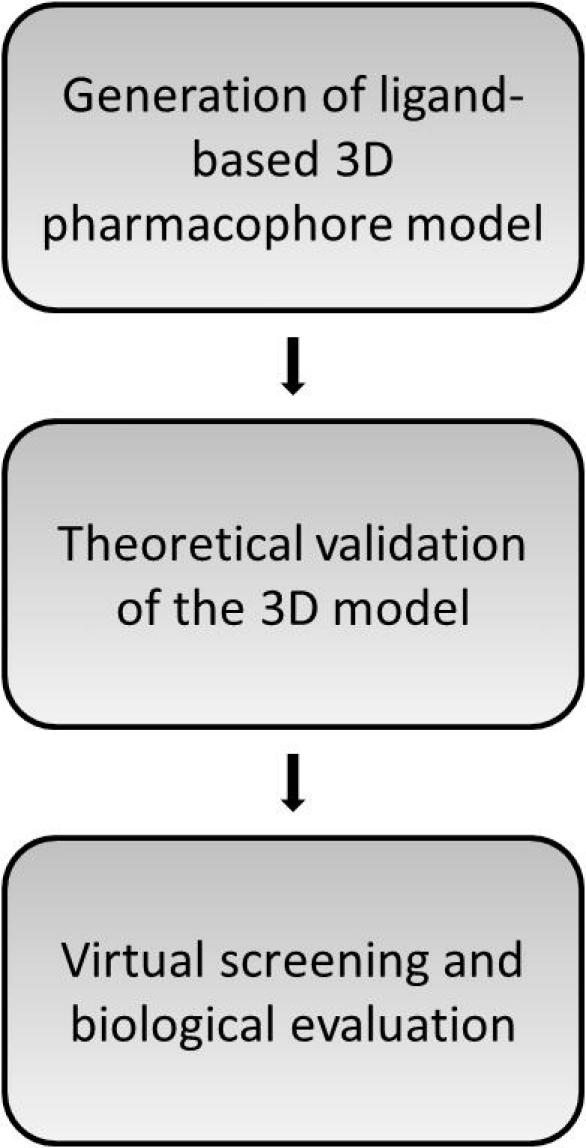
Workflow for the development of the cPLA2α inhibitor pharmacophore model.
Out of a heterogeneous dataset of cPLA2α inhibitors, examples shown in Figure 1, this molecular modeling study focused on three chemical classes that are composed of an aryl-alkyl-/alkyl-(oxy) side chain, a central carbonyl moiety, and in most cases of two to three aromatic rings.
First, conformational models of the training set compounds (Fig. 3) were generated with a maximum number of 255 conformations per molecule and ‘BEST’ quality within Catalyst. For the common feature pharmacophore hypotheses generation, the HipHop algorithm was used.19,20 Using HipHop refine, these models were fine-tuned by strategically placing XVOLs in approximated forbidden areas from steric hindrance.21 For this reason, the activity order of the training set compounds is a mandatory input for hypothesis generation. Highly active and medium active training set compounds are labeled with 2 and 1, respectively, and weakly or inactive compounds with 0.22
Figure 3.

Highly active and active training set compounds for the HipHop refine model (A) and weakly or inactive compounds for the steric refinement (B).
In brief, the hypothesis generation was performed by using six highly active (class 2) inhibitors from the diaryloxy-propan-2-one and the 5-carboxyindole-1-yl-propan-2-one scaffolds (6–11),23,24 and four moderately active inhibitors (class 1), namely the 2-oxoamide inhibitor 1,5 and three diaryloxy-propan-2-one inhibitors (12–14)25,26 (Fig. 3A). The algorithm uses the information of medium active compounds to conduct a ranking of initially generated hypotheses. The hypotheses that map the highly active inhibitors and the moderately active inhibitors in consistency with their experimental data are prioritized. Additionally, four weakly active or inactive compounds (15–18), selected basically from the same chemical classes,25,26 were used for the steric refinement step (Fig. 3B). A summary of the training set compounds with the assigned activity classes is given in Table 1. The generation of 3D pharmacophore models resulted in ten hypotheses, of which seven models consisted of six features, two were composed of five features, and one of seven features, respectively.
Table 1.
Training set compounds for the HipHop refine model
| Compound | Activity | Class | Reference |
|---|---|---|---|
| 6 | IC50: 4 nM | Highly active | 24 |
| 7 | IC50: 8 nM | Highly active | 24 |
| 8 | IC50: 4.3 nM | Highly active | 23 |
| 9 | IC50: 4.9 nM | Highly active | 23 |
| 10 | IC50: 15 nM | Highly active | 23 |
| 11 | IC50: 16 nM | Highly active | 23 |
| 1 | Xi(50): 17 nM | Active | 5 |
| 12 | IC50: 300 nM | Active | 25 |
| 13 | IC50: 400 nM | Active | 25 |
| 14 | IC50: 760 nM | Active | 26 |
| 15 | IC50: >10 μM | Inactive | 25 |
| 16 | IC50: 20 μM | Inactive | 26 |
| 17 | IC50: 34 μM | Inactive | 26 |
| 18 | IC50: 63 μM | Inactive | 26 |
In order to perform the theoretical evaluation of the generated hypotheses, a set of 12 highly active compounds that were not included in the training set was assembled (Fig. 4). Furthermore, reported PLA2 inhibitors were removed from the ChEMBL 03, a database of drugs and drug-like compounds with pharmacological activity notes.27 Afterwards, this database that consisted of 310732 unique entries was refined by applying a physicochemical property-based filter. In total, 1712 compounds similar in physicochemical properties to the highly active compounds were selected using a protocol in PipelinePilot 7.5,28 which is summarized in Table 2. The conformational models for this validation dataset were generated within Catalyst 4.11 with a maximum number of 100 conformations per molecule and ‘FAST’ quality.
Figure 4.

Test set for the theoretical model validation.
Table 2.
Physicochemical property analysis of the dataset of cPLA2α inhibitors and the putatively inactive ChEMBL compounds (‘decoys’)
| Dataset (n = 22) | Decoys (n = 1712) | |
|---|---|---|
| MolW | 466.9 ± 34.5 | 470.7 ± 32.2 |
| ALogP | 6.3 ± 0.6 | 6.3 ± 0.8 |
| NRot | 16.1 ± 2.3 | 14.1 ± 2.6 |
| tPSA | 98.9 ± 19.5 | 83.8 ± 23.1 |
The enrichment of active molecules was quantitatively investigated by the enrichment factor (EF) using the equation,
where TP is the number of active compounds correctly identified by screening with the 3D pharmacophore model (true positives), n is the total number of molecules retrieved by screening with the pharmacophore query (selection), A is the number of active compounds in the entire validation dataset (Actives), and N is the number of all compounds in the validation dataset (Number of entries in the validation dataset).29
Screening of this validation set with the 4th-ranked model (Fig. 5) retrieved 9 out of 12 active compounds (75.0%) and 14 out of 1712 inactive compounds (0.8%) using ‘fast flexible search’. Additionally, the Receiver Operating Characteristic (ROC) curve method was used for the quality control.30,31 The area under the curve (AUC) of the displayed ROC plot can be used as measure for the enrichment of a screening method, referred to as ROC/AUC. This enrichment plot, a two-dimensional graph that displays the true positive rate (sensitivity) against the false positive rate (1-specificity), is used for the evaluation to address the issue of early enrichment in virtual screening experiments. In detail, this enrichment plot is described elsewhere.30,32
Figure 5.

Representation of the 3D pharmacophore model—Chemical features are color coded: cyan - hydrophobic feature, green - hydrogen-bond acceptor, and blue - negative ionizable (A). Mapping of the biologically active virtual hit compound 31 to the model (B).
The EF of 56.2 and the ROC/AUC of 0.87 (Fig. 6) pointed towards an excellent model quality, and represented the best results of all created models.
Figure 6.

ROC curve for the theoretical validation of the developed 3D pharmacophore model.
To experimentally evaluate the predictive power of the developed 3D pharmacophore model, the NCI database (247041 entries) was virtually screened.33 For the generation of the conformational models for the NCI compounds a maximum number of 100 conformations per molecule and ‘FAST’ quality was employed. The virtual screening was performed using ‘fast flexible search’ and returned 185 hits (0.07%). For the selection of test compounds, we focused on (i) structurally diverse compounds, (ii) which were available at the time of our study, and (iii) which achieved high pharmacophore fit values. For assessment of cPLA2α inhibition, a cell-free in vitro assay based on isolated human recombinant cPLA2α was used and the cPLA2α reference inhibitor N-{(2S,4R)-4-(biphenyl-2-ylmethyl-isobutyl-amino)-1-[2-(2,4-difluorobenzoyl)-benzoyl]-pyrrolidin-2-ylmethyl}-3-[4-(2,4-dioxothiazolidin-5-ylidenemethyl)-phenyl]acrylamide (compound 43) was used as control to validate the assay (for details see Supplementary data). Biological evaluation of 12 virtual hits showed that compound 31 (Fig. 7) inhibited isolated human recombinant cPLA2α in the cell-free assay with an IC50 value in the low micromolar range (IC50 = 4 μM; Supplementary data Fig. S1). All other compounds (32–42, Supplementary data Chart S1) failed to inhibit cPLA2α activity at a concentration of 10 μM by more than 40%. Higher concentrations than 10 μM were not tested due to poor solubility in the aqueous assay buffer. The novel bioactive compound 31 was further analyzed for inhibition of cPLA2α-mediated AA release in a cell-based model using Ca2+-ionophore A23187-stimulated human monocytes (for details see Supplementary data). In fact, 31 inhibited AA release from human monocytes with similar potency (IC50 = 5 μM; Supplementary data Fig. S1) as in the cell-free in vitro assay. Again, the cPLA2α reference inhibitor 43 inhibited AA release as expected (Supplementary data Fig. S1). Together, compound 31 can be considered as an interesting candidate for further chemical optimization to obtain potent inhibitors of eicosanoid-related inflammation and cancer.
Figure 7.

Biologically active compound 31.
The next step in the development represents the characterization of the pharmacological profile of 31 against other targets relevant in the production of PGs and LTs. Unfortunately, the identification of a novel chemical class not composed of a reactive moiety, such as an activated carbonyl group, was not achieved. The results even suggest that a reactive moiety is essential for the potency of the compounds investigated. This finding can be considered in the virtual screening workflow by including a pre-filtering step to recognize reactive moieties and a refinement of the 3D model.
Acknowledgments
This work was funded by the NFN-Project ‘Drugs from nature targeting inflammation – DNTI’, from the Austrian Science Foundation (FWF Projects S10702/S10711 and S10703). We also thank Patrick Markt for his assistance in the theoretical model validation. S.M.N. is grateful for a Young Talents Grant from the University of Innsbruck. S.K. was supported by the Tyrolean Science Foundation (TWF). We acknowledge the NCI for providing the test compounds.
Footnotes
Supplementary data associated with this article can be found, in the online version, at doi:10.1016/j.bmcl.2011.11.093.
Supplementary data
General procedures.
References and Notes
- 1.Magrioti V., Kokotos G. Expert Opin. Ther. Pat. 2010;20:1. doi: 10.1517/13543770903463905. [DOI] [PubMed] [Google Scholar]
- 2.Niknami M., Patel M., Witting P.K., Dong Q. Int. J. Biochem. Cell Biol. 2009;41:994. doi: 10.1016/j.biocel.2008.07.017. [DOI] [PubMed] [Google Scholar]
- 3.Shimizu T., Ohto T., Kita Y. IUBMB Life. 2006;58:328. doi: 10.1080/15216540600702289. [DOI] [PubMed] [Google Scholar]
- 4.Burke J.E., Dennis E.A. J. Lipid Res. 2009:S237. doi: 10.1194/jlr.R800033-JLR200. [DOI] [PMC free article] [PubMed] [Google Scholar]
- 5.Kokotos G., Six D.A., Loukas V., Smith T., Constantinou-Kokotou V., Hadjipavlou-Litina D., Kotsovolou S., Chiou A., Beltzner C.C., Dennis E.A. J. Med. Chem. 2004;47:3615. doi: 10.1021/jm030485c. [DOI] [PubMed] [Google Scholar]
- 6.Tai N., Kuwabara K., Kobayashi M., Yamada K., Ono T., Seno K., Gahara Y., Ishizaki J., Hori Y. Inflamm. Res. 2010;59:53. doi: 10.1007/s00011-009-0069-8. [DOI] [PubMed] [Google Scholar]
- 7.Lee K.L., Behnke M.L., Foley M.A., Chen L., Wang W., Vargas R., Nunez J., Tam S., Mollova N., Xu X., Shen M.W., Ramarao M.K., Goodwin D.G., Nickerson-Nutter C.L., Abraham W.M., Williams C., Clark J.D., McKew J.C. Bioorg. Med. Chem. 2008;16:1345. doi: 10.1016/j.bmc.2007.10.060. [DOI] [PubMed] [Google Scholar]
- 8.McKew J.C., Lee K.L., Shen M.W., Thakker P., Foley M.A., Behnke M.L., Hu B., Sum F.W., Tam S., Hu Y., Chen L., Kirincich S.J., Michalak R., Thomason J., Ipek M., Wu K., Wooder L., Ramarao M.K., Murphy E.A., Goodwin D.G., Albert L., Xu X., Donahue F., Ku M.S., Keith J., Nickerson-Nutter C.L., Abraham W.M., Williams C., Hegen M., Clark J.D. J. Med. Chem. 2008;51:3388. doi: 10.1021/jm701467e. [DOI] [PubMed] [Google Scholar]
- 9.Drews A., Bovens S., Roebrock K., Sunderkotter C., Reinhardt D., Schafers M., van der Velde A., Schulze Elfringhoff A., Fabian J., Lehr M. J. Med. Chem. 2010;53:5165. doi: 10.1021/jm1001088. [DOI] [PubMed] [Google Scholar]
- 10.Nagase T., Uozumi N., Aoki-Nagase T., Terawaki K., Ishii S., Tomita T., Yamamoto H., Hashizume K., Ouchi Y., Shimizu T. Am. J. Physiol. Lung Cell. Mol. Physiol. 2003;284:L720. doi: 10.1152/ajplung.00396.2002. [DOI] [PubMed] [Google Scholar]
- 11.Lee K.L., Foley M.A., Chen L., Behnke M.L., Lovering F.E., Kirincich S.J., Wang W., Shim J., Tam S., Shen M.W., Khor S., Xu X., Goodwin D.G., Ramarao M.K., Nickerson-Nutter C., Donahue F., Ku M.S., Clark J.D., McKew J.C. J. Med. Chem. 2007;50:1380. doi: 10.1021/jm061131z. [DOI] [PubMed] [Google Scholar]
- 12.Uozumi N., Kume K., Nagase T., Nakatani N., Ishii S., Tashiro F., Komagata Y., Maki K., Ikuta K., Ouchi Y., Miyazaki J., Shimizu T. Nature. 1997;390:618. doi: 10.1038/37622. [DOI] [PubMed] [Google Scholar]
- 13.Whalen K.A., Legault H., Hang C., Hill A., Kasaian M., Donaldson D., Bensch G.W., Bensch G., Baker J., Reddy P.S., Wood N., Ramarao M.K., Ellis D.K., Csimma C., McKee C., Clark J.D., Ryan J., Dorner A.J., O’Toole M. Clin. Exp. Allergy. 2008;38:1590. doi: 10.1111/j.1365-2222.2008.03059.x. [DOI] [PMC free article] [PubMed] [Google Scholar]
- 14.Patel M.I., Singh J., Niknami M., Kurek C., Yao M., Lu S., Maclean F., King N.J., Gelb M.H., Scott K.F., Russell P.J., Boulas J., Dong Q. Clin. Cancer Res. 2008;14:8070. doi: 10.1158/1078-0432.CCR-08-0566. [DOI] [PMC free article] [PubMed] [Google Scholar]
- 15.Haeggstrom J.Z., Rinaldo-Matthis A., Wheelock C.E., Wetterholm A. Biochem. Biophys. Res. Commun. 2010;396:135. doi: 10.1016/j.bbrc.2010.03.140. [DOI] [PubMed] [Google Scholar]
- 16.Langer T. Mol. Inf. 2010;29:470. doi: 10.1002/minf.201000022. [DOI] [PubMed] [Google Scholar]
- 17.Yang S.Y. Drug Discov. Today. 2010;15:444. doi: 10.1016/j.drudis.2010.03.013. [DOI] [PubMed] [Google Scholar]
- 18.Accelrys Software Inc.: San Diego, CA, 2005.
- 19.Kurogi Y., Güner O.F. Curr. Med. Chem. 2001;8:1035. doi: 10.2174/0929867013372481. [DOI] [PubMed] [Google Scholar]
- 20.Leach A.R., Gillet V.J., Lewis R.A., Taylor R. J. Med. Chem. 2010;53:539. doi: 10.1021/jm900817u. [DOI] [PubMed] [Google Scholar]
- 21.Noha S.M., Atanasov A.G., Schuster D., Markt P., Fakhrudin N., Heiss E.H., Schrammel O., Rollinger J.M., Stuppner H., Dirsch V.M., Wolber G. Bioorg. Med. Chem. Lett. 2011;21:577. doi: 10.1016/j.bmcl.2010.10.051. [DOI] [PMC free article] [PubMed] [Google Scholar]
- 22.Schuster D., Spetea M., Music M., Rief S., Fink M., Kirchmair J., Schutz J., Wolber G., Langer T., Stuppner H., Schmidhammer H., Rollinger J.M. Bioorg. Med. Chem. 2010;18:5071. doi: 10.1016/j.bmc.2010.05.071. [DOI] [PubMed] [Google Scholar]
- 23.Ludwig J., Bovens S., Brauch C., Elfringhoff A.S., Lehr M. J. Med. Chem. 2006;49:2611. doi: 10.1021/jm051243a. [DOI] [PubMed] [Google Scholar]
- 24.Connolly S., Bennion C., Botterell S., Croshaw P.J., Hallam C., Hardy K., Hartopp P., Jackson C.G., King S.J., Lawrence L., Mete A., Murray D., Robinson D.H., Smith G.M., Stein L., Walters I., Wells E., Withnall W.J. J. Med. Chem. 2002;45:1348. doi: 10.1021/jm011050x. [DOI] [PubMed] [Google Scholar]
- 25.Fritsche A., Elfringhoff A.S., Fabian J., Lehr M. Bioorg. Med. Chem. 2008;16:3489. doi: 10.1016/j.bmc.2008.02.019. [DOI] [PubMed] [Google Scholar]
- 26.Walters I., Bennion C., Connolly S., Croshaw P.J., Hardy K., Hartopp P., Jackson C.G., King S.J., Lawrence L., Mete A., Murray D., Robinson D.H., Stein L., Wells E., John Withnall W. Bioorg. Med. Chem. Lett. 2004;14:3645. doi: 10.1016/j.bmcl.2004.05.024. [DOI] [PubMed] [Google Scholar]
- 27.ChEMBL version 03, http://www.ebi.ac.uk/chembldb/.
- 28.SciTegic: San Diego, CA, 2008.
- 29.Güner O.F., Waldman M., Hoffmann R., Kim J.H., editors. Strategies for database mining and pharmacophore development. International University Line; La Jolla, CA, U.S.A.: 2000. [Google Scholar]
- 30.Triballeau N., Acher F., Brabet I., Pin J.P., Bertrand H.O. J. Med. Chem. 2005;48:2534. doi: 10.1021/jm049092j. [DOI] [PubMed] [Google Scholar]
- 31.The statistical evaluation was performed using Analyse-it for Microsoft Excel (version 2.20). Analyse-it Software, Ltd. http://www.analyse-it.com/ 2009.
- 32.Clark R.D., Webster-Clark D.J. J. Comput. Aided Mol. Des. 2008;22:141. doi: 10.1007/s10822-008-9181-z. [DOI] [PubMed] [Google Scholar]
- 33.National Cancer Institute, Release 2003. http://dtp.nci.nih.gov//docs/dtp_search.html.
Associated Data
This section collects any data citations, data availability statements, or supplementary materials included in this article.
Supplementary Materials
General procedures.