Abstract
Introduction
Cherubism is a human genetic disorder that causes bilateral symmetrical enlargement of the maxilla and mandible in children. It is caused by mutations in SH3BP2. The exact pathogenesis of the disorder is an area of active research. Sh3bp2 knock-in mice were developed by introducing a Pro416Arg mutation (Pro418Arg in humans) in the mouse genome. The osteoclast phenotype of this mouse model was recently described.
Methods
We examined the bone phenotype of the cherubism mouse model, the role of Sh3bp2 during bone formation, osteoblast differentiation and osteoblast function.
Results
We observed delays in early postnatal development of homozygous Sh3bp2KI/KI mice. Sh3bp2KI/KI mice exhibit increased growth plate thickness and significantly decreased trabecular bone thickness and reduced bone mineral density. Histomorphometric and μ-CT analyses reveal bone loss in cranial and appendicular skeleton. Sh3bp2KI/KI mice also exhibit a significant decrease in osteoid formation that indicates a defect in osteoblast function. Calvarial osteoblast cell cultures exhibit a decrease in alkaline phosphatase expression and mineralization suggesting reduced differentiation potential. Gene expression of osteoblast differentiation markers like collagen type-I, alkaline phosphatase and osteocalcin are decreased in osteoblast cultures from Sh3bp2KI/KI mice.
Conclusions
These data suggest that Sh3bp2 function regulates bone homeostasis not only through osteoclast-specific effects but also through effects on osteoblast differentiation and function.
Keywords: Cherubism, Sh3bp2, Bone, Knock-in mice, Osteoblast differentiation, Osteoclast
INTRODUCTION
Cherubism is an autosomal dominant human genetic fibro-osseous disorder that affects children around 3 to 4 years of age 1,2. Symmetrical cyst-like cavities in maxillae and mandibles are the hallmark of cherubism. Cavities fill in with soft fibrous tissue, which is histologically indistinguishable from giant cell granulomas 3. Expansion of the fibrous tissue can lead to characteristic facial deformities in cherubism patients. In most cases, the fibrous lesions regress spontaneously after puberty 2,4. Mild cases of cherubism may escape from initial clinical diagnosis. Typically, patients exhibit multiple radiolucencies, more frequently in the mandible 5. Only in severe cases, after the cessation of the active phase of the disorder, there is some amount of facial deformity and the patients may need surgical correction. Mutations for cherubism have been identified in SH3BP2, which codes for an adaptor protein expressed in several cell types including osteoblasts and osteoclasts 6,7. Adaptor proteins usually lack enzymatic activity but are important for forming protein complexes by interacting with other proteins involved in signal transduction. The function of SH3BP2 is not well understood. Studies of T- and B-lymphoid cells suggest that SH3BP2 may act as a stimulator of nuclear factor of activated T-cells (NFAT)-mediated transcription. Other studies suggest that increase in NFAT activity increases osteoclastogenesis and may regulate osteoblast proliferation 8–13.
To investigate mechanisms leading to cherubism, Ueki et al., 2007 developed a knock-in mouse model by introducing a Pro416Arg mutation in SH3BP2 (Pro418Arg in humans) into the mouse genome 14. Homozygous knock-in (Sh3bp2KI/KI) mice are osteopenic with increased numbers of osteoclasts and exhibit increased macrophagic infiltration and a significant increase in tumor necrosis factor-α (TNF-α). The results of Ueki et al. suggest that bone loss in cherubism is in part due to the inflammatory effects of TNF-α leading to increased osteoclastogenesis, which is consistent with a previous report 15 showing that TNF-α can induce inflammatory bone loss via increased osteoclastogenesis 16. The role of the cherubism mutation on osteoblast differentiation and function was not addressed.
The goal of this study was to further characterize the bone phenotype of cherubism knock-in mice and to examine the role of Sh3bp2 in osteoblast differentiation and function for the first time.
MATERIALS AND METHODS
Experimental Animals
Cherubism knock-in mice (Sh3bp2+/KI, Sh3bp2KI/KI) carry a Pro416Arg mutation in Sh3bp2 (equivalent to a Pro418Arg mutation in humans) 14. For our experiments, Sh3bp2+/KI mice were crossed with CD1 mice and F2 litters (male mice) were used except for QPCR experiments, where we used cells from C57B6 background. The Institutional Animal Care and Use Committee at the University of Connecticut Health Center, Farmington, Connecticut approved all animal protocols.
Whole Mount Staining
We performed skeletal analysis after Alcian blue and alizarin red staining on postnatal animals at days 7, 14 and 21. Male and female mice were pooled for this experiment (n=6). Briefly, animals were defleshed, eviscerated and fixed in 95% ethanol at room temperature for 7 days. Specimens were incubated in 0.015% Alcian blue in 95% glacial acetic acid overnight and subsequently treated in 95% ethanol for 2 days. Tissues were cleared in 1% aqueous solution of potassium hydroxide and incubated in 0.1% alizarin red in 1% potassium hydroxide overnight at room temperature. Samples were then passed through increasing concentrations of glycerol and stored in 100% glycerol at room temperature.
Skull Morphometry
Skulls of 10-week-old male mice were defleshed and fixed in 4% paraformaldehyde (PFA) at 4°C (n=6 for each group). Craniofacial morphology was assessed using previously described guidelines 17. We measured skull length, skull width, inner canthal distance and snout length and compared Sh3bp2+/+ mice to Sh3bp2+/KI and Sh3bp2KI/KI mice. Measurements were obtained using the measurement tool in Photoshop® version 7.0.
Dual Energy X-Ray Absorptiometry (DEXA)
Skulls, mandibles and femurs from 10-week-old male Sh3bp2+/+, Sh3bp2+/KI and Sh3bp2KI/KI mice were dissected and fixed in 4% PFA (n=6 for each group). Bone mineral density (BMD) and bone mineral content (BMC) were measured using a Lunar PIXImus densitometer (Lunar Corp., Madison WI).
Micro-Computed Tomography (μ-CT)
μ-CT was performed on femurs, calvariae and mandibles from 10-week-old male mice (n=6) using a mCT20 (Scanco Medical AG, Bassersdorf, Switzerland). Individual bones were dissected and adjacent soft tissue was carefully removed and fixed in 4% PFA. Trabecular measurements of femurs were taken at the distal growth plate in 80 consecutive slices of 12 μm resolution over a distance of 960 μm. Volumetric regions were rendered as 3-dimensional arrays with an isometric voxel dimension of 12 μm. 50 cross sectional slices of 12 μm in the mid-diaphysis were used to calculate cortical bone parameters. Mandibular cortical thickness was analyzed by measuring vertical sections at the mandibular foramen. Calvariae were analyzed over an area of 100 slices using the sagittal suture of the central parietal region as a reference point.
Static Histomorphometry
We used femurs from the same mice as for μ-CT (n=6). Decalcified bones were embedded in paraffin. 5 μm thick longitudinal serial sections were cut on a Reichert-Jung Polycut S microtome (Reichert-Jung, Germany) with a D profile knife (Delaware Diamond Knives Corp., Wilmington, DE). Sections were taken from the middle of the femur containing the central vein and were stained with modified Masson’s trichrome. Osteoblasts were identified as cuboidal cells lining trabecular bone. Osteoclasts were identified as multi-nucleated, tartrate-resistant acid phosphatase (TRAP) positive cells on trabecular surface. Osteoblast and osteoclast numbers were normalized to trabecular bone surface.
Quantification of osteoid thickness and average growth plate thickness was performed on 5 μm thick polymethylmethacrylate sections using Bioquant Software (Biometrics, Nashville, TN). The measurements, terminology and units were according to the Nomenclature Committee of American Society for Bone and Mineral Research recommendations 18.
Primary Calvarial Osteoblast Cell Cultures
Calvariae from 2 to 7-day-old mice were dissected free of sutures, placed in Dulbecco’s modified eagle medium (DMEM) supplemented with 10% fetal bovine serum (FBS), 100 IU/ml penicillin, 100 μg/ml streptomycin (Gibco BRL) and incubated overnight at 37°C in 5% CO 2. Calvariae of the same genotype were subjected to four sequential 15 minute digests with an enzyme mixture of 1.5 U/ml collagenase P (Roche Applied Science, Indianapolis, IN) in phosphate-buffered saline (PBS) and 0.05% trypsin/1mM EDTA (Gibco BRL, Grand Island, NY) at 37°C on a rocking platform. The second to fourth digests were pooled, the cell pellet collected by centrifugation and resuspended in DMEM and filtered through a 70 μm cell strainer (Becton Dickinson, Franklin Lakes, NJ). These fractions contain mainly osteoblasts and their progenitors. Cells were plated at a density of 1×10⁴ cells/cm2 in 24-well plates in DMEM containing 10 % FBS and antibiotics. Differentiation was induced by changing to α-MEM supplemented with 50 μg/ml ascorbic acid and 8 mM β-glycerophosphate (Sigma-Aldrich, St. Louis, MO) after one week. Media were changed every 2 days.
Cell growth and Apoptosis Assays
Calvarial osteoblasts were isolated and plated as described above. Cells in parallel plates were trypsinized and counted at days 1, 3, 5 and 7. For each group, cells were plated in triplicates and three readings were taken for each well. The assay was repeated thrice. For cell death assays, cells were plated in chamber slides (Lab-Tek II, Thermo Fisher Scientific, Rochester, NY) at a density of 1 × 10⁴ cells/cm2. When cells reached 50–60 % confluency, they were serum deprived for 3 days and incubated with 4 μg/ml camptothecin for 3–4 hours to induce apoptosis (Sigma-Aldrich, St Louis, MO). TUNEL assay was performed according to manufacturer’s protocol (Promega, Madison, WI). DNase I treatment was used as positive control and no enzyme treatment was used as negative control. Apoptosis rate was calculated as the ratio of TUNEL positive cells to total number of cells using Photoshop® version 7.0.
Alkaline Phosphatase and von Kossa Staining
Mouse calvarial osteoblasts grown in differentiation medium for 14 and 21 days were subjected to alkaline phosphatase staining according to the manufacturer’s protocol (Sigma-Aldrich, St. Louis, MO). Alkaline phosphatase-stained plates were further treated with von Kossa stain to detect mineralization. Briefly, samples were rinsed with deionized water, a 5% AgNO3 (Sigma-Aldrich, St. Louis, MO) solution was added and incubated under a light source for 40 minutes prior to quantification using a flat bed scanner and Photoshop® version 7.0.
RNA Isolation and Real-Time Quantitative PCR Analysis (QPCR)
Primary osteoblast calvarial cultures were differentiated and cells were harvested on days 0, 7, 14, and 21. Total RNA was isolated using Trizol reagent (Life Technologies, Grand Island, NY). cDNAs were prepared from total RNA using Sprint Power Script Oligo dT (BD Biosciences Palo Alto, CA). cDNA messages were amplified using an ABI7500 thermal cycler and ABI SYBR Green Power Mix. Mouse 18S RNA was used as reference. QPCR primer sequences are described in Table 1.
Table 1.
Primer Sequences used in QPCR Analysis
| Gene | Forward Primer (5′-3′) | Reverse Primer (5′-3′) |
|---|---|---|
| Col1a | 5′-ACGTCCTGGTGAAGTTGGTC-3′ | 5′-CAGGGAAGCCTCTTTCTCCT-3′ |
| Tnap | 5′-GCTGATCATTCCCACGTTTT-3′ | 5′-CTGGGCCTGGTAGTTGTTGT-3 |
| Bsp | 5′-CAGAGGAGGCAAGCGTCACT-3′ | 5′-CTGTCTGGGTGCCAACACTG-3′ |
| Runx2 | 5′-ACCTAGTTTGTTCTCTGATCGCCT-3′ | 5′-GGGATCTGTAATCTGACTCTGTCCTT-3′ |
| Ocn | 5′-AAGCAGGAGGGCAATAAGGT-3′ | 5′-TTTGTAGGCGGTCTTCAAGC-3′ |
| 18S | 5′-TTGACGGAAGGGCACCACCAG-3′ | 5′-GCACCACCACCCACGGAATCG-3′ |
Flow Cytometry (FACS) Analysis
Primary calvarial osteoblasts were isolated form newborn mice as described above and grown to confluency. Cells were either freshly isolated or cultured in differentiation medium for 2 weeks were trypsinized and labeled with antibodies against CD11b, CD45 and Ter199 (e-Biosciences, San Diego, CA) for FACS analysis (FACS Calibur, BD Biosciences, San Jose, CA).
Statistical Analysis
Each experiment was repeated thrice and data points for each experimental group were expressed as the mean ± standard error of the mean (SEM). Unpaired t-test was used to determine statistical significance between groups. P ≤ 0.05 (*) was considered significant.
RESULTS
Development and Morphometric Analysis
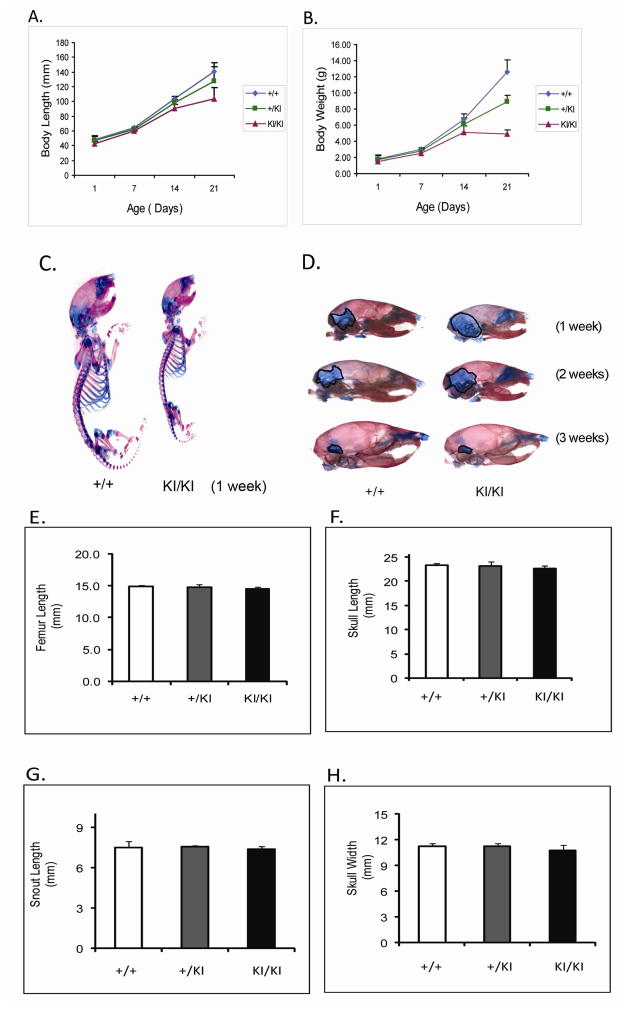
At one week of age, there was no detectable difference between Sh3bp2+/+ and Sh3bp2+/KI mice in size and behavior, while Sh3bp2KI/KI mice appeared smaller (Figure 1C). At age 3 weeks, we found a significant decrease in body length (p≤0.001) of Sh3bp2KI/KI mice (Figure 1A). Sh3bp2KI/KI mice measured 26% less in body length and Sh3bp2+/KI exhibited 9% reduction, respectively. There was a 61% reduction in body weight of Sh3bp2KI/KI mice and a 29% reduction in Sh3bp2+/KI mice (Figure 1B). Alcian blue (cartilage) and alizarin red (bone) staining revealed a slight delay in ossification (Figure 1D). Sh3bp2KI/KI mice retained cartilage in the occipital and parietal regions of the skull for the first 2 weeks of postnatal development. This delay in ossification was not noticeable by 3 weeks of age. Morphological evaluation of femur lengths and skull measurements revealed no significant decrease in Sh3bp2+/KI and Sh3bp2KI/KI mice (Figure 1E–H). On analyzing the growth plate of 10-week-old femurs, we found a significant increase in growth plate thickness in Sh3bp2+/KI (8%) and Sh3bp2KI/KI (21%) mice compared to Sh3bp2+/+ mice (Figure 2).
Fig. 1.
Development and morphometric analysis of cherubism knock-in mice. A, body length and B, body weight analysis. Sh3bp2KI/KI mice are significantly shorter (26%) and weigh about 61% less than Sh3bp2+/+ mice. Sh3bp2 +/KI mice have an intermediate phenotype at 3 weeks of age. C) Whole mount and D) Lateral skull view: skeletal staining with Alcian blue and alizarin red. Sh3bp2KI/KI mice exhibit increased area of cartilage in the parietal/occipital area of the skull at 2 weeks. E–H) Morphmetric analysis of femur and skull of 10-week-old male mice.
Fig. 2.
Growth plate analysis of 10-week-old male mice. A and B, Paraffin sections of 10-week-old femurs stained with hematoxylin and eosin. Black arrow indicates average growth plate thickness; C) Quantification of growth plate thickness. Average growth plate thickness is significantly increased in Sh3bp2KI/KI mice at 10 week of age.
Reduced Bone Density and Content in Sh3bp2KI/KI Mice
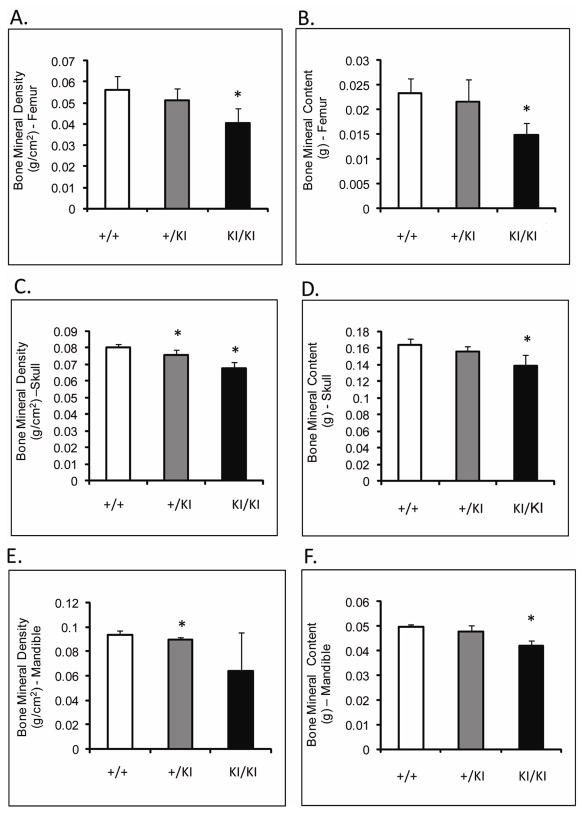
Femoral BMD (measured by DEXA) of Sh3bp2KI/KI mice was decreased by 27% (p≤0.001) and femoral BMC was decreased by over 36% (p≤0.0002) compared to Sh3bp2+/+ littermates (Figure 3A,B). The skull BMD and BMC of Sh3bp2KI/KI and Sh3bp2+/KI mice were significantly decreased by about 15% compared to Sh3bp2+/+ skulls (Figure 3C,D). Mandibular BMD and BMC were reduced by 31% and 14%, respectively in Sh3bp2KI/KI mice (Figure 3E,F). Overall, all bones examined in the mutant animals demonstrated a decrease in their BMD and BMC.
Fig. 3.
DEXA analysis of 10-week-old male mice. A) and B) BMD and BMC of femurs, C) and D) BMD and BMC of skulls, and E) and F) BMD and BMC of mandibles. Sh3bp2KI/KI mice exhibit a significant decrease in their bone density and mineral content in femurs, skulls and mandibular bones.
Sh3bp2KI/KI Mice have Severe Bone Loss
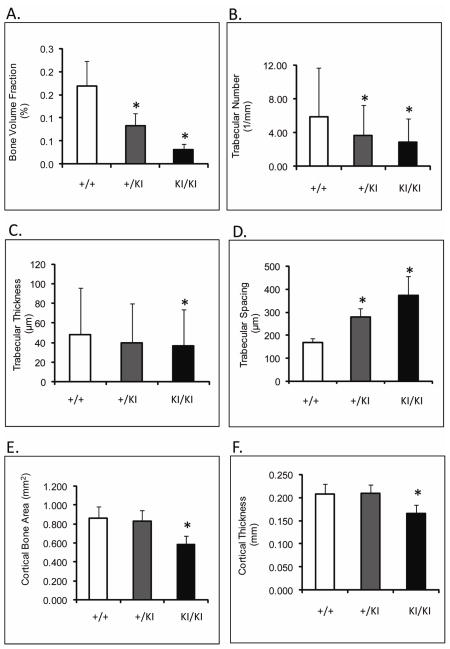
μ-CT revealed an 80% (p≤0.0013) decrease in femoral bone volume fraction of Sh3bp2KI/KI mice compared to Sh3bp2+/+ mice (Figure 4A). Trabecular thickness was reduced by 31% (p≤0.014), while trabecular number decreased by 51% (p≤0.0001) (Figure 4B,C,D). Cortical thickness was reduced by 20% and the cortical bone surface area was reduced by 32% in Sh3bp2KI/KI animals (p≤0.01) (Figure 4E,F). Mandibles and calvariae also exhibited similar patterns of bone loss (Table 2 and 3). In summary, 10- week-old Sh3bp2KI/KI mice described here (C57B6/CD1 F2 mice) display severe bone loss. These results are consistent with previous results from mice homozygous for the knock-in mutation and crossed into C57B6 background 14.
Fig. 4.
μ-CT analysis of femoral microstructure at 10 weeks of age. A) Bone volume fraction; B) Trabecular number; C)Trabecular thickness; D) Trabecular spacing; E) Cortical bone surface area; F) Cortical thickness. Trabecular and cortical bone measurements are significantly reduced in Sh3bp2+/KI and Sh3bp2KI/KI mice as compared to Sh3bp2+I/+ mice.
Table 2.
μ-CT measurements of mandibles from 10-week-old Sh3bp2+/+, Sh3bp2+/KI and Sh3bp2KI/KI male mice, (n=6).
| Parameters | Sh3bp2+/+ | Sh3bp2+/KI | Sh3bp2KI/KI |
|---|---|---|---|
| Cortical Thickness (mm) | 0.17 ± 0.03 | 0.17 ± 0.02 | 0.12 ± 0.02* |
| Condylar Width (mm) | 4.98 ± 0.17 | 4.91 ± 0.35 | 5.10 ± 0.18 |
| Incisor Length Measurement (mm) | 0.28 ± 0.02 | 0.27 ± 0.03 | 0.28 ± 0.01 |
Indicates significance (p≤ 0.05) compared to Sh3bp2+/+.
Table 3.
μ-CT analysis of calvariae from 10-week-old Sh3bp2+/+, Sh3bp2+/KI and Sh3bp2KI/KI male mice, (n=6).
| Parameters | Sh3bp2+/+ | Sh3bp2+/KI | Sh3bp2KI/KI |
|---|---|---|---|
| Cortical Width (mm) | 0.145 ± 0.028 | 0.156 ± 0.020 | 0.170 ± 0.019 * |
| Bone Marrow Area (%) | 6.5 ± 2.5 | 12.1 ± 4.9 * | 31.2 ± 7.9 * |
| Bone Area (%) | 93.5 ± 2.5 | 87.9 ± 4.9 * | 68.8 ± 7.9 * |
| Bone Area (mm2) | 0.285 ± 0.022 | 0.292 ± .047 | 0.236 ± 0.034 * |
| Total Area (mm2) | 0.305 ± 0.028 | 0.332 ± 0.045 | 0.344 ± 0.048 |
| Total Bone Marrow Space (mm2) | 0.020 ± 0.009 | 0.040 ± 0.017 * | 0.108 ± 0.034 * |
Indicates significance (p≤ 0.05) compared to Sh3bp2+/+.
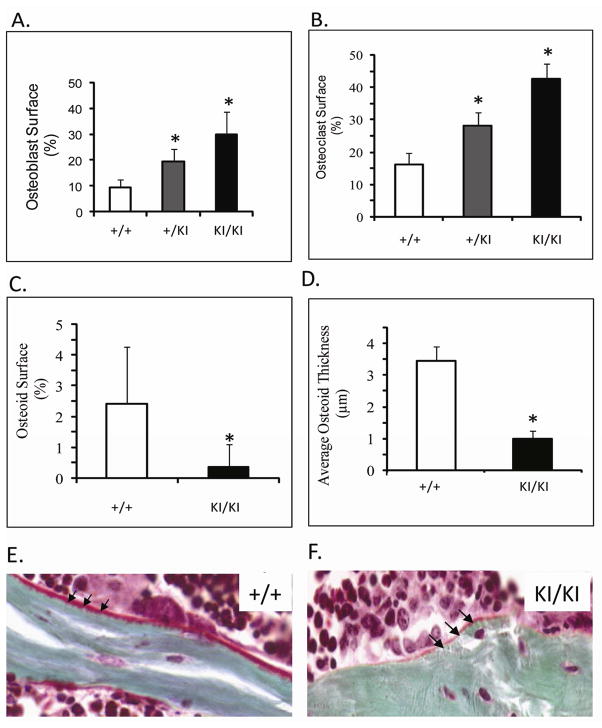
We observed a significant increase of over 80% in osteoblast surface between Sh3bp2+/+ and Sh3bp2KI/KI mice (Figure 5A). The increase in osteoclast number of up to 70% (TRAP+ cells) in Sh3bp2KI/KI and Sh3bp2+/KI mice (p≤0.000001, p≤0.0004) is consistent with previous findings (Figure 5B) 14. To assess bone deposition, we measured osteoid thickness and osteoid surface in trabecular bone and observed an 80% reduction in osteoid surface area (p≤0.05) and osteoid thickness in Sh3bp2KI/KI mice (Figure 5C–F).
Fig. 5.
Static histomorphometric analysis of femurs from 10-week-old male mice. A) Osteoblast surface and B) Osteoclast surface of trabecular bone. Osteoblast and osteoclast surface on trabecular bone is significantly increased in Sh3bp2+/KI and Sh3bp2KI/KI mice as compared to Sh3bp2+/+ mice. C) and D) Quantification of osteoid shows significant decrease in osteoid surface and osteoid thickness in Sh3bp2KI/KI mice. E) and F) Masson’s trichrome staining of undecalcified bone. Black arrows indicate osteoid deposition. Sh3bp2KI/KI bone has decreased osteoid.
In Vitro Assays of Primary Calvarial Osteoblast Cultures
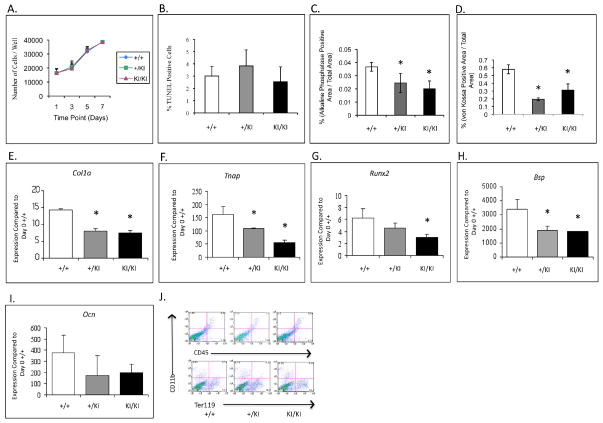
Analyses of calvarial osteoblast cultures showed comparable growth curves and no significant differences in apoptosis rates among Sh3bp2+/+, Sh3bp2+/KI and Sh3bp2KI/KI groups (Figure 6A,B). However, we observed decreases in differentiation and mineralization by alkaline phosphatase and von Kossa staining in Sh3bp2KI/KI cultures at 14 days in osteogenic medium (Figure 6C,D). Quantitative Polymerase Chain Reaction (QPCR) of calvarial osteoblasts at 14 days of osteogenic culture revealed a 3-fold decrease in the levels of alkaline phosphatase (Tnap) expression in Sh3bp2KI/KI cultures. Expression of Col1a, Bsp, Runx2 and Ocn was decreased as well (Figure 6E-I). To assess whether the Sh3bp2 mutation leads to a population shift between mesenchymal and hematopoietic cells, we performed FACS analysis and examined the overall population of CD45, CD11b and Ter119 (hematopoietic cell surface markers) in freshly isolated primary osteoblasts (Figure 6J) and in cells cultured in differentiation medium for 2 weeks (data not shown). We observed comparable numbers of CD45 positive cells (3.2%) in Sh3bp2+/+ and (4.2%) in Sh3bp2KI/KI cultures (Figure 6J). CD11b positive populations were 4.4% in Sh3bp2+/+ and 5.6% in the Sh3bp2KI/KI cultures, respectively. Similarly, there was no significant difference in Ter199 positive populations between Sh3bp2+/+ (13.7%) and Sh3bp2KI/KI (16.3%). Similar results were found in cultured cells.
Fig 6.
Calvarial osteoblast culture assays. A) and B) Growth curve and apoptosis assays. No significant difference in cell growth and apoptosis between control (Sh3bp2+/+) and mutant cultures (Sh3bp2+/KI Sh3bp2KI/KI). C) and D) Differentiation and mineralization assays. Significant decrease in alkaline phosphatase and von Kossa stained areas in Sh3bp2KI/KI cultures. E–I) QPCR analysis. Gene expression of osteoblast differentiation markers is significantly decreased in Sh3bp2KI/KI cultures as compared to control (Sh3bp2+/+) cultures and J) FACS analysis of freshly isolated calvarial osteoblasts after hematopoietic cell depletion. There is no significant difference in levels of CD45, CD11b and Ter119 positive cells between Sh3bp2KI/KI and Sh3bp2+/+ calvarial osteoblasts.
DISCUSSION
The goals of this study were to characterize the bone phenotype of cherubism knock-in mice and identify the role of Sh3bp2 in osteoblast differentiation and function. In a previous study Sh3bp2 knock-in mice were found to develop increased inflammatory bone loss due to increased numbers of highly active osteoclasts and increased levels of TNF-α 14. The role of the cherubism mutation on osteoblast differentiation and function was not addressed. The data presented here demonstrate for the first time that Sh3bp2 is important for bone formation and osteoblast differentiation and function.
Cherubism in humans appears to affect only the maxillary and mandibular bones. The development of cherubic lesions typically begins around the age of 3 to 4 years with progression through childhood and regression after puberty 1,2. In contrast to the human phenotype, cherubism knock-in mice exhibit bone destruction in all bones examined and the disorder appears to be progressive throughout life. In humans, cherubism is inherited in an autosomal dominant mode or occurs sporadically. However, in mice the more severe phenotype is seen in Sh3bp2KI/KI mice, while Sh3bp2+/KI mice show an intermediate phenotype. Differences in the bone-specific expression of autosomal dominant cherubism in humans may be due to species-specific phenotypic thresholds 19.
Developmental delays in humans have not been reported, possibly due to the rarity of the disorder or due to difficulty in identifying the clinical features early on in life. In postnatal developmental studies we found a significant decrease in body weight and length in Sh3bp2KI/KI mice at 3 weeks of age. However, the overall femur length in 10-week-old mice was not significantly reduced. We also found cartilage retention in craniofacial bones in Sh3bp2KI/KI mice during the first 2 weeks of life, which resolved after 3 weeks of postnatal development (Figure 1). These findings prompted us to study femoral growth plates by histomorphometry (Figure 2). We found an increase in growth plate thickness of Sh3bp2+/KI (8%) and Sh3bp2KI/KI mice (21%) indicating that a negative effect of the Sh3bp2 mutation on chondrocytes may contribute to the initial developmental delays.
Our histomorphometry and μ-CT analyses not only offer a more detailed view of the bone loss that has been reported previously 14, but reveal a compromised bone matrix with reduction in osteoid and hypomineralization of deposited bone. A significant decrease of BMD and BMC in femurs, skulls and mandibles by DEXA analysis confirmed the overall bone loss in this mouse model (Figure 3). Osteoid surface on trabecular bone of Sh3bp2KI/KI mice is reduced by over 80% and osteoid thickness is reduced 3-fold (Figure 5). Less osteoid generally suggests reduced bone deposition or increased bone turnover. Hypomineralization in this model may also be a sign of fast bone turnover, which is suggested by the almost 3-fold increase in osteoblast and osteoclast surface. The Sh3bp2 mutation leads to an increased number of highly active osteoclasts. Simultaneously to increasing osteoclastogenesis and bone resorption, the number of osteoblasts increases through a so-called coupling effect. However, the balance in this model is in favor of bone resorption, which leads to the osteoporosis-like phenotype. Despite increased numbers of osteoblasts and osteoclasts in vivo, cell growth and apoptosis assays did not show any significant differences between calvarial osteoblast cultures from Sh3bp2KI/KI and Sh3bp2+/+ mice (Figure 6).
Further studies in calvarial osteoblast cultures showed a decrease in both, alkaline phosphatase and von Kossa staining in mutant cultures, indicating delayed osteoblast maturation or reduced ability to produce matrix, specifically mineralized matrix. Calvarial osteoblast cultures are considered to contain primarily mesenchymal cells at various differentiation stages and some amounts of endothelial and hematopoietic cell populations. Previous studies 14 showed macrophage-rich inflammatory infiltrates in various tissues, including cystic lesions in cortical and calvarial bone, which lead to increased osteoclastogenesis in Sh3bp2KI/KI mice due to elevated TNF-α levels and response to lower concentrations of cytokines. Because of concerns of preferential hematopoietic cell proliferation we subjected fresh isolates and cell cultures to FACS analysis. We depleted freshly isolated calvarial osteoblasts of hematopoietic CD45 and CD11b expressing cells by negative selection using Dynabeads® and showed by FACS analysis that there was no significant increase of CD45+ and CD11b+ cell populations. These results indicate that the effects on osteoblast differentiation and function seen in cherubism mice such as decreased alkaline phosphatase levels and decreased osteoid are not due to secondary effects of Sh3bp2 on proliferation of hematopoietic cell populations. We found the same results in osteoblast cultures grown in osteogenic medium for 2 weeks (data not shown).
To quantify the expression of osteoblast marker genes we performed QPCR in 14-day-old osteogenic cultures (Figure 6). We found an over 3-fold decrease in Tnap expression in Sh3bp2KI/KI cultures. Both, early markers (Col1a, Tnap, and Runx2), as well as markers of later stages of osteoblast differentiation (Bsp and Ocn), were reduced in Sh3bp2KI/KI cultures, which is further evidence that the Sh3bp2 mutation negatively affects osteoblast differentiation. It is possible that fewer mutant osteoblasts reach maturity in vivo, however the molecular mechanisms by which Sh3bp2 regulates osteoblast maturation is still illusive. We believe that reduced differentiation of osteoblasts contributes in part to the osteoporosis-like phenotype of the Sh3bp2KI/KI mice and may affect not only the amount of bone deposited, but also bone quality.
In future experiments, we will correlate these results to the human phenotype. Cherubic lesions develop during mixed dentition when there is inflammatory response and tooth movement (exfoliation of primary teeth and eruption of permanent teeth). It will therefore be interesting to study the effects of the cherubism mutation in tooth movement experiments.
CONCLUSIONS
In summary, this work has helped to identify a new role for Sh3bp2 in osteoblast differentiation and function. We showed evidence that the cherubism mutation causes a functional osteoblast defect, which contributes in part to osteopenia in Sh3bp2KI/KI mice. However, further studies will be required to help understand the exact mechanism by which the cherubism mutation affects osteoblasts.
Acknowledgments
We thank the μ-CT and Histomorphometry Cores at the University of Connecticut Health Center, Farmington, Connecticut. This work was supported by institutional funds.
Footnotes
Publisher's Disclaimer: This is a PDF file of an unedited manuscript that has been accepted for publication. As a service to our customers we are providing this early version of the manuscript. The manuscript will undergo copyediting, typesetting, and review of the resulting proof before it is published in its final citable form. Please note that during the production process errors may be discovered which could affect the content, and all legal disclaimers that apply to the journal pertain.
Contributor Information
Padma M. Mukherjee, Department of Craniofacial Sciences, Division of Orthodontics, School of Dental Medicine, University of Connecticut, Farmington, CT 06030
Chiachien J. Wang, Department of Reconstructive Sciences, Center for Restorative Medicine and Skeletal Development, University of Connecticut Health Center, Farmington, CT 06030
I-Ping Chen, Department of Reconstructive Sciences, Center for Restorative Medicine and Skeletal Development, University of Connecticut Health Center, Farmington, CT 06030.
Toghrul Jafarov, Department of Reconstructive Sciences, Center for Restorative Medicine and Skeletal Development, University of Connecticut Health Center, Farmington, CT 06030
Bjorn R. Olsen, Department of Developmental Biology, Harvard School of Dental Medicine, Boston, MA 02115
Yasuyoshi Ueki, Department of Developmental Biology, Harvard School of Dental Medicine, Boston, MA 02115
Ernst J. Reichenberger, Department of Reconstructive Sciences, Center for Restorative Medicine and Skeletal Development, University of Connecticut Health Center, Farmington, CT 06030
References
- 1.Jones WA, Gerrie J, Pritchard J. Cherubism--familial fibrous dysplasia of the jaws. J Bone Joint Surg Br. 1950;32-B:334–347. doi: 10.1302/0301-620X.32B3.334. [DOI] [PubMed] [Google Scholar]
- 2.Jones WA, Gerrie J, Pritchard J. Cherubism--a familial fibrous dysplasia of the jaws. Oral Surg Oral Med Oral Pathol. 1952;5:292–305. doi: 10.1016/0030-4220(52)90129-1. [DOI] [PubMed] [Google Scholar]
- 3.Southgate J, Sarma U, Townend JV, Barron J, Flanagan AM. Study of the cell biology and biochemistry of cherubism. J Clin Pathol. 1998;51:831–837. doi: 10.1136/jcp.51.11.831. [DOI] [PMC free article] [PubMed] [Google Scholar]
- 4.Jones WA. Cherubism. A thumbnail sketch of its diagnosis and a conservative method of treatment. Oral Surg Oral Med Oral Pathol. 1965;20:648–653. doi: 10.1016/0030-4220(65)90111-8. [DOI] [PubMed] [Google Scholar]
- 5.Jain V, Gamanagatti SR, Gadodia A, Kataria P, Bhatti SS. Non-familial cherubism. Singapore Med J. 2007;48:e253–257. [PubMed] [Google Scholar]
- 6.Miah SM, Hatani T, Qu X, Yamamura H, Sada K. Point mutations of 3BP2 identified in human-inherited disease cherubism result in the loss of function. Genes Cells. 2004;9:993–1004. doi: 10.1111/j.1365-2443.2004.00784.x. [DOI] [PubMed] [Google Scholar]
- 7.Ueki Y, Tiziani V, Santanna C, Fukai N, Maulik C, Garfinkle J, et al. Mutations in the gene encoding c-Abl-binding protein SH3BP2 cause cherubism. Nat Genet. 2001;28:125–126. doi: 10.1038/88832. [DOI] [PubMed] [Google Scholar]
- 8.Chen G, Dimitriou ID, La Rose J, Ilangumaran S, Yeh WC, Doody G, et al. The 3BP2 adapter protein is required for optimal B-cell activation and thymus-independent type 2 humoral response. Mol Cell Biol. 2007;27:3109–3122. doi: 10.1128/MCB.01014-06. [DOI] [PMC free article] [PubMed] [Google Scholar]
- 9.Deckert M, Rottapel R. The adapter 3BP2: how it plugs into leukocyte signaling. Adv Exp Med Biol. 2006;584:107–114. doi: 10.1007/0-387-34132-3_8. [DOI] [PubMed] [Google Scholar]
- 10.Deckert M, Tartare-Deckert S, Hernandez J, Rottapel R, Altman A. Adaptor function for the Syk kinases-interacting protein 3BP2 in IL-2 gene activation. Immunity. 1998;9:595–605. doi: 10.1016/s1074-7613(00)80657-3. [DOI] [PubMed] [Google Scholar]
- 11.Foucault I, Liu YC, Bernard A, Deckert M. The chaperone protein 14-3-3 interacts with 3BP2/SH3BP2 and regulates its adapter function. J Biol Chem. 2003;278:7146–7153. doi: 10.1074/jbc.M209509200. [DOI] [PubMed] [Google Scholar]
- 12.Franzoso G, Carlson L, Xing L, Poljak L, Shores EW, Brown KD, et al. Requirement for NF-kappaB in osteoclast and B-cell development. Genes Dev. 1997;11:3482–3496. doi: 10.1101/gad.11.24.3482. [DOI] [PMC free article] [PubMed] [Google Scholar]
- 13.Winslow MM, Pan M, Starbuck M, Gallo EM, Deng L, Karsenty G, et al. Calcineurin/NFAT signaling in osteoblasts regulates bone mass. Dev Cell. 2006;10:771–782. doi: 10.1016/j.devcel.2006.04.006. [DOI] [PubMed] [Google Scholar]
- 14.Ueki Y, Lin CY, Senoo M, Ebihara T, Agata N, Onji M, et al. Increased myeloid cell responses to M-CSF and RANKL cause bone loss and inflammation in SH3BP2 “cherubism” mice. Cell. 2007;128:71–83. doi: 10.1016/j.cell.2006.10.047. [DOI] [PubMed] [Google Scholar]
- 15.Yao Z, Li P, Zhang Q, Schwarz EM, Keng P, Arbini A, et al. Tumor necrosis factor-alpha increases circulating osteoclast precursor numbers by promoting their proliferation and differentiation in the bone marrow through up-regulation of c-Fms expression. J Biol Chem. 2006;281:11846–11855. doi: 10.1074/jbc.M512624200. [DOI] [PubMed] [Google Scholar]
- 16.Kitaura H, Zhou P, Kim HJ, Novack DV, Ross FP, Teitelbaum SL. M-CSF mediates TNF-induced inflammatory osteolysis. J Clin Invest. 2005;115:3418–3427. doi: 10.1172/JCI26132. [DOI] [PMC free article] [PubMed] [Google Scholar]
- 17.Richtsmeier JT, Baxter LL, Reeves RH. Parallels of craniofacial maldevelopment in Down syndrome and Ts65Dn mice. Dev Dyn. 2000;217:137–145. doi: 10.1002/(SICI)1097-0177(200002)217:2<137::AID-DVDY1>3.0.CO;2-N. [DOI] [PubMed] [Google Scholar]
- 18.Parfitt AM, Drezner MK, Glorieux FH, Kanis JA, Malluche H, Meunier PJ, et al. Bone histomorphometry: standardization of nomenclature, symbols, and units. Report of the ASBMR Histomorphometry Nomenclature Committee. J Bone Miner Res. 1987;2:595–610. doi: 10.1002/jbmr.5650020617. [DOI] [PubMed] [Google Scholar]
- 19.Liao BY, Zhang J. Null mutations in human and mouse orthologs frequently result in different phenotypes. Proc Natl Acad Sci U S A. 2008;105:6987–6992. doi: 10.1073/pnas.0800387105. [DOI] [PMC free article] [PubMed] [Google Scholar]


