

Abstract
Purpose
Aberrant promoter methylation and genomic instability occur frequently during colorectal cancer (CRC) development. CpG island methylator phenotype (CIMP) has been shown to associate with microsatellite instability, BRAF mutation and often found in the right-side colon. Nevertheless, the relative importance of CIMP and chromosomal instability (CIN) for tumorigenesis has yet to be thoroughly investigated in sporadic CRCs.
Experimental Design
We determined CIMP in 161 primary CRCs and 66 matched normal mucosae using a quantitative bisulfite/PCR/LDR/Universal Array assay. The validity of CIMP was confirmed in a subset of 60 primary tumors using MethyLight assay and five independent markers. In parallel, chromosomal instability was analyzed in the same study cohort using Affymetrix 50K Human Mapping arrays.
Results
The identified CIMP-positive cancers correlate with microsatellite instability (p=0.075) and the BRAF mutation V600E (p=0.00005). The array-based high-resolution analysis of chromosomal aberrations indicated that the degree of aneuploidy is spread over a wide spectrum among analyzed CRCs. Whether CIN was defined by copy number variations in selected microsatellite loci (criterion 1) or considered as a continuous variable (criterion 2), CIMP-positive samples showed a strong correlation with low-degree chromosomal aberrations (p=0.075 and 0.012, respectively). Similar correlations were observed when CIMP was determined using MethyLight assay (p=0.001 and 0.013, respectively).
Conclusion
CIMP-positive tumors generally possess lower chromosomal aberrations, which may only be revealed using a genome-wide approach. The significant difference in the degree of chromosomal aberrations between CIMP-positive and the remainder samples suggests that epigenetic (CIMP) and genetic (CIN) abnormalities may arise from independent molecular mechanisms of tumor progression.
Keywords: CpG island methylator phenotype (CIMP), chromosomal instability (CIN), loss of heterozygosity (LOH), methylation and microarray
Introduction
Aberrant DNA methylation and genomic instability are hallmarks of colorectal cancer (CRC) development. Two types of altered methylation patterns, gene-specific promoter hypermethylation and genome-wide hypomethylation, have been demonstrated to interfere with gene expression in CRC. While aberrant promoter hypermethylation at the 5’ regulatory regions or CpG islands impairs gene function by transcription silencing, which has been demonstrated in numerous well known tumor suppressor genes (1-3), global demethylation tends to occur at parasitic sequences or transposons resulting in the reactivation of this otherwise silenced genetic information (4-6). Changes in genome integrity during carcinogenesis are typically attributed to either chromosomal instability (CIN) or microsatellite instability (MSI). The characteristic feature of CIN tumors is aneuploidy, which presents as the change of an entire or a significant portion of a chromosomal arm, including, but not limited to, deletion, amplification and loss of heterozygosity (LOH) (7, 8). Alternatively, MSI tumors are known to have different number of short microsatellite DNA repeats but retain a diploid genome. The relative importance of aberrant DNA methylation and genomic instability for tumorigenesis has been described in several areas. Evidence for biallelic inactivation of tumor suppressor genes resulting from methylation silencing and LOH has been established in human cancers (9-11). Genome-wide demethylation has been shown to correlate with CIN phenotype in primary CRCs (12). CpG island methylator phenotype (CIMP), a subtype of CRCs originally discovered using a set of hypermethylated genomic loci that were significantly presented in the tumors (also referred to as type “C” or “cancer-specific” markers) (13), has been suggested to precede the “mutator phenotype” in MSI tumor progression. Most interestingly, a recent study proposed that sporadic CRCs with no CIN and CIN—/MSI— phenotypes were associated with CIMP (14), suggesting that CIN and CIMP represent two independent mechanisms of genetic and epigenetic instability.
Although earlier reports suggested that the designation of a CIMP subgroup is merely an event with normal distribution of methylation rate and may be age- or MSI-dependent, the observation of such a phenotype has since been documented using various methylation markers (15-18). Recently, Weisenberger et al. conducted an elegant, systematic screening of 195 CpG island methylation markers using a quantitative MethyLight assay, and a new panel of robust markers was proposed to stratify CIMP tumors (19). All these carefully designed studies have demonstrated that CIMP correlates with DNA mutations and clinicopathologic features, including MSI, mutations in KRAS, BRAF and presentation on the proximal side of colon (18-23). Traditionally, the study of chromosomal imbalance has relied on methods such as flow cytometry–based ploidy assay, fluorescence in situ hybridization (FISH) and LOH analysis, yet only selected genomic regions were typically studied in each case. Consequently, these assays may not examine sufficient loci to distinguish the near-diploid genome from those with low-degree aberrations. The recent advances in DNA microarray technology have made the analysis of global aneuploidy possible using comparative genomic hybridization (CGH) and single-nucleotide polymorphism (SNP) arrays (24, 25). In particular, the latter offers a higher resolution mapping at the genome-wide scale and provides a mean to study CIN based on the degree of chromosomal aberrations.
The current study aimed to thoroughly investigate the relative importance of CIMP and CIN in CRC. The DNA methylation status of each tumor sample was determined using a quantitative bisulfite/PCR/LDR/Universal Array assay in a panel of 10 tumor suppressor genes (26). Tumor specific promoter hypermethylation emerged in the p16INK4a, p14ARF, TIMP3, MGMT and RARβ genes. These five markers, also referred to as classic CIMP genes, were used for CIMP study, where a total of 161 primary colorectal tumors were analyzed. Our results have shown that the presence of CIMP in primary colorectal tumors and correlated with MSI and the BRAF mutation V600E. Chromosomal aberrations were analyzed in 60 primary tumors from the same study cohort using Affymetrix 50K Human Mapping arrays. Aneuploidy was found in over 80% of cases when either LOH, gains or losses of chromosomes were considered. Our data reveal a variable extent of CIN among CRC samples, and tumors with a high level of hypermethylated loci associate with low-degree chromosomal aberrations. Similar results were obtained when CIMP was evaluated using MethyLight assay and markers of CACNA1G, IGF2, NEUROG1, RUNX3 and SOCS1. We have demonstrated that the degree of chromosomal aberrations in tumors bearing a high level of hypermethylated loci (“CIMP-positive”) differs significantly from other tumors within the same study cohort. This work emphasizes the importance of using quantitative and genome-wide approaches to study CIMP and CIN phenotypes in CRC.
Materials and Methods
Study population
The study population consisted of 161 male and female patients who presented at Memorial Sloan-Kettering Cancer Center (MSKCC) with a colonic neoplasm between 1992 and 2004. Following review of clinical and pathological data stored in institutional databases, cases of sporadic CRCs were selected for further study. This sample cohort was representative of colonic neoplasms at different stages of development. Primary colon tumors were located in the proximal, the distal colon, or the rectum. Stage of disease (AJCC criteria) also varied and included patients who presented to MSKCC with primary colon adenocarcinomas and/or adenomas, patients with primary adenocarcinomas and synchronous metastases to the liver and/or lung, and patients with recurrent disease (local and distant). The study cohort included White Non-Hispanic, White Hispanic, Black Non-Hispanic, Asian, and American Indian patients. Age ranged from 17 to 86 years old with a median age of 66. Biological specimens used in this study included primary colon adenocarcinomas, adenomas and corresponding normal mucosa. All 161 analyzed CRC specimens were thoroughly examined by MSKCC pathologists and micro-dissected. A subset of 60 tumors with greater than 80% of carcinoma cells was chosen for Affymetrix SNP array experiments. Tissues were procured at the time of surgical resection and stored for future use under institutional IRB approved protocols.
KRAS and BRAF mutation detection
Briefly, KRAS and BRAF mutations were detected using PCR/LDR approaches (27). The PCR primers used for K-RAS were: the forward primer 5’- TTT CAT TAT TTT TAT TAT AAG GCC TGC TGA-3’ and the reverse primer 5’- GAA TGG TCC TGC ACC AGT AAT ATG C-3’. The PCR primers used for BRAF were: the exon 15 forward primer 5’- TTC TAA TGC TTG CTC TGA TAG GA -3’ and the reverse primer 5’- GGC CAA AAA TTT AAT CAG TGG A -3’. Fluorescently labeled LDR primers were designed for the 7 common KRAS (Val, Asp, Ala, Arg, Ser, and Cys at codon 12 and Asp at codon 13) and BRAF V600E mutations. The sequences of KRAS LDR primers were reported previously (27). The LDR primer sequences for detecting BRAF mutation were as follows: wild-type specific primer: 5’- TTT AGT AAA AAT AGG TGA TTT TGG TCT AGC TAC AGT – 3’, mutant specific primer: 5’-AAA AAT AGG TGA TTT TGG TCT AGC TAC AGA – 3’, and common primer: Phos-5’-GAA ATC TCG ATG GAG TGG GTC C – 3’-FAM. One multiplex reaction was performed to assess mutation status. The PCR condition was as follows: 94 °C for 1.5 min, 35 cycles of 94 °C for 30 sec, 62 °C for 2 min and 72 °C for 1 min, followed by a final extension step at 72 °C for 3 min. Inactivation of the polymerase was achieved by a thermocycled proteinase K reaction. The LDR reaction was performed in a final volume of 20 μl consisting of 20 mM Tris-HCl pH 7.6, 10 mM MgCl2, 100 mM KCl, 10 mM DTT, 1 mM NAD, 500 - 800 fmol each of the LDR primers, 40U of Taq DNA Ligase, and 2 μl of PCR amplicon. The reaction mixture was thermocycled with the following program: 94° C for 1.5 min followed by 10 cycles of 94° C for 1 min and 65° C for 4 min. The final LDR products were resolved on a 377 DNA Prism Sequencer or a 3100 Genetic Analyzer (Applied Biosystems, Foster City, CA). The PCR/LDR method for detecting KRAS and BRAF mutations does have an estimated sensitivity of 1 in 500 wild-type sequences as shown in Khanna et al. (27). However, for these samples, a positive LDR signal represented mutation ranging from 25% to 100% of total peak intensity, verified by dideoxy sequencing and EndoV mutation scanning in selected samples. We determined KRAS and BRAF mutation statuses with either GeneScan software V3.1 or Genotyper V 3.7, respectively.
Microsatellite instability analysis
The microsatellite instability analysis has been described previously (28). Briefly, oligonucleotide primers for BAT25, BAT26, D2S123, D5S346, and D17S250 were designed and fluorescently labeled. The microsatellite assays were performed in a multiplex fashion and the PCR products were resolved on an ABI 3100 DNA Sequencer (Applied Biosystems, Foster City, CA). Every colorectal cancer specimen and its corresponding normal tissue were analyzed. Allele Size Instability (ASI) of microsatellite markers in cancer specimens was detected and distinguished from PCR stutter using Genotyper 3.7 software (Applied Biosystems, Foster City, CA). ASI was defined as the identification in a tumor of a novel-size allele; that is, an allele with a length not seen in normal colonic mucosa from the same individual. MSI status was determined in 161 CRCs and in all 161 matched normal tissues. MSI was scored as present when at least two of the five markers showed size instability. MSS was always scored when all markers were allele size stable.
Determination of promoter methylation status using bisulfite/PCR/LDR/Universal Array
The methylation levels of cytosines at CpG dinucleotides were determined using a quantitative bisulfite/PCR/LDR/Universal Array approach. The reaction conditions and primer sequences were described previously (26). The raw methylation levels of the interrogated cytosines were calculated as the fluorescence ratios of Cy3/(Cy3+Cy5). By measuring the fluorescence intensity of an equal molar amount of Cy3 and Cy5 labeled LDR primers, a fluorescence intensity ratio (W=ICy3/ICy5) was used to normalize the label bias. To determine the percentage of methylation, calibration curves of interrogated cytosines were established by mixing genomic DNAs of tumor cell lines (or in vitro methylated DNAs) and normal human lymphocytes in appropriate ratios. The methylation status of selected CpG sites present in the promoters of 10 tumor suppressor genes was initially determined in normal human lymphocytes using bisulfite sequencing. The majority of analyzed CpG cytosines did not show detectable hypermethylation, except for few sites at the p16INK4a and RARβ promoters. These few cytosines were either eliminated from the subsequent LDR assay or replaced with other neighboring non-methylated cytosines. The CpG cytosines with no detectable hypermethylation were considered as “zero” methylation for all the calibration curves. A promoter methylation status was determined by averaging the methylation levels of all six interrogated CpG sites (at the exception of RARβ with only four sites). In general, hypermethylation was scored when the averaged methylation of a promoter region was 10% or higher. Using this cut-off, we have confirmed that MGMT promoter hypermethylation correlated with a marked decrease of RNA expression (data not shown).
Determination of promoter methylation status using MethyLight
Real-time PCR to measure DNA methylation (MethyLight) was performed as previously reported (19). Briefly, five CIMP-specific markers, including CACNA1G, IGF2, NEUROG1, RUNX3 and SOCS1 were analyzed in each tumor sample using ABI 7500 (Applied Biosystems, Foster City, CA). ALU (Alu repeats) was used to normalize the amount of input bisulfite treated genomic DNA. All the primer and probe sequences were published previously (19). The percentage of methylated reference (PMR, i.e., degree of methylation) at each locus was calculated by dividing the ratio of GENE:ALU in a sample by the ratio of GENE:ALU in SssI-treated human genomic DNA (presumably fully methylated) and multiplying this value by 100. Positive methylation in each locus was defined as PMR > 10 as previously suggested (19). Tumor samples were scored as CIMP-positive when three or more (>= 3/5) markers were hypermethylated.
Copy Number and LOH analysis
The Affymetrix GeneChip Human Mapping 50K Xba 240 arrays (“SNP array”) were used to study overall chromosomal abnormalities. A total of 58,960 SNPs were detected on each array and the detailed protocol is described in the manufacturer’s manual and summarized in Tsafrir et al. (29). Briefly, genomic DNA was digested with XbaI and ligated onto adapters. PCR conditions were optimized to amplify fragments in the range of 250 to 2,000 base pairs in a GeneAmp PCR system 9700 (Applied Biosystems, Foster City, CA). PCR products were purified using a Qiagen MiniElute 96 UF PCR purification kit (Qiagen, Valencia, CA) and visualized on a 4% TBE agarose gel to confirm that the average size was smaller than 180 bp. The fragmented DNA was then biotin-labeled and hybridized to the array as described in the Affymetrix protocol. Following a staining and washing step, the array was scanned using GeneChip Scanner 3000 to generate image (DAT) and cell intensity (CEL) files. CEL files were imported into GeneChip DNA Analysis Software 4.0 (GDAS 4.0, Affymetrix) to generate the SNP calls. The Chromosomal Copy Number Analysis Tool 3.0 software (CNAT, Affymetrix) uses the probe intensity data, as well as the SNP calls to generate both the Single Point analysis (SPA) and Genomic Smoothed Analysis (GSA) copy number estimates and the corresponding p values. The degree of chromosomal aberrations in a given sample was determined by counting the number of abnormal chromosomal arms with deletion, amplification or LOH. The concepts and algorithms of CNAT were previously described (30). In addition, CNAT generates LOH calls based on the SNP calls. A default value of 0.5 Mb was used as the window size for averaging GSA values.
Statistical analysis
All correlations were performed by computing likelihood ratio chi-square statistics and associated p-values from the n x m contingency tables. When computing the chi-square statistics, the neighboring columns were merged into a single cell count if the expected number of observations was smaller than one. The odds ratio (OR) and 95% CI were computed from 2 × 2 contingency tables extracted from the n × m tables (SYSTAT software). Multiple testing correction was performed using the Benjamini-Hochberg method to find those tests with a false discovery rate (FDR) of at most 5%.
Results
Quantitative Bisulfite/PCR/LDR/Universal Array to determine CIMP
To select differentially hypermethylated candidate promoters in which their presence in tumors are statistically significant, a total of 86 primary colorectal tumors and 66 matched normal tissues were initially analyzed (Fig. 1). We used a recently developed quantitative bisulfite/PCR/LDR/Universal Array assay, that simultaneously detects 58 CpG loci methylation status in a panel of 10 tumor suppressor genes p16INK4a, p14ARF, TIMP3, APC, RASSF1, CDH1, MGMT, DAPK1, GSTP1 and RARβ. PCR primers were designed to target sequences that are essentially free of CpG dinucleotides, allowing equal amplification of both methylated and unmethylated DNAs in multiple genomic regions. The methylation level of each interrogated cytosine was determined using LDR and displayed on a Universal Array (26). Six CpG dinucleotide sites per promoter region (except for RARβ, where four sites were used) were analyzed. Promoter methylation status was scored by averaging the methylation levels of all interrogated CpG’s of that gene. This criterion effectively eliminated background signals and low level methylation that may not be relevant to the control of gene expression. An example is shown in the RARβ gene, where the fourth CpG site was frequently methylated from low to medium levels in the matched normal tissues (Fig. 1). By averaging the methylation levels of all four sites in RARβ, the impact of the sporadic methylation site was reduced and the scoring of false positive hypermethylation was minimized. Five promoter regions (p16INK4a, p14ARF, MGMT, RARβ and TIMP3) showed statistically significant increases of methylation in tumors compared to normal tissues (p < 0.001, Table 1). Using these five markers in a later validation study, the methylation status of 161 colorectal cancer samples were profiled and the number of tumor-specific, hypermethylated promoters in each sample was considered in a continuous fashion (Fig. 2 and Supplementary Materials, Fig S1). The lack of clear bimodal distribution of the hypermethylated loci in CRCs disfavored a simple dichotomization of the analyzed samples, instead, CIMP was regarded as a unimodal distribution in all subsequent studies.
Figure 1.
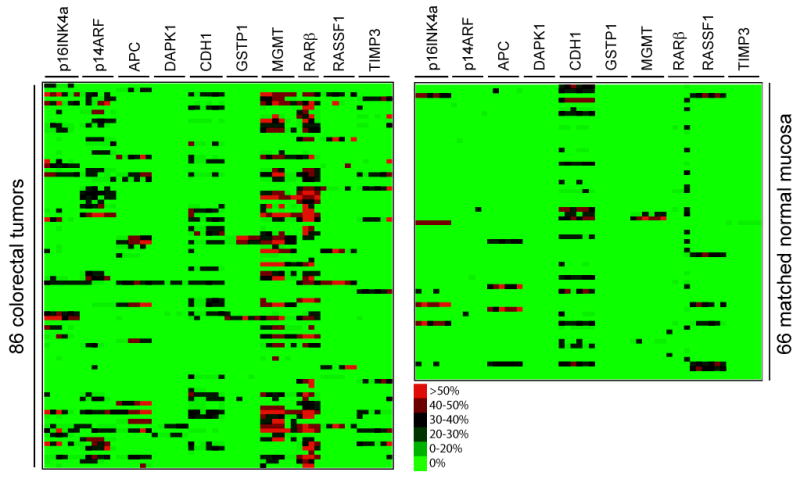
Identification of tumor-specific aberrant promoter hypermethylation. The cytosine methylation levels of a total 86 primary colorectal tumors and 66 matched normal mucosa were determined using bisulfite/PCR/LDR/Universal Array assay. Six CpG sites at each promoter region were analyzed for 10 candidate tumor suppressor genes (except RARβ with only four CpG sites). The color scale represents the percentage of methylation levels determined from the standard curves at each CpG dinucleotide as described previously (26). Promoter methylation status was determined by averaging the methylation levels of all interrogated cytosines within a particular gene. Using matched normal tissues as controls, the statistical significance of tumor –specific hypermethylation was calculated for each promoter region (see Table 1).
Table 1.
The significance of tumor-specific promoter hypermethylation
| Gene | chi-sq. | p | Gene | chi-sq. | p |
|---|---|---|---|---|---|
| MGMT | 44.692 | 0.000 | DAPK1 | 3.463 | 0.063 |
| p14ARF | 42.924 | 0.000 | GSTP1 | 3.463 | 0.063 |
| RARβ | 35.183 | 0.000 | APC | 3.352 | 0.067 |
| TIMP3 | 11.929 | 0.001 | RASSF1 | 0.228 | 0.633 |
| p16INK4a | 10.106 | 0.001 | CDH1 | 0.005 | 0.942 |
P-values highlighted in bold remain significant at 5% level after multiple testing correction.
Figure 2.

A dichotomous heat map of tumor methylation, mutation status, and selected clinicopathologic features. The DNA methylation status of 161 primary colorectal tumors were determined using the five CIMP markers p16INK4a, p14ARF, MGMT, RARβ and TIMP3. For each gene, instead of displaying the methylation levels of individual CpG sites, only the final methylation status of each promoter, either methylated or unmethylated, is indicated. A tumor was considered CIMP-positive if at least four of the five markers were methylated. The MSI, BRAF and KRAS mutation statuses were determined for each tumor sample. The alignment of each tumor is maintained across. The presence of hypermethylation, CIMP-positive, MSI, proximal side of colon, male gender, BRAF and KRAS mutations are indicated in red. The presence of unmethylated genes, CIMP-negative, non-MSI, distal side of colon, female gender, BRAF and KRAS wild-type alleles are indicated in green. The pink color in the CIMP column represents tumor samples with hypermethylation in three of the five markers. Few samples with no informative MSI, BRAF and KRAS mutation data are indicated in white.
CIMP correlates with MSI and BRAF mutation
A characteristic feature of the previously reported CIMP subgroup of CRCs is its substantial enrichment in MSI cases and BRAF mutations. To evaluate whether CIMP-positive samples identified in our approach had similar genetic alterations, we established the MSI, BRAF and KRAS mutation profiles in 161 CRC samples (Fig. 2). Our data show that CIMP correlates with MSI, suggesting that MSI tumors tend to have a higher proportion of methylated loci than their MSS counterparts (p = 0.075) (Table 2). A significant difference was also observed between BRAF V600E mutations and the number of methylated genes (Table 2). Individuals with BRAF mutations had approximately 18-fold risk of being CIMP-positive than individuals without BRAF mutations (p=0.0001, OR = 18.45, 95%CI = (4.51, 75.11)). The presence of higher percentage of BRAF mutants in the CIMP subgroup indicates that BRAF mutations significantly correlate with the hypermethylation phenotype (p = 0.00005).
Table 2.
The correlation between CIMP and gender, location, MSI, KRAS, and BRAF mutations
| No. of methylated loci (CIMP) | 0 | 1 | 2 | 3 | 4 | 5 | Total No. | P value | ||
|---|---|---|---|---|---|---|---|---|---|---|
| n | % | |||||||||
| Total (primary CRC) | 49 | 45 | 25 | 25 | 8 | 9 | 161 | |||
| Men | 26 | 23 | 10 | 10 | 3 | 5 | 77 | (48%) | ||
| Women | 23 | 22 | 15 | 15 | 5 | 4 | 84 | (52%) | 0.772 | |
| Distal | 39 | 29 | 17 | 16 | 4 | 3 | 108 | (67%) | ||
| Proximal | 10 | 16 | 8 | 9 | 4 | 6 | 53 | (33%) | 0.075 | |
| KRAS_WT | 32 | 28 | 15 | 13 | 6 | 5 | 99 | (63%) | ||
| KRAS_Mut | 16 | 16 | 10 | 11 | 2 | 4 | 59 | (37%) | 0.864 | |
| no info | 1 | 1 | 0 | 1 | 0 | 0 | 3 | |||
| MSI-H | 8 | 12 | 4 | 5 | 5 | 4 | 38 | (24%) | ||
| MSS | 40 | 32 | 21 | 19 | 3 | 5 | 120 | (76%) | 0.075 | |
| no info | 1 | 1 | 0 | 1 | 0 | 0 | 3 | |||
| BRAF_WT | 42 | 44 | 25 | 24 | 7 | 4 | 146 | (94%) | ||
| BRAF_Mut | 4 | 0 | 0 | 0 | 1 | 5 | 10 | (6%) | 0.00005 | |
| no info | 3 | 1 | 0 | 1 | 0 | 0 | 5 | |||
| MSI-H | BRAF_WT | 8 | 12 | 4 | 5 | 4 | 2 | 35 | (92%) | |
| BRAF_Mut | 0 | 0 | 0 | 0 | 1 | 2 | 3 | (8%) | 0.022 | |
| MSS | BRAF_WT | 36 | 32 | 21 | 19 | 3 | 3 | 114 | (94%) | |
| BRAF_Mut | 4 | 0 | 0 | 0 | 0 | 2 | 6 | (6%) | 0.03 | |
Since BRAF mutations are known to occur frequently in MSI tumors (31), we further investigated whether the highly significant correlation between BRAF mutation and CIMP may be MSI dependent. Tumor samples were split into MSI and MSS subgroups according to their BRAF mutation status (Table 2). In the MSI category, BRAF mutations were only identified in samples with a high level of methylated loci, but not present in others (p=0.022). In contrast, in the MSS subgroup, samples with no methylated loci harbored a BRAF mutation, which accounted for nearly two thirds of all BRAF mutants in MSS (p = 0.03). These findings indicate a higher frequency of BRAF mutations in the CIMP-positive subgroup independent of the tumor MSI status. Thus, our results strongly suggest that the highly significant correlation between BRAF mutation and CIMP does not simply reflect a common feature of MSI.
CIMP associates with low-degree chromosomal aberrations
The chromosomal aberration profiles of 60 primary colorectal tumors from the same study cohort were established (Note: A more comprehensive study of chromosomal aberrations in CRCs using the SNP array data will be published separately; Bacolod et al., in preparation). Data obtained from the matched normal tissues, in conjunction with Affymetrix reference controls, were used as scoring criteria to minimize the impact of individual germline copy number variations and random noise of allele intensity at each SNP site (data not shown). To validate SNP array results, the overall DNA fold-change in tumor samples were assessed by CGH arrays (29). A strong genome-wide correlation between SNP-derived and CGH-derived data was observed in all five tested carcinomas (an example is shown in Supplementary Material, Fig S2). In addition, copy number gains and losses at individual loci were determined using conventional assays. Frequent DNA amplification of chromosomal region 20q13.2 was confirmed in all six tested adenocarcinomas by FISH, with up to 10-20 fold copy number increases (29). The common chromosomal deletion at 5q21-22 was corroborated using the analysis of microsatellite markers (Supplementary Material, Fig S3): allelic imbalance was detected by comparing tumors with the matched adjacent normal tissues. Consistent with the SNP data, samples with no change in copy number were correctly identified as such using the microsatellite marker based approach.
As shown in Fig. 3, samples No. 1-8 showed relatively stable genomes with no apparent aneuploidy, whereas more than 80% of the analyzed CRCs displayed characteristic CIN features of copy number alterations and allelic imbalances. DNA copy number gains occurred most frequently in chromosomes 7p, 7q, 8q, 13q, and 20q, while copy number losses were most often detected in chromosomes 1p, 4p, 4q, 8p, 14q, 15q, 17p, 18p, and 18q. We noticed that the majority samples with MSI were not diploid and possessed low-degree chromosomal aberrations. Although this observation seems to contradict the conventional viewpoint of MSI (typically considered as diploid), it is consistent with the results of a recent study, which compared the extent of CIN in 23 MSI and 23 microsatellite stable (MSS) sporadic CRCs using array CGH (32). This study demonstrated that chromosomal aberrations are present in both MSI and MSS sporadic CRCs, but the degree of CIN differs significantly between the two groups.
Figure 3.

A genome-wide profiling of chromosomal aberrations in 60 primary colorectal tumors. Chromosomal gains and losses are depicted in a semi-quantitative heat map diagram. The color scale represents normalized copy number changes: loss of alleles (green), gain of one allele (red), gain of more than one allele (dark red), and no change of copy number (white). The yellow bars across multiple chromosomal loci represent the copy number neutral LOH events. The chromosome number and sample ID of each tumor are indicated on the X and Y axes, respectively. Tumor samples are organized and displayed based on their degree of aneuploidy. The dotted lines divide each chromosome into p and q arms. Four color-coded columns on the right depict the tumor CIN, MSI and CIMP status. The degree of CIN is presented in a continuous fashion with green to red colors representing the lowest to highest levels of overall chromosomal aberrations. The codes on the MSI column are: MSI-high (red), MSI-low (orange), and MSS (green). Two methods (LDR/Universal Array and MethyLight) were used to classify CIMP. The codes on the CIMP (LDR/array) column are: red, tumors with 4-5 hypermethylated CIMP loci; orange, tumors with 1-3 hypermethylated CIMP loci; green, tumors with no hypermethylated marker. The codes on the CIMP (MethyLight) column are: red, CIMP-positive; orange, CIMP-negative contains 1-2 hypermethylated CIMP loci; green, tumors with no hypermethylated marker.
Interestingly, genomic instability varied among CIMP-positive samples, with the most stable genome seen in sample No. 2 and the least stable one in No. 57. Samples No. 10, 11, 12, and 14 were clearly not exempt from chromosomal aberrations; however, their abnormalities were less substantial than those in No. 40 and 57. For instance, significant chromosomal losses and LOH events at chromosome 21 were identified in samples No. 10, 11, and 12, while gains at chromosomes 8 and 9 were found in samples No. 12, 13, and 14. To study the relationship between CIMP and CIN, we classified the CIN phenotype using two criteria. When defining CIN as aberrations in chromosomes 2p, 3p, 5q, 17p, and 18q (criterion 1) as previously proposed (14), samples No. 17-60 were scored as CIN-positive and inversely correlated with CIMP (p = 0.075). Alternatively, when considering CIN as the presence of significant gains, losses or LOH in any one or more chromosomal regions (criterion 2), the degree of chromosomal aberrations varied in a wide spectrum across all tumors. This is of particular interest since samples scored as “CIN-negative” (e.g. No. 9-16) by criterion 1 were revealed as having low-degree aberrations. Consequently, under the latter criterion that considers CIN as a continuous variable, only samples No. 1-8 were qualified as true “CIN-negative”, and tumors bearing high levels of hypermethylated loci (i.e. “CIMP-positive”) exhibited a significant correlation with low-degree CIN (p = 0.012).
To ensure that the relationship between CIN and CIMP was independent of the method of scoring CIMP, we used the five robust methylation markers and MethyLight assay to identify CIMP-positive as proposed by Weisenberger et al. All experiments were conducted and the 60 tumors were analyzed based on the published protocol (Supplementary Material, Fig S4). As shown in Fig. 3, samples identified as CIMP-positive showed a significant correlation with MSI (p=0.0008, two-tailed Fisher’s Exact test). Furthermore, under criterion 1, we found an inverse relationship between CIMP and CIN (p=0.001, two-tailed Fisher’s Exact test). When CIN was viewed as a gradient distribution of high- to low-degree aberrations (criterion 2), a significant correlation was also found between CIMP and low-degree aberrations (p = 0.013). As shown in Fig. 4A, the relationships between MSI, CIMP, and CIN are depicted in a Venn diagram, which illustrates that CIMP-positive samples generally comprise MSI and low-CIN tumors. We conclude that both quantitative methylation assays consistently identify CIMP-positive groups. The significance of the correlation between CIN and CIMP is independent of the method used for quantitative methylation detection.
Figure 4.

Relationships between CIMP, MSI and CIN. (A) A Venn diagram depicts that the majority of CIMP-positive tumors have MSI and low-degree chromosomal aberrations. The 12 CIMP-positive samples in the light blue circle were determined using MethyLight assay and the five designated methylation markers. The eight samples within the red circle and the 44 samples in the pink circle are tumors with low- and high-degree CIN, respectively. There are 11 MSI samples in the light green circle. Four samples that do not belong to any circle have a near diploid genome, are unmethylated at any of the five markers, and are microsatellite stable. (B) Distribution of promoter methylation status and LOH at 15 tumor suppressor gene loci in the 60 primary colorectal tumors. The gene names and their corresponding chromosome location are indicated on the top of the diagram. Tumor samples are organized and displayed based on the number of methylated loci. CIMP-positive samples (determined using MethyLight assay) were indicated with asterisk. Tumors of CIMP-positive and high-degree CIN features were labeled with arrows. The tumor suppressor gene promoter methylation and LOH status are color coded and indicated.
In the course of studying genome instability in CRC samples, we tested whether a different conclusion on the inverse relationship between CIMP and CIN could be made using selected LOH at loci of the 15 tumor suppressor genes mentioned above. LOH was examined at each gene locus using the Affymetrix 50K Human Mapping array (Fig. 4B). In general, LOH events were found at any of the analyzed tumor suppressor loci in nearly 80% of the tumors analyzed; however, tumors with a high level of methylated loci tended to have fewer LOH events. Interestingly, the majority of CIMP-positive samples (8 out of 12) had low-degree or no LOH. This result is consistent with the above observation that CRCs with high-level methylation have a different type of genetic abnormality.
Discussion
We have employed a recently developed, accurate and quantitative bisulfite/PCR/LDR-/Universal Array approach to test the CIMP in CRCs. Our data are consistent with previous studies that have indicated the CIMP-positive tumors correlate with MSI, BRAF mutation, and are more likely to occur in tumors of the proximal colon. We have also demonstrated that the correlation between CIMP-positive and BRAF V600E mutation is independent of MSI status. A subset of CRCs was assayed using MethyLight and markers of CACNA1G, IGF2, NEUROG1, RUNX3 and SOCS1 which showed the same correlation with clinicopathologic features. All these findings suggest that CIMP-positive tumors are a distinct subgroup of CRCs. We also reported that a subset of CRCs determined using MethyLight and the five designated markers rendered a bimodal CIMP pattern (Supplementary Material, Fig S4), which is contrary to the continuous phenotype measured using p16INK4a, p14ARF, TIMP3, MGMT and RARβ genes. Addressing the extent of methylation distribution is important not only to understand the underlying biology, but also for CIMP classification and data analysis. Some previous studies have implied that the number of MSI tumors and the methylation markers used in a study influenced CIMP distribution (18-19). Since a consistent number of MSI tumors were present in both 161 CRC cohort and the subset of 60 tumors (20-24%), the diverse distribution patterns most likely resulte from the choice of methylation markers in the analysis. Our study did not attempt to re-discover CIMP markers, as several robust ones have already been published and a unified list is essential for future studies. Rather, we sought to emphasize the importance of using quantitative assays for methylation profiling.
In our study, CIMP neither correlated with gender nor KRAS mutations, regardless of the methods used for CIMP scoring. Associations between CIMP and either gender or KRAS mutations are controversial. In a large population based study, Samowitz et al. showed that CIMP correlated with KRAS mutations but not with gender (22). However, recent studies reported that CIMP significantly associated with wild-type KRAS and female gender (18, 19). The discrepancies may result from the use of different methylation markers and/or sampling variation. We favor the latter explanation, as similar results of the absence of correlations were obtained whether the tumor cohort was analyzed by the LDR/Universal Array or the MethyLight assay (Supplementary Material, Fig S4).
Our findings provide additional nuances to a recent study suggesting that CIN and CIMP represent two independent mechanisms of genomic instability in sporadic CRCs (14). First, in our study, promoter methylation status was determined using quantitative methylation assays. These methods have the advantages over a non-quantitative and highly sensitive assay (e.g. Methylation specific PCR) that tends to detect genomic loci with biologically insignificant levels of methylation. Such an approach has often resulted in an over-estimation of CIMP or even failure to identify it. Second, when a tumor’s CIN status was assessed based on the presence of one or more LOH events at eight microsatellite sequences located on chromosomes 2p, 3p, 5q, 17p, and 18q, we confirmed the previous report of an inverse correlation between CIN and CIMP. This observation is independent of the method of CIMP scoring. Nevertheless, since CIN leads to aneuploidy, in which chromosomal regions are either missing or duplicated, aberrations found in any chromosome may be viewed as CIN. Indeed, by employing high throughput assays, such as CGH and SNP array technology, we and others have shown common and broad allelic imbalance events in chromosomes 4p, 4q, 5q, 12q, 14q, 15q, 17p, 18q, and 20p (24, 25, 29), and frequent gains in chromosomes 7p, 7q, 8q, 13q, and 20q (32). These results allow a genome-wide analysis of CIN phenotype and provide an alternative for determination of CIN status in one third of CRCs that had moderate to low level chromosomal aberrations. Third, the degree of aneuploidy in the analyzed CRC samples is spread over a wide spectrum. Thus, a limited LOH loci approach to determine CIN became challenging and will likely identify tumors with the most chromosomal abnormalities, but not those, such as MSI and CIMP-positive tumors, which tend to have low-degree chromosomal aberrations. Since MSI constitutes a good proportion of CIMP-positive samples (>50%), our findings suggest that the reported inverse correlation between CIMP and CIN may reflect the relationship between MSI and CIN (Fig. 4A). It is noteworthy that a subset of CIMP-positive tumors, albeit of small size, has a high degree of chromosomal aberrations. Whether this subset has a different clinical outcome needs to be further investigated. In summary, we conclude that CIMP-positive tumors are not free of chromosomal abnormalities; rather, they have significant low-degree chromosomal aberrations. This tendency of CIMP-positive tumors to have low-degree CIN most likely results from the contribution of their MSI feature. Our results indicate that the stratification of sporadic CRCs based on epigenetic and genetic instabilities is best described using a quantitative assay and a genome-wide approach, respectively.
Supplementary Material
Statement of Clinical Relevance.
This study stratifies a subset of colon cancers – CpG island methylator phenotype (CIMP) that possess multiple hypermethylated genomic loci and correlate with microsatellite instability (MSI) and Braf mutations. The presence of significant low-degree of chromosomal aberrations in these tumors suggests that CIMP may arise from an independent mechanism of tumor progression compared to the majority of sporadic colon cancers. The different clinicopathologic characteristics of this subgroup may be beneficial for future development of cancer intervention therapy (e.g. de-methylating drug treatments) and patient management. Additionally, since some CIMP tumors contain a high-degree of chromosomal instability (CIN), the mechanisms of CIMP and CIN do not appear to be mutually exclusive. Our report of a quantitative and high-resolution study of CIMP and CIN provides a more refined classification of CIMP tumors, including identifying those CIMP-positive/MSI-negative samples with high levels of CIN. The clinical characteristic or prognostic value of the refined CIMP classifications may be further established in a larger tumor set with known outcomes.
Acknowledgments
The authors thank Maneesh Pingle, Richard Shattock, Kathy Granger and Mark Rundell for insightful discussion and technical assistance. We also thank the Gilbert Family Foundation, and the Ludwig Institute for Cancer Research / Conrad N. Hilton Foundation joint Hilton-Ludwig Cancer Metastasis Initiative for their generous funding in part of this work. Statistical analysis (JO) is supported by China NSFC grant 30730057. Francis Barany is an Affiliate of the Ludwig Institute for Cancer Research. Work in the Barany laboratory is sponsored by the National Cancer Institute (P01-CA65930 and RO1-CA81467).
Abbreviations
- CIMP
CpG island methylator phenotype
- MSP
methylation-specific PCR
- LDR
ligase detection reaction
- LOH
loss of heterozygosity
- MSI
microsatellite instability
- CIN
chromosomal instability
- APC
adenomatous polyposis coli
- CDH1
E-cadherin
- TIMP3
tissue inhibitor of metalloproteinase-3
- RARβ
retinoic-acid-receptor beta 2
- DAPK1
death-associated protein kinase 1
- RASSF1
Ras association domain family protein 1A
- MGMT
O6-methylguanine-DNA methyltransferase
- GSTP1
glutathione S-transferase pi
References
- 1.Jones PA, Baylin SB. The fundamental role of epigenetic events in cancer. Nat Rev Genet. 2002;3:415–28. doi: 10.1038/nrg816. [DOI] [PubMed] [Google Scholar]
- 2.Baylin SB, Herman JG. DNA hypermethylation in tumorigenesis: epigenetics joins genetics. Trends Genet. 2000;16:168–74. doi: 10.1016/s0168-9525(99)01971-x. [DOI] [PubMed] [Google Scholar]
- 3.Baylin SB, Ohm JE. Epigenetic gene silencing in cancer - a mechanism for early oncogenic pathway addiction? Nat Rev Cancer. 2006;6:107–16. doi: 10.1038/nrc1799. [DOI] [PubMed] [Google Scholar]
- 4.Gardiner-Garden M, Frommer M. CpG islands in vertebrate genomes. J Mol Biol. 1987;196:261–82. doi: 10.1016/0022-2836(87)90689-9. [DOI] [PubMed] [Google Scholar]
- 5.Feinberg AP, Vogelstein B. Hypomethylation distinguishes genes of some human cancers from their normal counterparts. Nature. 1983;301:89–92. doi: 10.1038/301089a0. [DOI] [PubMed] [Google Scholar]
- 6.Warnecke PM, Bestor TH. Cytosine methylation and human cancer. Curr Opin Oncol. 2000;12:68–73. doi: 10.1097/00001622-200001000-00012. [DOI] [PubMed] [Google Scholar]
- 7.Kops GJ, Weaver BA, Cleveland DW. On the road to cancer: aneuploidy and the mitotic checkpoint. Nat Rev Cancer. 2005;5:773–85. doi: 10.1038/nrc1714. [DOI] [PubMed] [Google Scholar]
- 8.Rajagopalan H, Lengauer C. Aneuploidy and cancer. Nature. 2004;432:338–41. doi: 10.1038/nature03099. [DOI] [PubMed] [Google Scholar]
- 9.Yang Q, Mori I, Shan L, et al. Biallelic inactivation of retinoic acid receptor beta2 gene by epigenetic change in breast cancer. Am J Pathol. 2001;158:299–303. doi: 10.1016/s0002-9440(10)63969-7. [DOI] [PMC free article] [PubMed] [Google Scholar]
- 10.Tokumaru Y, Nomoto S, Jeronimo C, et al. Biallelic inactivation of the RIZ1 gene in human gastric cancer. Oncogene. 2003;22:6954–8. doi: 10.1038/sj.onc.1206403. [DOI] [PubMed] [Google Scholar]
- 11.Li Z, Meng ZH, Chandrasekaran R, et al. Biallelic inactivation of the thyroid hormone receptor beta1 gene in early stage breast cancer. Cancer Res. 2002;62:1939–43. [PubMed] [Google Scholar]
- 12.Rodriguez J, Frigola J, Vendrell E, et al. Chromosomal Instability Correlates with Genome-wide DNA Demethylation in Human Primary Colorectal Cancers. Cancer Res. 2006;66:8462–9468. doi: 10.1158/0008-5472.CAN-06-0293. [DOI] [PubMed] [Google Scholar]
- 13.Toyota M, Ahuja N, Ohe-Toyota M, Herman JG, Baylin SB, Issa JP. CpG island methylator phenotype in colorectal cancer. Proc Natl Acad Sci USA. 1999;96:8681–6. doi: 10.1073/pnas.96.15.8681. [DOI] [PMC free article] [PubMed] [Google Scholar]
- 14.Goel A, Nagasaka T, Arnold CN, et al. The CpG island methylator phenotype and chromosomal instability are inversely correlated in sporadic colorectal cancer. Gastroenterology. 2007;132:127–38. doi: 10.1053/j.gastro.2006.09.018. [DOI] [PubMed] [Google Scholar]
- 15.Eads CA, Danenberg KD, Kawakami K, Saltz LB, Danenberg PV, Laird PW. CpG island hypermethylation in human colorectal tumors is not associated with DNA methyltransferase overexpression. Cancer Res. 1999;59:2302–6. [PubMed] [Google Scholar]
- 16.Hawkins N, Norrie M, Cheong K, et al. CpG island methylation in sporadic colorectal cancers and its relationship to microsatellite instability. Gastroenterology. 2002;122:1376–87. doi: 10.1053/gast.2002.32997. [DOI] [PubMed] [Google Scholar]
- 17.Yamashita K, Dai T, Dai Y, Yamamoto F, Perucho M. Genetics supersedes epigenetics in colon cancer phenotype. Cancer Cell. 2003;4:121–31. doi: 10.1016/s1535-6108(03)00190-9. [DOI] [PubMed] [Google Scholar]
- 18.Ogino S, Cantor M, Kawasaki T, et al. CpG island methylator phenotype (CIMP) of colorectal cancer is best characterised by quantitative DNA methylation analysis and prospective cohort studies. Gut. 2006;55:1000–6. doi: 10.1136/gut.2005.082933. [DOI] [PMC free article] [PubMed] [Google Scholar]
- 19.Weisenberger DJ, Siegmund KD, Campan M, et al. CpG island methylator phenotype underlies sporadic microsatellite instability and is tightly associated with BRAF mutation in colorectal cancer. Nat Genet. 2006;38:787–93. doi: 10.1038/ng1834. [DOI] [PubMed] [Google Scholar]
- 20.Nagasaka T, Sasamoto H, Notohara K, et al. Colorectal cancer with mutation in BRAF, KRAS, and wild-type with respect to both oncogenes showing different patterns of DNA methylation. J Clin Oncol. 2004;22:4584–94. doi: 10.1200/JCO.2004.02.154. [DOI] [PubMed] [Google Scholar]
- 21.Toyota M, Ohe-Toyota M, Ahuja N, Issa JP. Distinct genetic profiles in colorectal tumors with or without the CpG island methylator phenotype. Proc Natl Acad Sci USA. 2000;97:710–5. doi: 10.1073/pnas.97.2.710. [DOI] [PMC free article] [PubMed] [Google Scholar]
- 22.Samowitz WS, Albertsen H, Herrick J, et al. Evaluation of a large, population-based sample supports a CpG island methylator phenotype in colon cancer. Gastroenterology. 2005;129:837–45. doi: 10.1053/j.gastro.2005.06.020. [DOI] [PubMed] [Google Scholar]
- 23.Kambara T, Simms LA, Whitehall VL, et al. BRAF mutation is associated with DNA methylation in serrated polyps and cancers of the colorectum. Gut. 2004;53:1137–44. doi: 10.1136/gut.2003.037671. [DOI] [PMC free article] [PubMed] [Google Scholar]
- 24.Gaasenbeek M, Howarth K, Rowan AJ, et al. Combined array-comparative genomic hybridization and single-nucleotide polymorphism-loss of heterozygosity analysis reveals complex changes and multiple forms of chromosomal instability in colorectal cancers. Cancer Res. 2006;66:3471–9. doi: 10.1158/0008-5472.CAN-05-3285. [DOI] [PubMed] [Google Scholar]
- 25.Lips EH, Dierssen JW, van Eijk R, et al. Reliable high-throughput genotyping and loss-of-heterozygosity detection in formalin-fixed, paraffin-embedded tumors using single nucleotide polymorphism arrays. Cancer Res. 2005;65:10188–91. doi: 10.1158/0008-5472.CAN-05-2486. [DOI] [PubMed] [Google Scholar]
- 26.Cheng YW, Shawber C, Notterman D, Paty P, Barany F. Multiplexed profiling of candidate genes for CpG island methylation status using a flexible PCR/LDR/Universal Array assay. Genome Res. 2006;16:282–9. doi: 10.1101/gr.4181406. [DOI] [PMC free article] [PubMed] [Google Scholar]
- 27.Khanna M, Park P, Zirvi M, et al. Multiplex PCR/LDR for detection of K-ras mutations in primary colon tumors. Oncogene. 1999;18:27–38. doi: 10.1038/sj.onc.1202291. [DOI] [PubMed] [Google Scholar]
- 28.Nash GM, Gimbel M, Shia J, et al. Automated, multiplex assay for high-frequency microsatellite instability in colorectal cancer. J Clin Oncol. 2003;21:3105–12. doi: 10.1200/JCO.2003.11.133. [DOI] [PubMed] [Google Scholar]
- 29.Tsafrir D, Bacolod M, Selvanayagam Z, et al. Relationship of gene expression and chromosomal abnormalities in colorectal cancer. Cancer Res. 2006;66:2129–37. doi: 10.1158/0008-5472.CAN-05-2569. [DOI] [PubMed] [Google Scholar]
- 30.Huang J, Wei W, Zhang J, et al. Whole genome DNA copy number changes identified by high density oligonucleotide arrays. Hum Genomics. 2004;1:287–99. doi: 10.1186/1479-7364-1-4-287. [DOI] [PMC free article] [PubMed] [Google Scholar]
- 31.Samowitz WS, Sweeney C, Herrick J, et al. Poor survival associated with the BRAF V600E mutation in microsatellite-stable colon cancers. Cancer Res. 2005;65:6063–9. doi: 10.1158/0008-5472.CAN-05-0404. [DOI] [PubMed] [Google Scholar]
- 32.Trautmann K, Terdiman JP, French AJ, et al. Chromosomal instability in microsatellite-unstable and stable colon cancer. Clin Cancer Res. 2006;12:6379–85. doi: 10.1158/1078-0432.CCR-06-1248. [DOI] [PubMed] [Google Scholar]
Associated Data
This section collects any data citations, data availability statements, or supplementary materials included in this article.