Abstract
Background: Both common and rare mitochondrial DNA (mtDNA) variants may contribute to genetic susceptibility to some complex human diseases. Understanding of the role of mtDNA variants will provide valuable insights into the etiology of these diseases. However, to date, there have not been any large-scale, genome-wide association studies of complete mtDNA variants and disease risk. One reason for this might be the substantial cost of sequencing the large number of samples required for genetic epidemiology studies. Next-generation sequencing of pooled mtDNA samples will dramatically reduce the cost of such studies and may represent an appealing approach for large-scale genetic epidemiology studies. However, the performance of the different designs of sequencing pooled mtDNA has not been evaluated. Methods: We examined the approach of sequencing pooled mtDNA of multiple individuals for estimating allele frequency using the Illumina genome analyzer (GA) II sequencing system. In this study the pool included mtDNA samples of 20 subjects that had been sequenced previously using Sanger sequencing. Each pool was replicated once to assess variation of the sequencing error between pools. To reduce such variation, barcoding was used for sequencing different pools in the same lane of the flow cell. To evaluate the effect of different pooling strategies pooling was done at both the pre- and post-PCR amplification step. Results: The sequencing error rate was close to that expected based on the Phred score. When only reads with Phred ≥ 20 were considered, the average error rate was about 0.3%. However, there was significant variation of the base-calling errors for different types of bases or at different loci. Using the results of the Sanger sequencing as the standard, the sensitivity of single nucleotide polymorphism detection with post-PCR pooling (about 99%) was higher than that of the pre-PCR pooling (about 82%), while the two approaches had similar specificity (about 99%). Among a total of 298 variants in the sample, the allele frequencies of 293 variants (98%) were correctly estimated with post-PCR pooling, the correlation between the estimated and the true allele frequencies being >0.99, while only 206 allele frequencies (69%) were correctly estimated in the pre-PCR pooling, the correlation being 0.89. Conclusion: Sequencing of mtDNA pooled after PCR amplification is a viable tool for screening mitochondrial variants potentially related to human diseases.
Keywords: next generation sequencing, mitochondria DNA, pooled sequencing, allele frequency, sequencing error
Introduction
Mitochondria play a crucial role in ATP synthesis, heat production, reactive oxygen species (ROS) generation, apoptosis, and several metabolic pathways (Wallace, 2005). The mitochondrial DNA (mtDNA) genome, which is essential for maintaining mitochondrial function, is a closed, double-stranded DNA molecule of 16,569 bp and encodes 13 subunits of the enzyme complexes of the respiratory chain/oxidative phosphorylation (OXPHOS) system, two rRNAs, and 22 tRNAs (DiMauro and Schon, 2003).
Mitochondrial DNA is highly susceptible to mutation (Miyata et al., 1982; Wallace et al., 1987). Rare mtDNA variants result in a variety of syndromes with neurological, muscular, or metabolic manifestations. Indeed, it has been shown that more than 250 mtDNA point mutations and deletions are linked to human diseases, including, as examples, mitochondrial myopathy, lactic acidosis, Kearns–Sayre syndrome (KSS [MIM530000]), and maternally inherited diabetes and deafness syndrome (MIDD [MIM520000]; Taylor and Turnbull, 2005).
Population genetics theory has suggested that common mtDNA variants might have functional roles in human diseases. The substantial regional variation in mtDNA lineages suggested that there is natural selection on mtDNA variants. It has been hypothesized that variants that are selectively adapted to cold climates during human evolution may predispose to energy metabolism diseases (DiMauro and Schon, 2003; Ruiz-Pesini et al., 2004; Wallace, 2005). Based on the “common disease–common variant” (CDCV) hypothesis (Lander, 1996; Chakravarti, 1999; Reich and Lander, 2001), a growing number of studies have investigated associations between sets of selected common mtDNA variants and common diseases, in particular neurodegenerative diseases, such as Alzheimer (MIM104300), Parkinson (MIM 168600), and Huntington (MIM143100) diseases (Schapira, 1999; Beal, 2005), type 2 diabetes (Poulton et al., 1998, 2002; Lowell and Shulman, 2005; Savage et al., 2005), cardiovascular diseases (Castro et al., 2006), and cancers (Canter et al., 2005; Petros et al., 2005; Bai et al., 2007; Covarrubias et al., 2008; Ye et al., 2008). The important alternative hypothesis is that multiple rare variants (including mtDNA variants) are responsible for the heritability of common diseases. Recently, it has been shown that even those signals that have been detected for common variants could come from the effects of rare ones (Dickson et al., 2010). The answer is likely that a combination of both common and rare variants underlie heritability (Bodmer and Bonilla, 2008; Manolio et al., 2009). A subset of carefully selected common mtDNA variants may cover a large proportion of all common mtDNA variants/haplogroups, but is thought to have limited power for detecting rare ones because of the weak linkage disequilibrium between them. As such, studies using a subset of common mtDNA variants may not fully explain the heritability of some mitochondrial diseases that are partially explained by rare mtDNA variants.
To capture all associations, an ideal approach is to directly sequence the mtDNA genome of all the samples in a study (Bodmer and Bonilla, 2008). This is more appealing for mtDNA than nuclear DNA because of the small size of mtDNA, which allows the complete sequence of one individual to be obtained by traditional Sanger sequencing at relatively low cost. However, despite having a less severe multiple testing problem due to the smaller variants in the mtDNA genome, mitochondrial genome association studies require sample sizes comparable to those of nuclear DNA whole-genome association studies because of the haploid nature of mitochondria (McRae et al., 2008). As such, sequencing mtDNA samples of the thousands of samples required for genetic epidemiology studies is expensive and time consuming.
New sequencing technology, so-called next generation or massively parallel sequencing, is now available for fast massive sequencing in a less labor-intensive fashion. At present, three platforms for massively parallel DNA sequencing read production, including the Roche/454 FLX1 (Margulies et al., 2005), the Illumina/Solexa genome analyzer2 (GA; Bentley, 2006), and the Applied Biosystems SOLidTM System3, are widely used. For these platforms, the throughput of a single run is greatly larger than that required for sequencing an individual mitochondrial genome. As such, an appealing approach is to sequence a large number of individuals together in a single sequence run (Shaw et al., 1998), so that the cost and time of sequencing can be dramatically reduced. The idea of detecting associations by using pooled mtDNA sequencing is based on the premise that the allele frequency of a variant can be estimated accurately in cases and controls. The pooling strategy was proposed earlier for high throughput single nucleotide polymorphism (SNP) arrays (Shaw et al., 1998; Ito et al., 2003; Zeng and Lin, 2005), but it was not widely accepted as SNP array technology does not provide accurate estimates of the allele frequencies in the pooled samples. Next-generation sequencing technology, however, might provide more accurate estimates of allele frequencies, as shown by recent studies on nuclear DNA (Druley et al., 2009a; Nejentsev et al., 2009).
In this pilot study, we assessed the accuracy of the estimates of allele frequencies using the Illumina GA II system to sequence pooled mtDNA. Pooling was done both before and after the PCR step to evaluate whether different pooling strategies are applicable for mtDNA. We also investigated the use of barcoding to allow sequencing of different pools in the same flow cell lane to improve the comparability in terms of the sequencing error between different pools, which is critical for identifying association when pools of subjects with different phenotypes are compared.
Materials and Methods
Subjects
Mitochondrial genomes of 20 subjects, whose mtDNA had been sequenced previously using Sanger dideoxy sequencing on an ABI3730XL, were included in this study. These deidentified DNA samples were submitted to the Mitochondrial Diagnostic Laboratory of Molecular and Human Genetics, Baylor College of Medicine, for the diagnosis of mitochondria disorders. To evaluate the performance of the pooled mtDNA sequencing in a range of situations, the 20 subjects were selected to include individuals with low, average, or large numbers of variants. The total distinct SNP variants carried by these 20 subjects was 298. The average number of variants carried by an individual was 34.2, ranging from 11 to 84.
Amplification
Total genomic DNA, which contains mtDNA, was isolated using commercially available kit. MtDNA enrichment was done by long-range PCR. The complete human mitochondrial genome was amplified in two overlapping fragments. Long-Range PCR was performed using the LA PCR Kit Ver. 2.1 (TaKaRa Bio Inc.). The primer pair for amplification of fragment 1 was Mito 1-2 Forward: 5′-ACATAGCACATTACAGTCAAATCCCTTCTCGTCCC-3′ and Mito 1-2 Reverse: 5′-ATTGCTAGGGTGGCGCTTCCAATTAGGT GC-3′, resulting in a 9307-bp product, and the primer pair for amplification of fragment 2 was Mito 3 Forward: 5′-TCATTTTTATTGCCACAACTAACCTCCTCGGACTC-3′ and Mito 3 Reverse: 5′-CGTGATGTCTTATTTAAGGGGAACGTGTG GGCTAT-3′, resulting in a 7,814-bp product.
Pooling
Two pooling strategies were evaluated in this study: first, equimolar amounts of mtDNA were pooled before amplification (pre-PCR); second, equimolar amounts of PCR products were pooled (post-PCR). The concentrations of human DNA sample or fragments 1 and 2 were measured by UV spec. For both pooling designs, a final amount of 500 ng was used as starting material for Illumina GA libraries.
Illumina genome analyzer sequencing
Parallel DNA sequencing was performed using the Illumina GA II Sequencing System in the Genomics Shared Facility at the Albert Einstein College of Medicine, according to the manufacturer’s protocol. Pooled, amplified mtDNA samples were sheared and the resulting fragments were ligated to modified adapters that included 8-bp indexing tags. Following this barcoding step, the samples were multiplexed at four samples per lane in the Illumina GA flow cell.
Read-lengths of up to 75 bp were obtained. The sequence reads were aligned to the revised Cambridge reference sequence (rCRS; GenBank accession NC_012920). The reads were mapped using the BWA software package4 (Li and Durbin, 2009). Once the reads were aligned, we counted the number of bases appearing at each mitochondrial location using the pileup feature of the SAMtools suite5 (Li et al., 2009).
SNP detection and allele frequency estimation
For SNP detection and allele frequency estimation, we assumed that, given the allele frequency τi and the number of individuals in a pool n, the number of variants (mi) carried by subjects in a pool has a distribution of Pr (mi|τi) = Binomial (n,τi). In addition, given the total number of reads Ri at this position, mi and n, we assumed that the distribution of the number of reads calling a variant (xi) is Pr (xi|M = mi) = Binomial (Ri, mi/n). Hence, xi is drawn from a distribution
Based on these assumptions, we defined a threshold (T) for the number of reads reporting the variant that needed to be exceeded to be able to call a variant. This threshold was defined by the upper α quantile of the reads for a given base-calling error rate, i.e., where e is the defined error rate. For such a threshold, the false positive rate of calling a variant is expected to be less than α under the given base-calling error rate.
We estimated the allele frequency by the following iterative procedure (Wang et al., 2010)
-
(1)
Select the initial value of τi;
-
(2)
Calculate the weight for mi = 0, …, n by
-
(3)
Estimate
(4) Repeat (2) and (3) until convergence.
Results
Depth of coverage
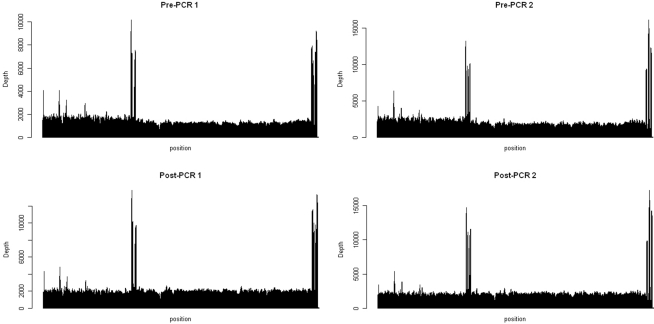
Pooled mtDNA samples were sequenced in the same lane using the barcoding protocol, producing 2.34 and 2.86, and 3.48 and 3.12 Mb for two replicates of the pre-PCR pools and the two replicates of the post-PCR pools, respectively, that were mapped to the human mitochondrial genome with BWA software package (75 bp, single-end reads; Table 1). Of these, 86, 86, 96, and 95% were mapped to the 16.6-Kb mitochondrial genome. For each pooled sample, each nucleotide position was covered reasonably well. Except for two regions (8,753–9,068 bp and 16,331–16,566), the fold coverage was quite consistent across the mitochondrial genome (Figure 1). The reason for the increased fold coverage in these two regions was the overlap of fragment 1 and fragment 2 of PCR.
Table 1.
Depth of coverage for targeted regions.
| Sequence | No of reads successfully mapped | No of reads total | Alignment % | Median fold coverage |
|---|---|---|---|---|
| Pre-PCR 1 | 2,340,743 | 2,720,994 | 86 | 11,293 |
| Pre-PCR 2 | 2,864,728 | 3,317,528 | 86 | 14,032 |
| Post-PCR 1 | 3,479,461 | 3,628,774 | 96 | 16,737 |
| Post-PCR 2 | 3,116,138 | 3,263,443 | 95 | 14,885 |
Figure 1.
Coverage maps for the pooled mtDNA before amplification (Top) and the pooled fragment 1 and 2 (Bottom). The x axis represents the position of nucleotide on the mitochondrial genome (16,568 kb) and the y axis stands for the fold coverage for each nucleotide position.
Sequencing error rates
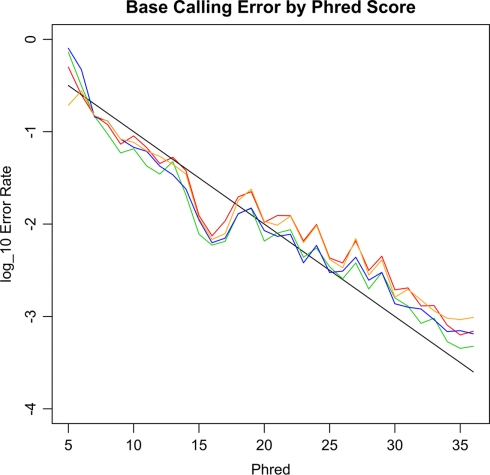
The level of base-calling error is an important parameter for pooled mtDNA sequencing, as high levels of base-calling error could lead to either inflated type I errors or inflated type II errors of association. To determine the accuracy of the sequencing system, we analyzed the base-calling error rates at non-variant bases for our 20 samples. Figure 2 shows the empirical base-calling error rates as a function of Phred score. The empirical base-calling rates were close to the theoretical ones based on Phred score, i.e., 10(−phred/10). However, sequencing error was slightly more common at A and T bases than at C and G bases.
Figure 2.
The empirical base-calling error rates against Phred score. The black line is the theoretical error rate based on the Phred score, i.e., 10(−Phred/10). The red, orange and blue and green lines are for A, C, G, T bases, respectively. The A and T bases have slightly higher error rates than those of C and G.
To achieve a balance between accuracy of the reads while retaining a sufficient number of reads to enable allele frequencies to be estimated precisely, in our subsequent analyses we restricted attention to reads with Phred score ≥ 20, which is approximately equivalent to a base-calling error of ≤ 1/100. As a result of this strategy, there were 160,879,862 and 199,396,697 mapped read positions for the two pre-PCR pools and 213,282,359 and 238,732,352 mapped read positions for two post-PCR pools, respectively. For both pre-PCR and post-PCR sequencing, the accuracy was excellent, with an average base-calling error rate of around 0.3% (0.28 and 0.31% for pre- and post-PCR sequencing, respectively). However, there was high variation in the levels of the sequencing error. In particular, base A was called as G (or G was called as A) and the base C was called as T (or T was called as C) more frequently than other miss-callings (Table 2).
Table 2.
Average accuracy and error rate of the base-calling for the pre-PCR pooled mtDNA samples and the post-PCR pooled mtDNA samples.
| True nucleotide | Reported nucleotide (1/1,000) | |||
|---|---|---|---|---|
| A | C | G | T | |
| A | 996.3 (996.1) | 0.13 (0.14) | 3.4 (3.6) | 0.08 (0.11) |
| C | 0.37 (0.40) | 997.9 (997.7) | 0.07 (0.07) | 1.4 (1.6) |
| G | 2.5 (3.2) | 0.14 (0.15) | 995.0 (996.4) | 0.31 (0.31) |
| T | 0.11 (0.13) | 2.7 (3.2) | 0.11 (0.11) | 997.0 (996.5) |
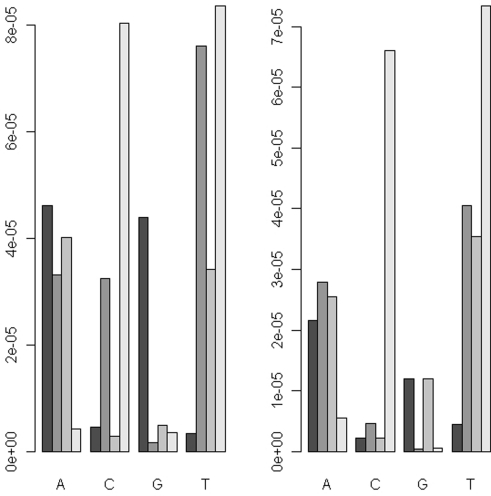
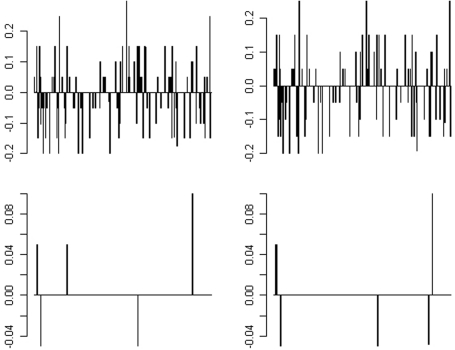
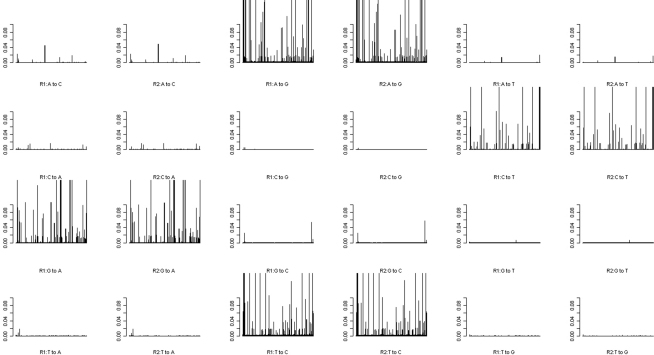
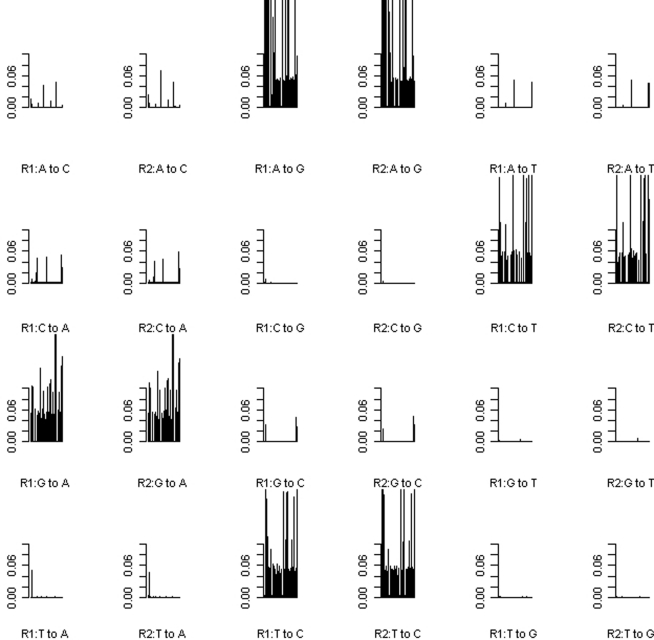
Uneven levels of base-calling error across different pools could lead to spurious differences between the allele frequencies of cases and controls. Therefore we explored the use of barcoding to simultaneously sequence different pools in the same flow cell lane in order to reduce the variation of levels of the base-calling error. The absolute differences (|Δ|) in the base-calling error rates between two replicates of either the pre- or post-PCR pools were very small (|Δ| < 1/1,000; Figure 3). We further examined the position-specific base-calling error rates between different pools (Figures A1 and A2 in Appendix). This showed relatively high variation in the levels of base-calling error across the mitochondrial genome. In some positions, the false error rate was as high as 0.1. However, the patterns of the base-calling error at different positions were quite similar for the two replicates of either pre- or post-PCR poolings.
Figure 3.
The absolute differences of the base-calling rates between two replicates (|Δ|) for the pooled DNA before amplification (left panel) and the pooled PCR products (right panel).
The sensitivity and specificity of SNP detection
To determine the sensitivity and specificity of SNP detection, we sequenced the mtDNA genome of the pooled mtDNA of 20 subjects with 298 known SNPs identified previously by Sanger sequencing. The allele frequencies in this sample ranged from 0.05 to 0.95. Among them, the variant allele for 231 of the SNPs (77.5%) was carried by only one individual in each case, which leads to an allele frequency of 0.05 in the sample. Because of high variation in the levels of the base-calling error between different loci, we considered a threshold to call a variant at a base-calling error rate of α = 1%, which was higher than the average error rate, to reduce false SNP detection. As a result, the average sensitivity was 81.5% and the specificity was 99.0% for the pre-PCR pooling, while the post-PCR pools had a much higher sensitivity (99.0%) and a similar specificity (98.9%).
The allele frequencies
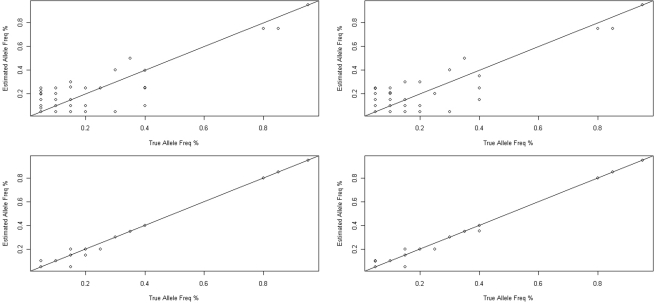
The allele frequencies estimated by both pre- and post-PCR pooling correlated strongly with the allele frequencies measured through individual Sanger sequencing (Figure 4). Pre-PCR pooling had correlation coefficient (r) of 0.885 (95% CI: 0.857–0.907) and 0.888 (95% CI: 0.861–0.910) for the two replicates, respectively, while the two post-PCR pools had even higher correlation coefficients (r) of 0.9982 (95% CI: 0.9977–0.9986) and 0.9984 (95% CI: 0.9980–0.9987), respectively. Moreover, the allele frequency estimates were quite consistent between the two replicates of both the pre-PCR pooling (0.9974; 95% CI 0.9968–0.9980) and the post-PCR pooling (0.9994; 95% CI 0.9993–0.9995).
Figure 4.
Accuracy of allele frequencies estimated from the pre- (upper) and post-PCR pooling (below). The allele frequency as determined by sequencing is plotted against the actual allele frequencies as determined by individual Sanger sequencing for 298 SNPs in our dataset.
The difference between the estimated allele frequency and the true allele frequency (based on the Sanger sequencing results) was also determined. The distribution is shown in Figure 5. For pre-PCR pooling, the allele frequencies of 206 of the 298 variants (69%) were correctly estimated; the bias for the remaining variants ranged from 0.05 to 0.25. For post-PCR pooling, the estimation of the allele frequency was more impressive – the allele frequencies of 292 or 293 of 298 variants (98%) were correctly estimated for the two replicates, respectively; the absolute bias of the remaining variant was 0.05, except for one variant with a bias of 0.1.
Figure 5.
Distribution of the difference between the estimated allele frequencies from pooled mtDNA sequencing and true allele frequency for 298 SNPs in the sample. The two pre-PCR pools are shown in the upper row and the two post-PCR pools are shown in the lower row in each panel.
Discussion
Both common and rare mtDNA variants may contribute to genetic susceptibility to human diseases. A better understanding of the role of mtDNA variants will provide valuable insights into the etiology of these diseases. Because of the shorter length of the mtDNA genome compared to that of the nuclear DNA genome and the availability of new sequencing technology, it is now feasible to interrogate the association of any mtDNA variant with human disease. However, to our knowledge, there have not been any large-scale, genome-wide association studies comprehensively searching for mtDNA variants related to human disease. One major reason, among others, is that the cost of sequencing a large number subjects is still prohibitive. However, because of the massive throughput achievable with new next-generation sequencing technology, such a study may be conducted in a more timely and cost-effective manner by pooling mtDNA of multiple individuals. As such, the use of pooled sequencing is particularly attractive in a two-stage design, in which sequencing is used for identifying a few promising variants that are further validated in an independent sample at the second stage. In this pilot study, we examined the validity of the pooling approach by pooling the mtDNA of 20 subjects and reporting the accuracy and precision of the estimate of the allele frequency of mtDNA SNPs.
In the current study pooling was done at either the pre- or post-PCR amplification step to evaluate the effect of different pooling strategies. The results indicated that the sensitivity of SNP detection with pre-PCR sequencing was significantly lower than that with post-PCR sequencing, while both pooling strategies yielded very high specificity. Moreover, the estimate of allele frequency with pre-PCR sequencing was less accurate than that with post-PCR sequencing. Such differences between pre- and post-PCR sequencing were more significant than those reported in previous studies on nuclear DNA (Lavebratt et al., 2004; Ingman and Gyllensten, 2009). Because pre-PCR and post-PCR sequencing had similar levels of base-calling error, the poorer performance of pre-PCR sequencing was most likely due to variation in the copy numbers of mtDNA molecules among individuals, leading to non-equimolar amounts of mtDNA being pooled. For sequencing mtDNA pools representing a large number of individuals, pre-PCR pooling has the advantage of efficiency in terms of time and cost. However, because it is critical to accurately quantify DNA for SNP detection and allele frequency estimation, pre-PCR pooling of mtDNA may not be as good a strategy for detecting associations as it is for nuclear DNA. As an alternative, one can adjust the amount of pre-PCR mtDNA based on the mtDNA copy number relative to nuclear DNA (Miller et al., 2003). However, estimating mtDNA copy number relies on an additional PCR procedure.
In sequencing an individual genome, base-calling error, which is usually less than 1%, is less of a concern because one easily distinguishes a base-calling error from a true variant with a sufficiently large coverage at the base, as the latter is expected to have a probability of 50% if the locus is heterozygous. However, for the pools of a large number of individuals, the base-calling error rate is likely to be close to, or even higher than, the allele frequency. As such it could be difficult to distinguish a true rare variant from a base-calling error. Our results showed that the empirical base-calling error rates were close to those expected based on Phred score, so one may use only those reads with high Phred score to reduce the negative effects of the base-calling errors. However, there was still significant variation for different types of bases and between various mtDNA locations. In particular, sequencing errors at some locations of mtDNA were present at a much higher frequency than the average error rate of 0.3%. This was not a major problem in the current study that showed both excellent sensitivity and specificity (99%) and accuracy of the estimate of the allele frequency (the correlation between the estimated and the true allele frequencies was >99%) in the post-PCR pooling. The robustness of the current study to relatively high variation in the sequencing error may due to the fact that there were high allele frequencies (≥5%) in the pool because of the small pool size (n = 20). As a result, it was possible to tolerate to a large extent the variation in sequencing error rate. However, sequencing errors could lead to more severe consequences for pools with a larger number of individuals. In such cases, sequencing of pools may serve as a screening tool and the promising loci may be further validated by individual genotyping. In this study, we only consider estimating allele frequencies of homoplasmic mtDNA variants. Recent study showed that next-generation sequencing has a good performance in detecting homoplasmy variants (Zaragoza et al., 2010). However, the estimated allele frequency from the pooled mtDNA sequencing is indeed an estimate of the average heteroplasmic level of samples.
Detection of a disease association using pooled mtDNA is based on comparison of the estimated allele frequencies of cases and controls. High levels of sequencing error could result in either overestimation or underestimation of the allele frequency. Uneven sequencing error levels in cases and controls could lead to false discovery of an association. It has been shown that variation in sequencing errors between different sequencing runs are not negligible (Druley et al., 2009b). To remove such variation, we explored the approach of sequencing different pools in the same lane of a flow cell using the barcoding procedure. We found, for replicative pools sequenced in the same lane, the patterns of the base-calling errors of different mtDNA loci were very consistent, suggesting that this may be a good strategy to reduce false positive associations due to uneven levels of sequencing error between cases and controls. However, high levels of sequencing error can still lead to loss of power, in particular for rare variants. For a rare variant, the reference allele is much more common than the rare variant allele, so false positive reads that occur at the reference base are likely to occur much more often than false negative reads that occur at the variant base, leading to an over-estimated allele frequency in both cases and controls, with consequent reduction in the associated signal-to-noise ratio. However, we have shown previously that statistical power can be improved using a statistic that can take the levels of sequencing error into account (Wang et al., 2010).
In brief, this pilot study indicates that the use of next-generation sequencing for pooled mtDNA can accurately estimate allele frequency and hence is a viable tool for screening mitochondrial variants associated with human diseases.
Conflict of Interest Statement
The authors declare that the research was conducted in the absence of any commercial or financial relationships that could be construed as a potential conflict of interest.
Acknowledgments
Tao Wang was supported in part by the CTSA Grant UL1 RR025750 and KL2 RR025749 and TL1 RR025748 from the National Center for Research Resources (NCRR), a component of the National Institutes of Health (NIH) and NIH roadmap for Medical Research, and P60 DK020541.
Appendix
Figure A1.
Position-specific base-calling error rates for Pre-PCR.
Figure A2.
Position-specific base-calling error rates for Post-PCR.
Footnotes
References
- Bai R. K., Leal S. M., Covarrubias D., Liu A., Wong L. J. (2007). Mitochondrial genetic background modifies breast cancer risk. Cancer Res. 67, 4687–4694 10.1158/0008-5472.CAN-06-3554 [DOI] [PubMed] [Google Scholar]
- Beal M. F. (2005). Mitochondria take center stage in aging and neurodegeneration. Ann. Neurol. 58, 495–505 10.1002/ana.20624 [DOI] [PubMed] [Google Scholar]
- Bentley D. R. (2006). Whole-genome re-sequencing. Curr. Opin. Genet. Dev. 16, 545–552 10.1016/j.gde.2006.10.009 [DOI] [PubMed] [Google Scholar]
- Bodmer W., Bonilla C. (2008). Common and rare variants in multifactorial susceptibility to common diseases. Nat. Genet. 40, 695–701 10.1038/ng.f.136 [DOI] [PMC free article] [PubMed] [Google Scholar]
- Canter J. A., Kallianpur A. R., Parl F. F., Millikan R. C. (2005). Mitochondrial DNA G10398A polymorphism and invasive breast cancer in African-American women. Cancer Res. 65, 8028–8033 [DOI] [PubMed] [Google Scholar]
- Castro M. G., Huerta C., Reguero J. R., Soto M. I., Doménech E., Alvarez V., Gómez-Zaera M., Nunes V., González P., Corao A., Coto E. (2006). Mitochondrial DNA haplogroups in Spanish patients with hypertrophic cardiomyopathy. Int. J. Cardiol. 112, 202–206 10.1016/j.ijcard.2005.09.008 [DOI] [PubMed] [Google Scholar]
- Chakravarti A. (1999). Population genetics – making sense out of sequence. Nat. Genet. 21(1 Suppl.), 56–60 10.1038/4482 [DOI] [PubMed] [Google Scholar]
- Covarrubias D., Bai R. K., Wong L. J., Leal S. M. (2008). Mitochondrial DNA variant interactions modify breast cancer risk. J. Hum. Genet. 53, 924–928 10.1007/s10038-008-0331-x [DOI] [PMC free article] [PubMed] [Google Scholar]
- Dickson S. P., Wang K., Krantz I., Hakonarson H., Goldstein D. B. (2010). Rare variants create synthetic genome-wide associations. PLoS Biol. 8, e1000294. 10.1371/journal.pbio.1000294 [DOI] [PMC free article] [PubMed] [Google Scholar]
- DiMauro S., Schon E. A. (2003). Mitochondrial respiratory-chain diseases. N. Engl. J. Med. 348, 2656–2668 10.1056/NEJMra022567 [DOI] [PubMed] [Google Scholar]
- Druley T. E., Vallania F. L. M., Wegner D. J., Varley K. E., Knowles O. L., Bonds J. A., Robison S. W., Doniger S. W., Hamvas A., Cole F. S., Fay J. C., Mitra R. D. (2009a). Quantification of rare allelic variants from pooled genomic DNA. Nat. Methods 6, 263–265 10.1038/nmeth.1307 [DOI] [PMC free article] [PubMed] [Google Scholar]
- Druley T. E., Vallania F. L., Wegner D. J., Varley K. E., Knowles O. L., Bonds J. A., Robison S. W., Doniger S. W., Hamvas A., Cole F. S., Fay J. C., Mitra R. D. (2009b). Quantification of rare allelic variants from pooled genomic DNA. Nat. Methods 6, 263–265 10.1038/nmeth.1307 [DOI] [PMC free article] [PubMed] [Google Scholar]
- Ingman M., Gyllensten U. (2009). SNP frequency estimation using massively parallel sequencing of pooled DNA. Eur. J. Hum. Genet. 17, 383–386 10.1038/ejhg.2008.182 [DOI] [PMC free article] [PubMed] [Google Scholar]
- Ito T., Chiku S., Inoue E., Tomita M., Morisaki T., Morisaki H., Kamatani N. (2003). Estimation of haplotype frequencies, linkage-disequilibrium measures, and combination of haplotype copies in each pool by use of pooled DNA data. Am. J. Hum. Genet. 72, 384–398 10.1086/346116 [DOI] [PMC free article] [PubMed] [Google Scholar]
- Lander H. M. (1996). Cellular activation mediated by nitric oxide. Methods 10, 15–20 10.1006/meth.1996.0073 [DOI] [PubMed] [Google Scholar]
- Lavebratt C., Sengul S., Jansson M., Schalling M. (2004). Pyrosequencing-based SNP allele frequency estimation in DNA pools. Hum. Mutat. 23, 92–97 10.1002/humu.10292 [DOI] [PubMed] [Google Scholar]
- Li H., Durbin R. (2009). Fast and accurate short read alignment with Burrows-Wheeler transform. Bioinformatics 25, 1754–1760 10.1093/bioinformatics/btp100 [DOI] [PMC free article] [PubMed] [Google Scholar]
- Li H., Handsaker B., Wysoker A., Fennell T., Ruan J., Homer N., Marth G., Abecasis G., Durbin R., 1000 Genome Project Data Processing Subgroup (2009). The sequence alignment/map format and SAMtools. Bioinformatics 25, 2078–2079 10.1093/bioinformatics/btp100 [DOI] [PMC free article] [PubMed] [Google Scholar]
- Lowell B. B., Shulman G. I. (2005). Mitochondrial dysfunction and type 2 diabetes. Science 307, 384–387 10.1126/science.1104343 [DOI] [PubMed] [Google Scholar]
- Manolio T. A., Collins F. S., Cox N. J., Goldstein D. B., Hindorff L. A., Hunter D. J., McCarthy M. I., Ramos E. M., Cardon L. R., Chakravarti A., Cho J. H., Guttmacher A. E., Kong A., Kruglyak L., Mardis E., Rotimi C. N., Slatkin M., Valle D., Whittemore A. S., Boehnke M., Clark A. G., Eichler E. E., Gibson G., Haines J. L., Mackay T. F., McCarroll S. A., Visscher P. M. (2009). Finding the missing heritability of complex diseases. Nature 461, 747–753 10.1038/nature08494 [DOI] [PMC free article] [PubMed] [Google Scholar]
- Margulies E. H., Vinson J. P., Miller W., Jaffe D. B., Lindblad-Toh K., Chang J. L., Green E. D., Lander E. S., Mullikin J. C., Clamp M. (2005). An initial strategy for the systematic identification of functional elements in the human genome by low-redundancy comparative sequencing. Proc. Natl. Acad. Sci. U.S.A. 102, 4795–4800 10.1073/pnas.0408539102 [DOI] [PMC free article] [PubMed] [Google Scholar]
- McRae A. F., Byrne E. M., Zhao Z. Z., Montgomery G. W., Visscher P. M. (2008). Power and SNP tagging in whole mitochondrial genome association studies. Genome Res. 18, 911–917 10.1101/gr.074872.107 [DOI] [PMC free article] [PubMed] [Google Scholar]
- Miller F. J., Rosenfeldt F. L., Zhang C., Linnane A. W., Nagley P. (2003). Precise determination of mitochondrial DNA copy number in human skeletal and cardiac muscle by a PCR-based assay: lack of change of copy number with age. Nucleic Acids Res. 31, e61. 10.1093/nar/gng060 [DOI] [PMC free article] [PubMed] [Google Scholar]
- Miyata T., Hayashida H., Kikuno R., Hasegawa M., Kobayashi M., Koike K. (1982). Molecular clock of silent substitution: at least six-fold preponderance of silent changes in mitochondrial genes over those in nuclear genes. J. Mol. Evol. 19, 28–35 10.1007/BF02100221 [DOI] [PubMed] [Google Scholar]
- Nejentsev S., Walker N., Riches D., Egholm M., Todd J. A. (2009). Rare variants of IFIH1, a gene implicated in antiviral responses, protect against type 1 diabetes. Science 324, 387–389 10.1126/science.1167728 [DOI] [PMC free article] [PubMed] [Google Scholar]
- Petros J. A., Baumann A. K., Ruiz-Pesini E., Amin M. B., Sun C. Q., Hall J., Lim S., Issa M. M., Flanders W. D., Hosseini S. H., Marshall F. F., Wallace D. C. (2005). mtDNA mutations increase tumorigenicity in prostate cancer. Proc. Natl. Acad. Sci. U.S.A. 102, 719–724 10.1073/pnas.0408894102 [DOI] [PMC free article] [PubMed] [Google Scholar]
- Poulton J., Bednarz A. L., Scott-Brown M., Thompson C., Macaulay V. A., Simmons D. (2002). The presence of a common mitochondrial DNA variant is associated with fasting insulin levels in Europeans in Auckland. Diabet. Med. 19, 969–971 10.1046/j.0742-3071.2002.00836.x [DOI] [PubMed] [Google Scholar]
- Poulton J., Brown M. S., Cooper A., Marchington D. R., Phillips D. I. (1998). A common mitochondrial DNA variant is associated with insulin resistance in adult life. Diabetologia 41, 54–58 10.1007/s001250050866 [DOI] [PubMed] [Google Scholar]
- Reich D. E., Lander E. S. (2001). On the allelic spectrum of human disease. Trends Genet. 17, 502–510 10.1016/S0168-9525(01)02410-6 [DOI] [PubMed] [Google Scholar]
- Ruiz-Pesini E., Mishmar D., Brandon M., Procaccio V., Wallace D. C. (2004). Effects of purifying and adaptive selection on regional variation in human mtDNA. Science 303, 223–226 10.1126/science.1088434 [DOI] [PubMed] [Google Scholar]
- Savage D. B., Petersen K. F., Shulman G. I. (2005). Mechanisms of insulin resistance in humans and possible links with inflammation. Hypertension 45, 828–833 10.1161/01.HYP.0000163475.04421.e4 [DOI] [PubMed] [Google Scholar]
- Schapira A. H. (1999). Mitochondrial involvement in Parkinson’s disease, Huntington’s disease, hereditary spastic paraplegia and Friedreich’s ataxia. Biochim. Biophys. Acta 1410, 159–170 10.1016/S0005-2728(98)00164-9 [DOI] [PubMed] [Google Scholar]
- Shaw S. H., Carrasquillo M. M., Kashuk C., Puffenberger E. G., Chakravarti A. (1998). Allele frequency distributions in pooled DNA samples: applications to mapping complex disease genes. Genome Res. 8, 111–123 [DOI] [PubMed] [Google Scholar]
- Taylor R. W., Turnbull D. M. (2005). Mitochondrial DNA mutations in human disease. Nat. Rev. Genet. 6, 389–402 10.1038/nrn1668 [DOI] [PMC free article] [PubMed] [Google Scholar]
- Wallace D. C. (2005). A mitochondrial paradigm of metabolic and degenerative diseases, aging, and cancer: a dawn for evolutionary medicine. Annu. Rev. Genet. 39, 359–407 10.1146/annurev.genet.39.110304.095751 [DOI] [PMC free article] [PubMed] [Google Scholar]
- Wallace D. C., Ye J. H., Neckelmann S. N., Singh G., Webster K. A., Greenberg B. D. (1987). Sequence analysis of cDNAs for the human and bovine ATP synthase beta subunit: mitochondrial DNA genes sustain seventeen times more mutations. Curr. Genet. 12, 81–90 10.1007/BF00434661 [DOI] [PubMed] [Google Scholar]
- Wang T., Lin C. Y., Rohan T. E., Ye K. (2010). Resequencing of pooled DNA for detecting disease associations with rare variants. Genet. Epidemiol. 34, 492–501 10.1002/gepi.20502 [DOI] [PMC free article] [PubMed] [Google Scholar]
- Ye C., Gao Y. T., Wen W., Breyer J. P., Shu X. O., Smith J. R., Zheng W., Cai Q. (2008). Association of mitochondrial DNA displacement loop (CA)n dinucleotide repeat polymorphism with breast cancer risk and survival among Chinese women. Cancer Epidemiol. Biomarkers Prev. 17, 2117–2122 10.1158/1055-9965.EPI-07-2798 [DOI] [PMC free article] [PubMed] [Google Scholar]
- Zaragoza M. V., Fass J., Diegoli M., Lin D., Arbustini E. (2010). Mitochondrial DNA variant discovery and evaluation in human cardiomyopathies through next-generation sequencing. PLoS ONE 5, e12295. 10.1371/journal.pone.0012295 [DOI] [PMC free article] [PubMed] [Google Scholar]
- Zeng D., Lin D. Y. (2005). Estimating haplotype-disease associations with pooled genotype data. Genet. Epidemiol. 28, 70–82 10.1002/gepi.20040 [DOI] [PubMed] [Google Scholar]


