

SYNOPSIS
Objectives
Most animal bites in the United States are due to dogs, with approximately 4.7 million reports per year. Surveillance for dog and other animal bites requires a substantial investment of time and resources, and underreporting is common. We described the use and findings of electronic hospital emergency department (ED) chief complaint data to characterize patients and summarize trends in people treated for dog and other animal bites in New York City (NYC) EDs between 2003 and 2006.
Methods
Retrospective data were obtained from the syndromic surveillance system at the NYC Department of Health and Mental Hygiene. We used a statistical program to identify chief complaint free-text fields as one of four categories of animal bites. We evaluated descriptive statistics and univariate associations on the available demographic data. The findings were also compared with data collected through the existing passive reporting animal bite surveillance system.
Results
During the study period, more than 6,000 animal bite patient visits were recorded per year. The proportion of visits for animal bites did not appear to change over time. Dog bites accounted for more than 70% and cat bites accounted for 13% of animal bite patient visits. Demographic characteristics of patients were similar to those identified in NYC's passive surveillance system.
Conclusions
Our findings suggest that the use of ED data offers a simple, less resource-intensive, and sustainable way of conducting animal bite surveillance and a novel use of syndromic surveillance data. However, it cannot replace traditional surveillance used to manage individual patients for potential rabies exposures.
Animal bites are of public health importance for myriad health and economic reasons. Scars, disfigurement, disability, infection, and even death are potential outcomes of animal bites.1 Infections from animal bites occur in 3% to 18% of dog bites, 28% to 80% of cat bites,2 and approximately 2% of rodent bites.3,4 Animal bites also contribute to rising health-care costs in the United States. The Insurance Information Institute estimates that health-care costs for dog bites alone exceed $300 million in claims annually.5 This estimate covers only dog bites and only when a claim has been filed with an insurance company, suggesting a vast underestimation of the true financial burden.
As ownership of dog, cats, and exotic animals grows in the U.S., so does the risk for animal bites and associated trauma and illness.6–9 Most animal bites occur in a familiar setting or by an owned animal known to the patient.10 Stray and wild animals also pose a threat in rural and urban environments. Of all animal bites, the largest burden is from dogs. Dog bites account for 85% of all animal bites receiving medical attention. The Centers for Disease Control and Prevention (CDC) estimates that 4.7 million dog bites occur in the U.S. annually,11 for which more than 333,000 dog bite victims visit an emergency department (ED).12–14
Animal bite surveillance is not conducted by all local and state health departments. Jurisdictions that do have surveillance programs often rely on provider reporting and may only capture dog bites.12,13,15,16 Unfortunately, like many diseases and conditions that are reportable to state and local health departments, animal bites are likely vastly underreported. A study conducted in a large urban city estimated that only 36% of dog bites are reported by providers or law enforcement.17
A more comprehensive surveillance system is necessary to collect accurate data to better assess the burden of animal bites and target outreach and education. The objective of the New York City (NYC) Department of Health and Mental Hygiene (DOHMH) study was to evaluate a novel method for conducting animal bite surveillance using data collected through NYC's ED syndromic surveillance system. This novel surveillance system captures patient data for those presenting to an ED who report a chief complaint of an animal bite. Data from almost every ED in NYC are collected daily through automated electronic transmission as part of NYC's ED syndromic surveillance system.
Syndromic surveillance refers to methods designed to monitor and detect health events, both spatially and temporally, using predefined syndromes. A variety of syndromic surveillance systems are being used at local and state health departments, including the one at the NYC DOHMH. The NYC DOHMH began its ED syndromic surveillance system in November 2001 in response to bioterrorism preparedness funding provided by the federal government.18 By September 2007, when this study was conducted, 49 EDs were transmitting data to the NYC DOHMH, capturing almost 90% of all emergency room visits. As syndromic surveillance has evolved, the NYC DOHMH has encouraged the dual use of these data for purposes other than the detection of a potential bioterrorist attack.19 Data have been used to monitor infectious disease trends or outbreaks; capture the prevalence or incidence of a disease before and after a public health intervention; and evaluate the epidemiology of chronic diseases, environmental diseases, injuries, syndromes, and other health events. In this article, we illustrate one such novel application of syndromic surveillance data to describe citywide annual animal bite visits.
METHODS
We used retrospective data from archived master files of ED surveillance data collected by the NYC DOHMH from January 1, 2003, through December 31, 2006. Seven days a week, data files from each of the participating EDs are transmitted electronically to the NYC DOHMH.18 Each data file contains individual patient records with non-identifying patient information including age in years, sex, home ZIP code, date and time of ED visit, and the patient's chief complaint as a free-text field. Inclusion criteria for this investigation included any patient record that had both the word “bite” and a recognizable mammalian animal or the word “animal” in the chief complaint field. A program algorithm using SAS® version 9.120 scanned the chief complaint field to identify the word “bite” and then scanned the field again for one of four animal categories: dog, cat, rat and mouse, or other mammal (e.g., raccoon, squirrel, opossum, bat, monkey, horse, ferret, hamster, rabbit, and guinea pig). Records for which the animal type was not specified were included in the “other” animal bite category.
The total number of annual ED visits for all reasons during the four-year study period increased with each successive year due to the inclusion of additional EDs (Table 1); therefore, we used the proportion of visits due to animal bites out of total ED visits when evaluating trends and comparing data from ED surveillance vs. passive animal bite surveillance. We conducted descriptive analyses of available variables as well as an evaluation of the normal distribution of any continuous variables. We calculated univariate associations using a Chi-square test for categorical variables and a non-parametric rank test for continuous variables. Values of p<0.05 were considered significant.
Table 1.
Summary of surveillance system and study population for animal bites, New York City, 2003–2006a

aThe number of EDs participating in syndromic surveillance fluctuated during the study period. On average, there were 44 EDs participating in 2003, 47 in 2004, and 48 in both 2005 and 2006.
bOther animals include raccoons, squirrels, opossums, bats, monkeys, horses, ferrets, hamsters, rabbits, guinea pigs, and animals that were not specified.
ED = emergency department
RESULTS
During the four-year study period, more than 9,000 patients visited an NYC ED each day, totaling more than 12 million visits and averaging 3,137,450 records each year. Animal bites accounted for 24,343 patient visits during the study period, for a mean of 6,085 visits each year or 17 visits per day. While the total number of ED visits increased by 20% and the number of animal bites rose by 16% (5,424 to 6,281) from 2003 to 2006, this trend corresponded to the addition of new EDs to the syndromic surveillance system, as the proportion of visits due to animal bites remained consistent during the four years (Table 1).
During the study period, the mean proportion of ED visits due to animal bites was 0.19%. Seasonal variations were seen between winter months (0.14%) and summer months (0.28%). Dog bite visits (n=17,891) accounted for 73.5% (range: 71.3%–76.3%) of all animal bite visits. Cat bite visits (n=3,238) comprised 13.3% (range: 12.2%–14.4%) of animal bite visits, followed by rat and mouse bite visits (n=1,614, 6.6%), and other animal bite visits (n=1,600, 6.6%).
Dog bites
The overall annual population-based rate of dog bite visits was 56.2 visits per 100,000 population. Rates were higher among males (64.7 per 100,000 population) than females (47.9 per 100,000 population) for all age groups (Figure 1, Graph A). While the mean age of patients with a dog bite visit was 25 years, the highest rates were among those aged 5–12 years, with 97.1 bite visits per 100,000 population (males: 110.2 per 100,000 population vs. females: 83.5 per 100,000 population) and those aged 13–17 years, with 92.0 bite visits per 100,000 population (males: 98.2 per 100,000 population vs. females: 85.6 per 100,000 population).
Figure 1.
Mean annual population-based rate of animal bites by age and sex, New York City, 2003–2006
aOther animals include raccoons, squirrels, opossums, bats, monkeys, horses, ferrets, hamsters, rabbits, guinea pigs, and animals that were not specified.

Cat bites
The population-based rate of cat bite visits was 10.2 per 100,000 population. Rates were higher among females than males (12.8 vs. 7.2 per 100,000 population, respectively) (Figure 1, Graph B) in all age groups, except children younger than 2 years of age. The mean age of people with cat bite visits was 40 years, which was significantly different from the mean age of dog bite victims (p<0.001). The highest rate was seen among women aged 40–64 years, with 18.0 bite visits per 100,000 population. The largest difference in the rate of cat bites between females and males also occurred in those aged 40–64 years, with 18.0 bite visits vs. 8.8 bite visits per 100,000 population for females and males, respectively.
Rat and mouse bites
The population-based rate of rat and mouse bite visits was 5.1 bite visits per 100,000 population. The mean age of rodent bite victims was 33 years, which was significantly different from dog bite (p<0.001) and cat bite (p<0.001) victims. Rat and mouse bite visit rates were highest among infants younger than 2 years of age (13.1 per 100,000 population) and children between 2 and 4 years of age (8.7 per 100,000 population) (Figure 1, Graph C). Rates among males and females were comparable except in the group of 2- to −4-year-olds, where the male rate (11.3 bite visits per 100,000 population) was almost twice that of females (6.0 bite visits per 100,000 population).
Other animal bites
Although bite visits from animals such as monkeys, raccoons, and squirrels were specifically targeted for inclusion in the “other” category, the majority of the records (n=941, 58.8%) in this category did not specify animal type. When animal type was specified, those most commonly reported were squirrels (n=287, 17.9%) and hamsters (n=173, 10.8%). Other animals reported included bats (n=60, 3.8%) and raccoons (n=21, 1.3%) (data not shown). Rates of bites among people aged ≤17 years (range: 6.2 to 7.9 bite visits per 100,000 population) were consistently higher than rates in people aged ≥18 years (range: 2.8 to 5.4 bite visits per 100,00 population), with the exception of males aged <2 years (Figure 1, Graph D).
Geography
More than 99% of the records included a ZIP code of residence for the patient. The majority of animal bite visits were among Brooklyn residents (n=7,120); however, the highest population-based rate of all bite visits occurred in Bronx residents (99.9 per 100,000 population) followed in descending order by residents in Manhattan (79.9 per 100,000 population), Brooklyn (72.3 per 100,000 population), Staten Island (60.9 per 100,000 population), and Queens (54.8 per 100,000 population). Dog bite visit rates in NYC were highest in the Bronx (n=3,896, 71.7 per 100,000 population) compared with other boroughs (48.6 per 100,000 population) (Figure 2). Most cat bite visits occurred in Manhattan (n=898, 14.1 per 100,000 population), followed closely by Brooklyn (n=871, 8.8 per 100,000 population). The rate of rat and mouse bite visits was highest in the Bronx (n=497, 9.2 per 100,000 population) followed by Manhattan (n=348, 5.5 per 100,000 population).
Figure 2.
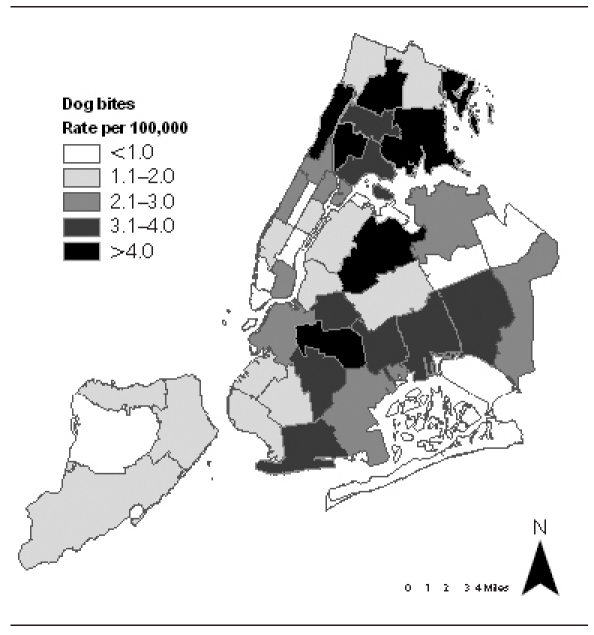
Mean annual population-based rate of dog bites by neighborhood of residence, New York City, 2003–2006
Syndromic surveillance vs. existing animal bite surveillance system
Overall, the proportion of animal bite visits among all ED visits remained constant, averaging 0.19% during the study period, while the annual number of animal bites reported via traditional passive surveillance declined 31%, from 7,143 to 4,938 (Table 2). This decline occurred among all categories of animal bites (i.e., dog, cat, and other), although substantial declines were noted primarily among dog bites and other animal bites. Dog bite reports accounted for the majority (68%) of all reports and decreased 21% (from 4,423 to 3,498) from 2003 to 2006. Reports of other animal bites decreased 82% (from 1,439 to 261), but only comprised 12% of the total number of animal bite reports.
Table 2.
Comparison of the number of animal bites captured by ED visits and NYC DOHMH animal bite reports, by year, New York City, 2003–2006

ED = emergency department
NYC DOHMH = New York City Department of Health and Mental Hygiene
DISCUSSION
ED surveillance data offers an effective and efficient method for conducting animal bite surveillance to monitor trends and characterize animal bite victims. Once ED data file transfers were in place and algorithms were developed, surveillance required minimal additional efforts and was sustainable and stable from year to year, permitting analysis annually or on an as-needed basis.
Overall, 0.19% of all ED visits were from animal bites, and dog bite visits alone were responsible for 0.15% of all ED visits. Steele et al.21 reported similar findings; however, other studies reported much higher figures. MacBean et al. reported 0.8% of ED visits attributable to mammalian bites; however, that study included human bites.22 Weiss et al. reported that 0.4% of all ED visits were attributable to dog bite injuries.13 It is unclear why the findings from NYC were different, but these differences may be explained by the large number of patients presenting to EDs in NYC for routine care, ultimately diluting the number of patient visits for dog or other animal bites. A survey conducted by the NYC DOHMH found that an estimated 9.4% of NYC residents seek medical care or health advice from EDs rather than private primary care physicians23 compared with 2.4% of the U.S. population.24,25
Our review showed that dog bites accounted for most of the animal bite visits to EDs, comprising 73% of all animal bite visits. This percentage is comparable to other ED-based surveillance systems, which have reported dog bites accounting for between 78% and 80% of all animal bite visits.16,21,22 The population-based rate of dog bite victims seeking medical attention in NYC was 56.2 per 100,000 population. While this figure is lower than a previously published rate for NYC of 85.0 per 100,000 population reported in 1998,26 it also differs from previously conducted studies in other major urban areas, with rates ranging from 129.0 to 171.0 dog bites per 100,000 population.12,27,28 It is unclear why NYC has a lower rate, but it could possibly be due to a smaller percentage of households with dogs compared with other parts of the U.S. According to the American Pet Products Association, 39% of households in the U.S. have a dog in the home, while 13% of households in NYC reported having a dog in the home.23
Our description of bite victims mirrors findings from other reports.12,13,16,21,22 Young and adolescent males (aged 2–17 years) were more likely to be bitten by dogs, and adult females (aged ≥18 years) were more likely to be bitten by cats. Women are more likely to own cats29,30 and may be more likely to care for stray or feral cats, thereby putting themselves at increased risk for bites. More bites occurred during the summer months (May through September), with the proportion of animal bite visits in the summer doubling the proportion of such visits during the winter.
The large study sample size allowed for the -assessment of rat and mouse bite visits as well. Rates were highest among children younger than 4 years of age. Parents and/or guardians may be more inclined to seek treatment for a small child who has been bitten by a rat or mouse than for themselves. In 1998, Childs et al. attempted to predict rat infestations based on reports of rodent bites.3 The authors suggested that rodent bites occurring in the home were more common among infants, as they are closest to rodent habitats because of crawling and being closer to the ground. While there are no rodent population estimates in NYC, a citywide survey conducted in 2004 asked the frequency with which people saw rats or mice in buildings or on the street near their residences. Bronx residents reported the highest percentage of rodent sightings (52%), followed by Manhattan residents (49%), which was consistent with rat and mouse bite ED data. Bites sustained from other or uncategorized animals were difficult to compare with past studies because of limited reports in the literature.1,15,21
ED surveillance data were also used to measure animal bite reporting compliance. There was a clear decline between 2003 and 2006 among animal bite reports received through passive surveillance, while the ED surveillance data showed the proportion of animal bites remained constant. The decline in traditional animal bite reports may have been a true decline or, more likely, may indicate decreased compliance by health-care professionals, as has been seen in general, particularly with the advent of electronic laboratory reporting.31
Limitations
The ED surveillance system covers almost 90% of all ED visits in NYC. In NYC, ED usage may differ from other parts of the country in that EDs, rather than primary care physicians, are used more frequently in NYC than in other cities. While ED surveillance offers a method for capturing animal bite cases that require medical attention, personal identifiers are not available, which prevents patient follow-up or identification of patients with repeat visits for the same animal bite. Additionally, ED data do not describe the location or severity of injuries sustained, the circumstances surrounding the bite, identifying characteristics of the animal (e.g., owned vs. wild or stray animal), or location (e.g., within NYC or elsewhere) to evaluate the need for rabies postexposure prophylaxis. Therefore, these data are best used to monitor trends, describe the epidemiology of animal bites, and evaluate hospital reporting.
The chief complaint field was a free-text string entered by ED admission or triage staff at each hospital with no standardization within and between hospitals. The algorithm attempted to recover records with grammatical errors such as misspellings, missing letters, and extra spaces. However, it was accepted that there would be a small proportion of records that were misclassified and not truly animal bites, as well as missing records that were actually animal bites. For example, a patient who gave a chief compliant of a laceration without specifying that it was from an animal would have been missed. Similarly, if the chief complaint was listed as an animal bite and not specified as a dog, then it would have been incorrectly included in the “other” animal bite category. It was estimated that 3%–5% of records were misclassified. The level of error was similar for each year of data; therefore, the systematic error would not have caused considerable differences between datasets.
CONCLUSIONS
Animal bites are preventable. The ED syndromic surveillance system provides an easy-to-use, consistent, and comprehensive tool to monitor and evaluate trends and describe animal bite victims seeking medical attention. The NYC DOHMH plans to use these data to conduct outreach in those NYC neighborhoods with the highest dog bite rates. Efforts will be undertaken in collaboration with the NYC Department of Education to promote animal bite prevention lesson plans developed by the NYC DOHMH for school-aged children. In addition, these data will be used to target outreach efforts to improve reporting compliance by health-care facilities in the areas with the highest discordance between ED data and provider-based reporting of animal bites. This information may also be used as a proxy to identify the areas in NYC that are most affected by rodent infestation. Abatement programs could then be targeted for those with the highest rates. We plan to continue to collect and analyze these data annually and assess our outreach efforts to reduce animal bites and improve provider reporting compliance.
Footnotes
This project was exempt from Institutional Review Board approval because it was based on surveillance data that contained no identifying characteristics.
REFERENCES
- 1.Berzon DR, Farber RE, Gordon J, Kelley EB. Animal bites in a large city—a report on Baltimore, Maryland. Am J Public Health. 1972;62:422–6. doi: 10.2105/ajph.62.3.422. [DOI] [PMC free article] [PubMed] [Google Scholar]
- 2.Talan DA, Citron DM, Abrahamian FM, Moran GJ, Goldstein EJ. Bacteriologic analysis of infected dog and cat bites. Emergency Medicine Animal Bite Infection Study Group. N Engl J Med. 1999;340:85–92. doi: 10.1056/NEJM199901143400202. [DOI] [PubMed] [Google Scholar]
- 3.Childs JE, McLafferty SL, Sadek R, Miller GL, Khan AS, DuPree ER, et al. Epidemiology of rodent bites and prediction of rat infestation in New York City. Am J Epidemiol. 1998;148:78–87. doi: 10.1093/oxfordjournals.aje.a009563. [DOI] [PubMed] [Google Scholar]
- 4.Ordog GJ, Balasubramanium S, Wasserberger J. Rat bites: fifty cases. Ann Emerg Med. 1985;14:126–30. doi: 10.1016/s0196-0644(85)81073-8. [DOI] [PubMed] [Google Scholar]
- 5.Insurance Information Institute. Dog bite liability. 2011. Aug, [cited 2011 Sep 27]. Available from: URL: http://www.iii.org/media/hottopics/insurance/dogbite.
- 6.American Pet Products Manufacturers Association. Industry statistics & trends: pet ownership. [cited 2007 Oct 18]. Available from: URL: http://www.americanpetproducts.org/press_industrytrends.asp.
- 7.Human Society of the United States. US pet ownership statistics. [cited 2010 Feb 15]. Available from: URL: http://www.humanesociety.org/issues/pet_overpopulation/facts/pet_ownership_statistics.html.
- 8.Chomel BB, Belotto A, Meslin FX. Wildlife, exotic pets, and emerging zoonoses. Emerg Infect Dis. 2007;13:6–11. doi: 10.3201/eid1301.060480. [DOI] [PMC free article] [PubMed] [Google Scholar]
- 9.Wise JK, Heathcott BL, Gonzalez ML. Results of the AVMA survey on companion animal ownership in US pet-owning households. American Veterinary Medical Association. J Am Vet Med Assoc. 2002;221:1572–3. doi: 10.2460/javma.2002.221.1572. [DOI] [PubMed] [Google Scholar]
- 10.Berzon DR. The animal bite epidemic in Baltimore, Maryland: review and update. Am J Public Health. 1978;68:593–5. doi: 10.2105/ajph.68.6.593. [DOI] [PMC free article] [PubMed] [Google Scholar]
- 11.Centers for Disease Control and Prevention (US) Dog bite prevention. [cited 2011 Sep 27]. Available from: URL: http://www.cdc.gov/homeandrecreationalsafety/dog-bites/biteprevention.html.
- 12.Nonfatal dog bite-related injuries treated in hospital emergency departments—United States, 2001. MMWR Morb Mortal Wkly Rep. 2003;52(26):605–10. [PubMed] [Google Scholar]
- 13.Weiss HB, Friedman DI, Coben JH. Incidence of dog bite injuries treated in emergency departments. JAMA. 1998;279:51–3. doi: 10.1001/jama.279.1.51. [DOI] [PubMed] [Google Scholar]
- 14.Barrett J, Frey R, Gale T. San Francisco: Healthline Networks, Inc.; 2006. [cited 2007 Sep 20]. Animal bite infections. Also available from: URL: http://www.healthline.com/galecontent/animal-bite-infections. [Google Scholar]
- 15.Maetz HM. Animal bites, a public health problem in Jefferson County, Alabama. Public Health Rep. 1979;94:528–34. [PMC free article] [PubMed] [Google Scholar]
- 16.Sinclair CL, Zhou C. Descriptive epidemiology of animal bites in Indiana, 1990-1992—a rationale for intervention. Public Health Rep. 1995;110:64–7. [PMC free article] [PubMed] [Google Scholar]
- 17.Chang YF, McMahon JE, Hennon DL, LaPorte RE, Coben JH. Dog bite incidence in the city of Pittsburgh: a capture-recapture approach. Am J Public Health. 1997;87:1703–5. doi: 10.2105/ajph.87.10.1703. [DOI] [PMC free article] [PubMed] [Google Scholar]
- 18.Heffernan R, Mostashari F, Das D, Karpati A, Kulldorff M, Weiss D. Syndromic surveillance in public health practice, New York City. Emerg Infect Dis. 2004;10:858–64. doi: 10.3201/eid1005.030646. [DOI] [PubMed] [Google Scholar]
- 19.Mostashari F, Hartman J. Syndromic surveillance: a local perspective. J Urban Health. 2003;80(2 Suppl 1):i1–7. doi: 10.1093/jurban/jtg042. [DOI] [PMC free article] [PubMed] [Google Scholar]
- 20.SAS Institute Inc. SAS®: Version 9.1 for Windows. Cary (NC): SAS Institute, Inc.; 2003. [Google Scholar]
- 21.Steele MT, Ma OJ, Nakase J, Moran GJ, Mower WR, Ong S, et al. Epidemiology of animal exposures presenting to emergency departments. Acad Emerg Med. 2007;14:398–403. doi: 10.1197/j.aem.2006.12.012. [DOI] [PubMed] [Google Scholar]
- 22.MacBean CE, Taylor DM, Ashby K. Animal and human bite injuries in Victoria, 1998-2004. Med J Aust. 2007;186:38–40. doi: 10.5694/j.1326-5377.2007.tb00787.x. [DOI] [PubMed] [Google Scholar]
- 23.New York City Department of Health and Mental Hygiene. Epiquery: NYC interactive health data. [cited 2010 Feb 15]. Available from: URL: http://nyc.gov/health/epiquery.
- 24.Weber EJ, Showstack JA, Hunt KA, Colby DC, Callaham ML. Does lack of a usual source of care or health insurance increase the likelihood of an emergency department visit? Result of a national population-based study. Ann Emerg Med. 2005;45:4–12. doi: 10.1016/j.annemergmed.2004.06.023. [DOI] [PubMed] [Google Scholar]
- 25.Weber EJ, Showstack JA, Hunt KA, Colby DC, Grimes B, Bacchetti P, et al. Are the uninsured responsible for the increase in emergency department visits in the United States? Ann Emerg Med. 2008;52:108–15. doi: 10.1016/j.annemergmed.2008.01.327. [DOI] [PubMed] [Google Scholar]
- 26.Borud LJ, Friedman DW. Dog bites in New York City. Plast Reconstr Surg. 2000;106:987–90. doi: 10.1097/00006534-200010000-00004. [DOI] [PubMed] [Google Scholar]
- 27.Ndon JA, Jack GJ, Wehrenberg WB. Incidence of dog bites in Milwaukee, Wis. Wis Med J. 1996;95:237–41. [PubMed] [Google Scholar]
- 28.Hoff GL, Cai J, Kendrick R, Archer R. Emergency department visits and hospitalizations resulting from dog bites, Kansas City, MO, 1998-2002. Mo Med. 2005;102:565–8. [PubMed] [Google Scholar]
- 29.Straede CM, Gates GR. Psychological health in a population of Australian cat owners. Anthrozoos. 1993;6:30–41. [Google Scholar]
- 30.Clancy EA, Moore AS, Bertone ER. Evaluation of cat and owner characteristics and their relationships to outdoor access of owned cats [published erratum appears in J Am Vet Med Assoc 2003;223:72] J Am Vet Med Assoc. 2003;222:1541–5. doi: 10.2460/javma.2003.222.1541. [DOI] [PubMed] [Google Scholar]
- 31.Effect of electronic laboratory reporting on the burden of Lyme disease surveillance—New Jersey, 2001-2006. MMWR Morb Mortal Wkly Rep. 2008;57(2):42–5. [PubMed] [Google Scholar]