

Abstract
We have established a new simple behavioral paradigm in Drosophila melanogaster to determine how genes and the environment influence the behavior of flies within a social group. Specifically, we measure social space as the distance between two flies. The majority of Canton-s flies, regardless of their gender, are within two-body lengths from each other. Their social experience affects this behavior, with social isolation reducing and mating enhancing social space respectively, in both males and females. Unlike several other social behaviors in the fly, including the formation of social groups themselves (a well described behavior - Bartelt et al., 1985, De Gee et al., 2008, Lof et al., 2008, Lof et al., 2009), social space does not require the perception of the previously identified aggregation pheromone cis-Vaccenyl Acetate (Bartelt et al., 1985). Conversely, performance of the assay in darkness or mutations in the eye pigmentation gene white increased social space. Our results establish a new assay for the genetic dissection of a fundamental mode of social interaction.
Keywords: Drosophila; Social behavior; Social space; Social isolation; Mating; Orb83b, sbl1; white
INTRODUCTION
A crucial aspect of animal behavior is social interaction. Its most basic form is “local enhancement”, the natural tendency of animals of the same species to congregate in close proximity within a group, or social aggregate. Local enhancement is an evolutionarily adaptive behavior (Rohlfs & Hoffmeister, 2004) and occurs in most if not all motile species from bacteria to whales (Parrish & Edelstein-Keshet, 1999). Indeed, the phenomenon can be easily observed, e.g. the regular spacing of perched birds. The formation of the group itself has been well characterized (Bartelt et al., 1985, De Gee et al., 2008, Lof et al., 2009, Mogilner et al., 2003, Navarro & Del Solar, 1975, Symonds & Wertheim, 2005, Tinette et al., 2007). In contrast, the regulation of the spacing between individuals within a group has received less attention, and determination of social distance is surprisingly poorly understood in humans.
Mogilner et al. (Mogilner et al., 2003) defined “Social Space”, as the measure of the distance between two individuals. These authors used this measure to mathematically model the spacing of individuals in a social aggregate (such as swarm, flock, school, or herd of birds, fish, locust, or groups of bacteria - Mogilner et al., 2003). Body length is an important metric to determine social space in a variety of species, including gulls, separated by 1 body length in flocks (Emlen, 1952), or tufted ducks spaced 2-3 body lengths apart (Conder, 1949). Social space probably results from an equilibrium between multiple attractive and repulsive cues (reviewed in Mogilner et al., 2003), in addition to environmental factors. For example, schools of anchovies increase their social space at night relative to their daytime behavior (Aoki & Inagaki, 1988). Similar to many other social behaviors, social space is likely to be subject to a variety of other, complex gene-environment interactions.
Drosophila is emerging as a powerful model for the study of the genetic basis of social behavior (Sokolowski, 2010). Flies show a tendency to be attracted to one another and to congregate in all types of test chambers (Bolduc et al., 2010, Lefranc et al., 2001, Navarro & Del Solar, 1975). Importantly, increased proximity to con-specifics is required prior to other, more complex behaviors (Chen et al., 2002, Connolly & Tully, 1998). Thus, social aggregation precedes mating or aggression. However, the mechanisms that determine the behavior of flies within a stable social group are not known.
Here we describe a simple assay to study a fundamental form of social behavior in the fruit fly: social space within a social group. The dynamics of this behavior differs from other well-studied Drosophila behaviors including the formation of groups (Bartelt et al., 1985, Lof et al., 2009, Rohlfs & Hoffmeister, 2004) and the exploratory behavior of groups (Tinette et al., 2004). Furthermore, unlike the formation and exploration of groups, we find social space does not depend on classical odorant perception and therefore may employ different genetic pathways.
MATERIAL AND METHODS
Drosophila stocks and husbandry
Drosophila stocks were raised in standard food cornmeal/molasses/agar bottles or vials at 25°C with a relative humidity of 20-40% in a 12-hour dark/light cycle. Canton-s (Cs) and w1118Cs10 (w1118 outcrossed 10 times to Canton-s) were from our laboratory stocks (Simon et al., 2003). The following lines were placed in Cs background through outcrosses: Or83b1 and Or83b2 (Larsson et al., 2004), generously provided by Dr. John Carlson from Yale University, were outcrossed 5 times to w1118Cs10. The mutant paraslb1 (Lilly et al., 1994) in a Cs background was generously provided by Dr. Joel Levine (University of Toronto).
Behavioral analysis
All behavioral experiments were performed in a genotype-balanced manner (see Drosophila stocks and husbandry). To minimize the disruption of standard environmental conditions, flies were reared in bottles and thus socially enriched unless noted otherwise in the text, kept as mixed genders to allow mating, and kept with standard food at all times prior to testing. Flies were separated by gender the day prior to each experiment.
Handling
As described in (Connolly & Tully, 1998) and (Simon et al., 2006), all experiments used flies naive to the test performed. However, for most experiments, they were raised in bottles and therefore socially enriched. Unless otherwise noted in the text, the flies were collected from the bottles when ~3-4 days old, and sexed the day before the experiment, under cold anesthesia, and experiments were performed under ambient light. The flies were allowed to habituate to the testing room for 2 hours before each experiment. The experiments were performed at the same time of the day, in a range of 3-4 hours in the afternoon (between ZT5 and ZT9), to reduce variation in performance linked to circadian rhythm. All behavioral assays were carried out in the same dedicated room at ~25°C.
Social space assay
The vertical triangle test chamber was constructed using two square glass plates (18 × 18 cm), separated by 0.47 cm using acrylic spacers to confine the flies to a 2-D space. Four spacers were used: two right triangles for each side, and two rectangular at the bottom (see photo, Fig. 1B), thereby defining an isosceles triangular internal chamber (base: 15.2 cm, height: 15.2 cm). The two bottom spacers were transiently separated to allow the introduction of flies to the chamber.
Figure 1. Social space in aggregates of wild type flies (Canton-s).
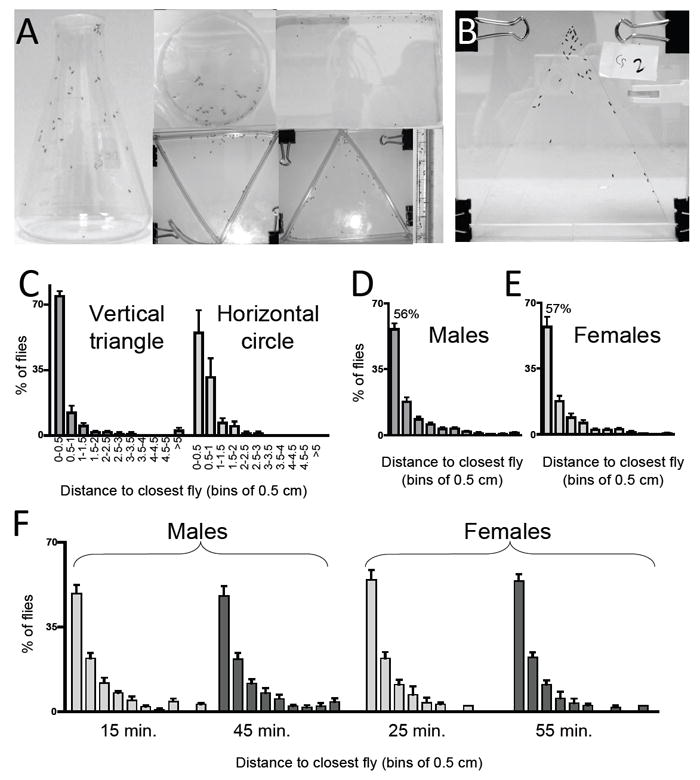
A) Group formation in different chambers. From left to right, clockwise: 250 ml Erlenmeyer flask, horizontal circular chamber (9 cm in diameter), horizontal rectangular chamber (18 × 24.5cm), 0.8 cm diameter tube (10 ml pipette), vertical triangle (height: 20 cm, base: 22 cm), inverted vertical triangle with same dimensions as vertical triangle (note that panels are not to scale). B) Vertical triangle assay chamber containing 40 flies (height: 15.3 cm, base: 15.3 cm, see methods). C – F) Quantitation of social space after 15 min. in the chamber. The graph represents the percentage of flies (±SEM) at the indicated distance from their closest neighbor, using bins of 0.5 cm. C) Quantitation of social space in a vertical triangular chamber and in a horizontal circular chamber, see methods for details (n=3 trials of males). D-E) Similar social space in a vertical triangle chamber for D) Males, n=21 trials of ~40 flies, and E) Females, n=16. Males and female behavior does not differ (Kolmogorov-Smirnov Test). F) Time spent in the chamber does not affect social space. Quantitation after different times in the chamber, males (n=12) after 15 min. and 45 min., females (n=6) after 25 min. and 55 min. Social space does not differ (Kolmogorov-Smirnov Test). For C to E, each trial consists of ~40 flies (3-5 days old).
The horizontal circular chamber shown in Fig. 1A and analyzed in Fig. 1C and Fig. 2F-I was created using the plastic culture dish (9 cm of internal diameter and 0.9 cm deep), covered with a glass plate. The glass cover was briefly removed from chamber to allow the introduction of flies.
Figure 2. A Social Space Index to determine social interactions.
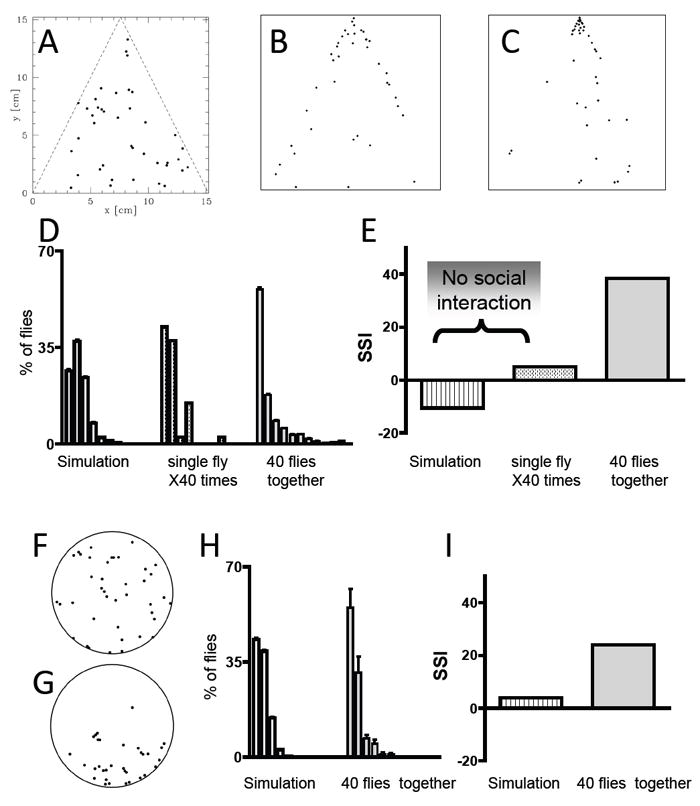
A-E) Vertical triangle chamber. A-C) Aggregation patterns of A) a random simulation of 40 dots; B) a merged image of 40 single flies; C) 40 flies assayed together. To increase visibility in the figure, the area of the marks representing each fly in (A) to (C), was increased (x 6) relative to their original size. Quantitation of social space was performed using the more precisely localized original mark. Comparison of A to B shows the effects of centrophobism and negative geotaxis; Comparison of B to C shows the added effects of interactions between individual flies. D) Quantification of social space between flies. The graphs represent the percentage of flies (±SEM) at the different distances from their closest neighbor, using bins of 0.5 cm. The 3 histograms differ significantly (Kolmogorov-Smirnov Test, P<00001). E) A simplified representation of the data is shown as a Social Space Index (SSI, defined as the value of the first bin minus the value of the second bin). An SSI score of =<0 suggests little or no social interaction (see text). F-I) Quantitation of behavior in a horizontal circular chamber. F) Aggregation patterns of a random simulation of 40 dots to compare to 40 flies G) (as in 2A-C the size of marks representing each fly was increased by a factor of 6 to enhance their visibility in the figure), H) Quantification of social space between flies in a circular chamber comparing the random simulation and the distribution of three trials of 40 flies tested together. The 2 histograms in (H) differ significantly (Kolmogorov-Smirnov Comparison indicates that the data-sets are different p<0.00001). I) Social Space Index comparing the simulation and 40 flies tested together in a horizontal chamber.
Flies were raised in bottles, collected under cold anesthesia 3-4 days old after eclosion, and placed in vials (40/vial) one day prior to the experiment. Two hours prior each experiment, the vials were habituated to the test room (25°C). Flies were collected from vials, using gentle suction with a mouth aspirator (Ejima & Griffith, 2010) and introduced into the chamber through the opening between the bottom spacers. After the entrance was closed, the bottom of the chamber was banged on a lab bench 3 times, to ensure that all flies were at the same starting point. Digital images were collected after the flies reached a stable position (up to 20 minutes, see text).
Digital images were imported in PowerPoint (Microsoft PowerPoint ® 2004 for Mac). Each fly in the image was represented by a small dot (0.05 cm in diameter) drawn at the center of the thorax. An automated measure of the nearest neighbor to each dot (fly) was determined using Lispix, a public domain image analysis program (written by David S. Bright, Microanalysis Research Group, NIST; web page: http://www.nist.gov/lispix/LxDoc/home.html). Of note, although there are multiple programs to follow moving flies, to our knowledge there is no dedicated program to analyze still flies.
This data set was imported into Excel (Microsoft Excel ® 2004 for Mac), and Prism 4 (GraphPad Software, San Diego, CA) used for most of the statistical analysis. Comparison of histograms was performed using an online Kolmogorov-Smirnov test because these data do not follow Gaussians distribution (KS-test - web page: http://www.physics.csbsju.edu/stats/KS-test.html). All experiments were run at least in triplicate.
To measure the effect of group size on social space, flies were reared in bottles and housed at a density of 40 flies/vial for 12-18 hours prior to the assay. A few minutes prior to testing, different number of flies to were introduced into the test chamber using gentle suction with a mouth aspirator: either the whole vial (40 flies), or 30, 20 and 10 flies, were counted as they were collected.
Social Space Index
the calculation of the Social Space Index (SSI) is based on the values obtained in the histogram representations of the social distance. SSI equals the percentage of flies in the first bin minus the percentage of flies in the second bin (SSI= first bin – second bin). As described in the Results section, an SSI =<0 suggests a lack of social interactions. Kolmogorov-Smirnov tests were used to statistically analyze histograms, and t-tests used for the SSIs.
Generation of a random distribution
Social space under experimental conditions was compared to Monte Carlo in-silico simulations of random distributions of flies. A custom script in the C programming language was created to simulate 20 spatially random realizations of a population of 40 flies in a triangle-shaped or circle-shaped enclosure identical to those used for behavioral experiments. For each simulation, we calculated a histogram of the distances to the nearest neighbor. A representative random distribution is shown in Fig. 2A and Fig. 2F, and the mean and the standard error of each histogram bin from the 20 simulations are shown in Fig. 2D and Fig. 2H.
Climbing assay
climbing behavior was assessed in a counter–current apparatus (Benzer, 1967, Connolly & Tully, 1998) as described (Connolly & Tully, 1998, Simon et al., 2009).
Fast phototaxis in adults
Fast positive phototaxis was assessed in a counter–current apparatus (Benzer, 1967, Connolly & Tully, 1998) as described (Connolly & Tully, 1998, Romero-Calderon et al., 2007).
RESULTS
A simple behavioral assay to measure social space
To study the regulation of local enhancement, we measured the distance between individual flies and their closest neighbor: their “Social Space” (Mogilner et al., 2003). As described by others, we found that flies form groups in several different types of chambers (Fig. 1A, also see Bolduc et al., 2010, Lefranc et al., 2001, Navarro & Del Solar, 1975). However, locomotion in horizontally oriented chambers is dominated by exploration and dispersal rather that local enhancement, making it difficult to obtain stable measurements of social space (Fig. 1C, also see Lefranc et al., 2001, Simon & Dickinson, 2010, Tinette et al., 2004). In our hands, horizontal group of flies do not assume a static position even after spending 1 hour in the chamber. In contrast, in vertically oriented chambers, we find that the flies stop moving and assume a stable position within ~20 minutes. The shape of the container also affected the flies’ position and behavior, and we found that a triangular shape was most useful. Using the vertically oriented, triangular chamber shown in Fig. 1B, flies show a consistent sequence of behaviors amenable to acquisition of data on social space. For the first few minutes after placing the flies in the chamber, they display an escape response, manifested as negative geotaxis. Negative geotactic behavior ends as the flies crowd into the upper tip of the triangular assay chamber. They then move away from each other and locomote for several minutes (~5-10 minutes in males, and up to 20 min for females) in an apparent attempt to reduce local crowding and to explore their new environment. At the end of the exploration phase, the flies remain essentially in one location and engage in sporadic grooming behavior for up to 45-55 min. and their social distance is stable throughout that time (Fig. 1F, compare 15 versus 45 min for males, 25 versus 55 min for females). The relative stability of the distance between flies at this stage allows the easy acquisition of digital images for subsequent quantitation of the flies’ location. Although it may also be possible to analyze social space using moving animals, the analysis would be complicated by variations in locomotor speed, and generally more technically demanding than the analysis of still pictures. To confine the image analysis of the final position to only two dimensions, the depth of the chamber was restricted to 0.47 cm (3/16”). This arrangement prevented two flies from occupying the same x, y coordinate (see Experimental Procedures).
Quantitation of the flies’ position in the test chamber showed a surprisingly consistent distribution of distances between each fly and its closest neighbor. We find that 56% ± 3 (mean ± SEM) of the flies lie within 0 to 0.5 cm from their nearest neighbor (~ 2 body lengths in magnitude and comparable to social distances observed in other species - Mogilner et al., 2003), and 18% ± 2 are within 0.5 to 1 cm. The remaining 20 % of the population are further apart as shown in Fig. 1D. The pattern of the fly’s social space is the same in both genders, consistent with previous observations (Navarro & Del Solar, 1975 and Fig. 1D-F).
To confirm that the distance between the flies in our assay was governed by social interactions rather than the result of a random distribution, we used a computer simulation to map the location of 40 randomly placed dots (Fig. 2A). In addition, to account for the effects of centrophobism and geotaxis in individual flies lacking all social interactions, we assayed single flies 40 times, and merged the data into a single combined image (Fig. 2B). We compared these distributions to that of 40 flies assayed together as described above (Fig. 2C). The flies assayed individually were attracted to the sides of the chamber (a well described behavior - Simon & Dickinson, 2010, Valente & Mitra, 2007), but also moved away from the top. In contrast, we observed that the flies assayed in-group displayed less attraction to the sides and form a more robust aggregate at the top of the chamber. The flies that do not aggregate at the top and migrate to the sides of the chamber also form closely situated pairs (Fig. 2C).
For each condition, the data representing the distance between each fly (or random dot) was binned and used to generate a histogram, in which we represent the percentage of flies (y axis) for every 0.5 cm increment (bins on the x axis - Fig. 2D). The patterns of the three histograms differed significantly (Kolmogorov-Smirnov Test, P<0.00001) demonstrating that interactions between the individual flies influence their distribution in the test chamber.
The most obvious difference between the histograms was the relative size of the first and second bins. For flies tested together under “social conditions” (i.e., with other flies), the first bin was consistently larger than the second (Fig. 2D). In other words, there was a higher percentage of flies within 2-body lengths of each other as compared to those that were >2 to 4 body lengths from the nearest fly. In contrast, for flies tested separately, the first and second bins were roughly the same size. We therefore generated a simple “social space index” (SSI) by subtracting the percentage of flies in the 2nd bin from the percentage of flies in the 1st bin (Fig. 2E). Using this metric we obtain a value of 0 or less when flies behave similarly to those tested individually (with the second bin containing a similar or higher percentage of flies than the first one), and therefore assign 0 as the baseline SSI representing social space in the absence of social interactions (such as in Fig. 2B). We obtain an SSI of 100 when all of the flies are in bin 1 (or 100% of the flies 0 to 0.5 cm from each other, 2-body length apart or less), which we define as a state of maximal social interaction. For 40 Canton-s flies of 3-4 days old, on average, we obtain an SSI of ~40 (38.4 ± 4.6, n=21 - Fig. 2E).
As explained above, we chose to use a vertical triangular chamber for most tests. However, we also confirmed that non-random aggregation patterns were also seen in horizontal circular chambers, using similar analysis (Fig. 2F-I). The percentage of flies which are 2-body lengths apart is more variable, seen as the larger bars representing the SEM in Fig. 2H as compared to Fig. 2D which flies were visualized in the triangular chamber. However, the pattern of distribution is similar to that seen in the vertical triangular chamber, and different from what would be seen in a random simulation (Fig. 2H - Kolmogorov-Smirnov Test, p<0.00001). Similarly, the SSI of a random simulation is close to zero, even in this chamber of a completely different size, shape and orientation (Fig. 2I).
For all of the experiments described below we analyzed both the overall pattern of the histograms as well as the SSI. We show the SSIs here and the histograms in Supplementary Fig. 1. To control for behavioral effects of environment seen in many other behavioral paradigms (e.g. associative learning Connolly & Tully, 1998), each experiment was performed with a matched, internal control, and in a temperature controlled environment. All attempts were made to keep the testing room at constant humidity; it was not feasible to humidify the test apparatus used here without disrupting the fly’s behavior.
The most extensive previous studies of group formation show that flies are gregarious and cooperative, and that population size, presence of odorant, pheromones and genes affect this behavior (Lefranc et al., 2001, Tinette et al., 2004). Using the conditions we developed here, we first tested whether the number of flies in the chamber would influence the SSI. Although 10 flies showed a lower SSI (Fig 3A), and a statistically different distribution pattern as seen in the histograms (Supplementary Fig 1A), the distribution was constant using 20, 30 or 40 flies, (Fig. 3A and Supplementary Fig1A) demonstrating that above a certain threshold, social space did not vary with small changes in group size. For consistency, all further experiments were performed using 40 flies.
Figure 3. Social space is relatively independent of group size and correlated to social interactions.
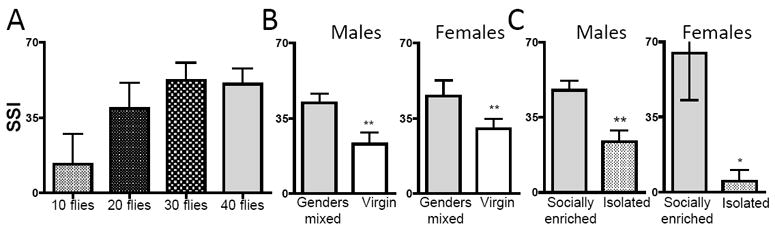
(A) Impact of group size. Graph represents the comparison of Social Space Index (SSI ±SEM) at densities of 10 to 40 flies per test chamber. The SSI was not statistically different across densities (one-way ANOVA), but showed a trend toward a lower mean and higher variance at a density of 10 flies per chamber (n=8 trials, number of male flies indicated). B-C) Social space is affected by social experience. B) Virgin flies show less social interaction. Graph represents the comparison of Social Space Index (SSI±SEM) between 3-4 day old virgins (aged with the same gender), or mated (housed gender mixed) flies; males housed with males (virgin), n=10 trials of ~40 flies, Males housed with females (gender mixed), n=21 trials of 40 flies; females, virgin, n=11 trials of ~40, house gender mixed, n=14 trials of 40 flies, t-tests indicate a significant difference of p<0.01, **. C) Isolated flies show less social interaction. Graph represents the comparison of Social Space Index (SSI±SEM) of flies ~10 days old, collected from bottles at ~3 days old, and aged for 7 days either alone, or socially enriched in groups of 40 flies of same gender. Males, n=5-6 trials of ~40 flies, Females, n=5 trials of ~40, t-tests indicate a significant difference respectively of p<0.01, **, and p<0.05, *.
The effects of social experience
As for other behaviors (see discussion), we tested whether social space would be similarly affected by social experience. Indeed, we find that male and female flies mated for three days showed higher SSI than virgins of same age (Fig. 3B and Supplementary Fig1B). In addition flies kept alone in vials for seven days from age 3-4 days old show a lower SSI than controls, socially enriched for that same period of time (Fig. 3C and Supplementary Fig1C). These data suggest that, similar to other, more complex behaviors (Ganguly-Fitzgerald et al., 2006, Krupp et al., 2008, Svetec & Ferveur, 2005, Svetec et al., 2005, Ueda & Wu, 2009), social space is influenced by prior social conditions. The simplicity of our assay facilitates experiments to determine the genetic basis of this phenomenon (see below).
Odor and pheromone perception mutants
To test whether odor or pheromone perception might be involved in regulating social space between flies, we measured the SSI of mutants defective in olfaction. We tested paraslb1, a mutant in Canton-s background with broad olfactory defects: paralytic, which encodes a sodium channel (Lilly et al., 1994). We also tested two null alleles of Or83b (Or83b1 and Or83b2 - Larsson et al., 2004), an odorant receptor, required for the perception of most odors and of the volatile pheromone cis-Vaccenyl Acetate (cVA), after outcrossing 6 times in our laboratory Canton-s background. We did not detect any differences between the SSI of these mutants and genetically matched controls (Fig. 4 A-B and Supplementary Fig. 1D-E).
Figure 4. Social space may depend on vision but not classical odor or cVA perception.
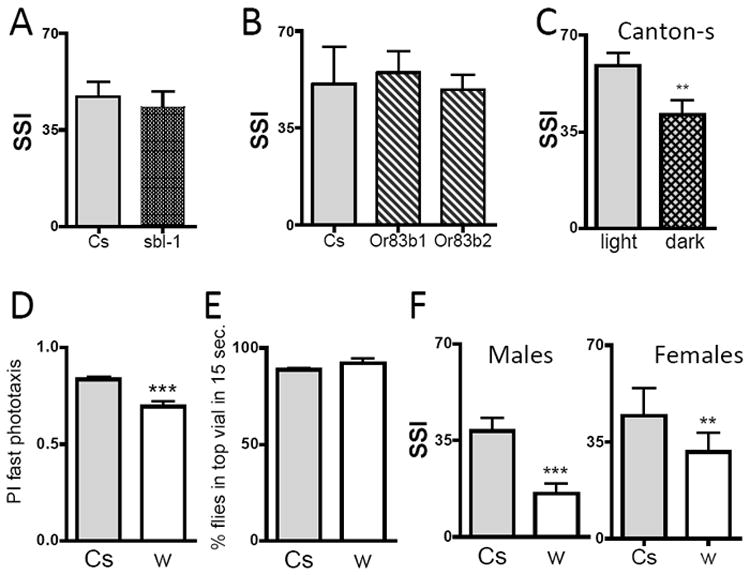
(A-C) Social Space Index is not modified in odor perception mutants; A) An allele of para (sbl1) compared to genetic background Canton-s, Males, n=6 trials of ~40 flies. B) Or83b1 and Or83b2 were outcrossed 6 times and compared to genetic background Canton-s, n=6 trials of ~40 flies (SSI±SEM). C) Flies show less social aggregation in darkness, under a red light. Graph represents the comparison of Social Space Index in light and dark conditions (Males, n=15 trials of ~40 flies, t-test indicates a significant difference of p<0.005, **). D-F) Outcrossed mutants white disrupting the eye pigments localization show less social aggregation, normal geotaxis and reduced phototaxis. w1118Cs10 were outcrossed 10 times, indicated as w, compared to their genetic control Canton-s (Cs). D) Reduction in performance in the fast phototaxis assay. Flies were given 5 times 15 sec. to go towards the light, in a counter-current apparatus (n=8 trials of ~40 male flies; SSI±SEM – t-test indicates that Cs is different from w p<0.0006, ***). E) No differences in negative geotaxis. In a climbing assay in the counter-current apparatus, the flies were giving 15 sec. to reach the upper vial (n=5 trials of ~40 male flies (SSI±SEM) – t-test indicates no differences). F) Decreased SSI in males and females white. In males, n=21 trials for Cs, and n=18 trials for w (SSI±SEM); t-test indicates that Cs and w are different from w (p<0.05, * and p<0.001, ***). In females, n=16 trials for Cs, and n=12 trials for w; t-test indicates that w is different from Cs (p<0.001, ***).
Possible effects of vision
To test the possible effects of decreased visual cues on social space we measured the SSI of flies in red light placed in a dark room. In this condition, flies still interact socially, but on average are farther from their nearest neighbor than controls, and thus show a decreased SSI (Fig. 4C and supplementary Fig. 1F). These data suggested that social space might depend at least partially on visual cues.
To determine whether more subtle changes in vision might affect social space we used a mutant of the white gene (w1118Cs10) in which eye pigmentation is essentially absent (Green, 2010). Although white mutants are not blind, they show defects in visual acuity due to the diffusion of light across adjacent photoreceptor arrays (Stark & Wasserman, 1974), and outcrossed w1118Cs10 flies display modest but consistent defects in fast phototaxis as compared to genetically matched Canton-s (Fig. 4D). To control for possible effects on motor behavior in the phototaxis test, we used a standard climbing assay. Cs and w1118Cs10 do not show differences in climbing consistent with the notion that fast phototaxis is decreased due to decreased visual abilities in w1118Cs10 (Fig. 4E).
In social space assays, we found that the w1118Cs10 male and females come to rest farther apart than their genetically matched controls and thus showed a lower SSI (Fig. 4F and supplementary Fig. 1G), similar to flies assayed in darkness (Fig. 4C). These data suggest that genetic defects in visual behavior may affect social space and more generally demonstrate the ability of our assay to detect changes in social behavior in a genetic mutant.
DISCUSSION
New assay
Several new assays have been recently developed to study social behaviors in Drosophila (Branson et al., 2009, Dankert et al., 2009, Fry et al., 2008, Simon & Dickinson, 2010, Slawson et al., 2009, Wang et al., 2008). However, most of these efforts have been focused on relatively complex social behaviors, such as aggressive interactions (Dankert et al., 2009, Wang et al., 2008), various aspects of courtship (i.e. Dankert et al., 2009, Ejima & Griffith, 2008, Griffith & Ejima, 2009, Kent et al., 2007, Mery et al., 2009, Miyamoto & Amrein, 2008, Montell, 2009, Villella et al., 2008), and how social experience affects other behaviors such as learning, or circadian rhythm (Billeter et al., 2009, Ganguly-Fitzgerald et al., 2006, Kent et al., 2008, Krupp et al., 2008, Levine et al., 2002). In contrast, to the best of our knowledge, only one other relatively simple innate social behavior beyond that which we describe here has been genetically analyzed (innate avoidance - Suh et al., 2004).
We have developed a simple method to use Drosophila to study a fundamental form of social behavior: social space in a social group. We have reproduced the earlier observation that individual flies group together, and under the test conditions used here we did not observe sexual or aggressive behaviors, also consistent with the single previous study of social distribution in Drosophila (Navarro & Del Solar, 1975).
Social space is a group characteristic
Above the threshold of 10 flies/assay, we observed the same SSI with various group sizes. This apparent insensitivity to small changes in group size is similar to that described for some fish schools and groups of birds, as well as the locust hopper band (Mogilner et al., 2003, Uvarov, 1928). Furthermore, the density of individuals inside a group under constant environmental conditions seems to be a species-specific characteristic (Mogilner et al., 2003). It will be interesting to determine whether the specific parameters for social space in D. melanogaster differ in other Drosophila species. The availability of sequenced genomes from a large number of closely related species may provide a unique opportunity for cross-species analyses. It may also be of interest to determine why flies behave in a different manner under very sparse conditions (10 flies/assay).
The effects of social experience
Social space is influenced by environmental factors including mating status and prior social isolation. Social interactions, such as mating or aggression, or lack of thereof, such as social isolation, are known to trigger a variety of behavioral responses and physiological modifications in animal species. The effects of mating in flies have been studied extensively (Villella et al., 2008). Mating is known to change the physiology and behavior of female flies, through the effect of sex peptides (Kubli, 2003). It is possible that similar pathways could account for the relative lack of social behavior we observe in virgin females, but it remains unclear why male virgins also appear to be less social. Isolation is also known to affect courtship and courtship memory (Krupp et al., 2008). Other effects of isolation include modification of neuronal excitability (Ueda & Wu, 2009), chemical communication (Kent et al., 2008, Levine et al., 2002), sleep patterns (Ganguly-Fitzgerald et al., 2006), olfactory memory (Chabaud et al., 2009), circadian rhythm (Krupp et al., 2008), and aggression in females (Wang et al., 2008).
Social space does not seem to require odor or cVA perception
To begin a genetic analysis of social space we tested paraslb1, a mutant with broad olfactory defects (Lilly et al., 1994) and two null alleles of Or83b an odorant receptor required for the perception of most odors as well as the volatile pheromone cis-Vaccenyl Acetate (cVA) (Or83b1 and Or83b2 - Larsson et al., 2004). Both the formation of groups in Drosophila, and their subsequent exploratory behavior of groups depend on known olfactory cues (Lof et al., 2009, Tinette et al., 2004). cVA has been shown previously to mediate spatial aggregation at long-range (food co-attractant in a bio-assay - Bartelt et al., 1985) and engender repulsion, aggression and some sexual behaviors at shorter range (Bartelt et al., 1985, Billeter et al., 2009, Liu et al., 2011, Wang & Anderson). We do not detect a difference in social space in either para or Or83b mutants, suggesting that classical odors and pheromones, including cVA, do not mediate this behavior. These data suggest that social space may employ different mechanisms than a number of other well-characterized social behaviors in the fly.
A possible requirement for vision
Further experiments will be needed to test whether novel pheromones and/or odor receptors (Benton et al., 2009, Yew et al., 2009) mediate social space or if either hearing or taste play a role in social space as shown recently for other social behaviors (Ejima & Griffith, 2008, Montell, 2009). Here we show that social distance increases when assays are performed in the absence of visible light, and that the w1118Cs10 mutant shows a similar deficit. Together these observations suggest that vision might be important for social space; however, we note that w1118Cs10 has been implicated in a variety of fly behaviors (Anaka et al., 2008, Campbell & Nash, 2001, Ejima & Griffith, 2008, Lee et al., 2008, Lloyd et al., 2002, Svetec et al., 2005, Yarali et al., 2009, Zhang & Odenwald, 1995) that may or may not reflect the function of white in the retina, and that white may also regulate amine levels in downstream neurons (Borycz et al., 2008, Yarali et al., 2009). It therefore remains possible that some behavioral effects of w1118Cs10 are due to activity outside of the eye and elsewhere in the nervous system. Thus our data must be considered preliminary until additional genetic experiments determine whether social space is truly dependent on vision versus another sensory modality. We note that mutant in white also decreases the ability of flies to cooperate during search behaviors (Tinette et al., 2004) but it remains unclear whether this phenotype results from a visual defect or another unrelated deficit caused by white.
Our data using white, para and Or83b demonstrate that the assay we report here is amenable to the analysis of genetic mutants and will facilitate a systematic genetic investigation of this behavior. In addition, its robust nature, low cost, and simple method of analysis should allow large scale genetic screens that would be cumbersome with more elaborate assays of social space. Social space is a fundamental social behavior and is demonstrated by all known species. We suggest that further genetic analysis of social space might prove useful for understanding the initiation of a variety of other more complex social behaviors, as well as pathological states relevant to human disease (Adamo & Tesson, 2008, Sulzer, 2007) (Bolduc et al., 2010, Gottesman & Gould, 2003).
Supplementary Material
Acknowledgments
We thank Tim Lebetsky for his constructive comments. This work was supported in part by the UCLA-NIH Bridge Program to M. -T.C; by PSC-CUNY Awards, jointly funded by The Professional Staff Congress and The City University of New York; by a 2007 Young Investigator Award from NARSAD “The World’s Leading Charity Dedicated to Mental Health Research”, by a Pilot Grant award from the UCLA Center for Autism Research and Treatment (CART) with funding by the National Institute of Health Grant (STAART - U54 MH068172, PI: M. Sigman and D. Geschwind), and by a Training support from the UCLA Cousins Center at the Semel Institute for Neurosciences with funding by the National Institute of Health Grant (T32-MH18399) to A.F.S., and NIH grant (R01 MH076900) to D.E.K.
Footnotes
Author contributions: A.F.S. and D.E.K were responsible for research design; A.F.S, M.-T.C., E.S., and S.M. performed the experiments; A.F.S, D.E.K, T.N., M.-T.C., E.S and S.M. analyzed the data; A.F.S and D.E.K. wrote the paper.
References
- Adamo KB, Tesson F. Gene-environment interaction and the metabolic syndrome. Novartis Found Symp. 2008;293:103–119. doi: 10.1002/9780470696781.ch8. discussion 119-127. [DOI] [PubMed] [Google Scholar]
- Anaka M, MacDonald CD, Barkova E, Simon K, Rostom R, Godoy RA, Haigh AJ, Meinertzhagen IA, Lloyd V. The white gene of Drosophila melanogaster encodes a protein with a role in courtship behavior. J Neurogenet. 2008;22:243–276. doi: 10.1080/01677060802309629. [DOI] [PubMed] [Google Scholar]
- Aoki I, Inagaki T. Photographic observations on the behaviour of Japanese anchovie. Engraulis japonica at night in the sea. Mar Ecol Prog Ser. 1988;43:213–221. [Google Scholar]
- Bartelt RJ, Schaner AM, Jackson LL. cis-Vaccenyl acetate as an aggregation pheromone in Drosophila melanogaster. Journal of Chemical Ecology (Historical Archive) 1985;11:1747. doi: 10.1007/BF01012124. [DOI] [PubMed] [Google Scholar]
- Benton R, Vannice KS, Gomez-Diaz C, Vosshall LB. Variant ionotropic glutamate receptors as chemosensory receptors in Drosophila. Cell. 2009;136:149–162. doi: 10.1016/j.cell.2008.12.001. [DOI] [PMC free article] [PubMed] [Google Scholar]
- Benzer S. Behavioral mutants of Drosophila melanogaster isolated by countercurrent distribution. PNAS. 1967;58:1112–1119. doi: 10.1073/pnas.58.3.1112. [DOI] [PMC free article] [PubMed] [Google Scholar]
- Billeter J-C, Atallah J, Krupp JJ, Millar JG, Levine JD. Specialized cells tag sexual and species identity in Drosophila melanogaster. Nature. 2009;461:987–991. doi: 10.1038/nature08495. [DOI] [PubMed] [Google Scholar]
- Bolduc FV, Valente D, Nguyen AT, Mitra PP, Tully T. An assay for social interaction in Drosophila fragile X mutants. Fly. 2010;4:3. doi: 10.4161/fly.4.3.12280. [DOI] [PMC free article] [PubMed] [Google Scholar]
- Borycz J, Borycz JA, Kubow A, Lloyd V, Meinertzhagen IA. Drosophila ABC transporter mutants white, brown and scarlet have altered contents and distribution of biogenic amines in the brain. J Exp Biol. 2008;211:3454–3466. doi: 10.1242/jeb.021162. [DOI] [PubMed] [Google Scholar]
- Branson K, Robie AA, Bender J, Perona P, Dickinson MH. High-throughput ethomics in large groups of Drosophila. Nat Methods. 2009;6:451–457. doi: 10.1038/nmeth.1328. Epub 2009 May 2003. [DOI] [PMC free article] [PubMed] [Google Scholar]
- Campbell JL, Nash HA. Volatile general anesthetics reveal a neurobiological role for the white and brown genes of Drosophila melanogaster. J Neurobiol. 2001;49:339–349. doi: 10.1002/neu.10009. [DOI] [PubMed] [Google Scholar]
- Chabaud M-A, Isabel G, Kaiser L, Preat T. Social facilitation of long-lasting memory retrieval in Drosophila. Current Biology. 2009;19:1654–1659. doi: 10.1016/j.cub.2009.08.017. [DOI] [PubMed] [Google Scholar]
- Chen S, Lee AY, Bowens NM, Huber R, Kravitz EA. Fighting fruit flies: a model system for the study of aggression. Proc Natl Acad Sci U S A. 2002;99:5664–5668. doi: 10.1073/pnas.082102599. [DOI] [PMC free article] [PubMed] [Google Scholar]
- Conder PJ. Individual distance. Ibis. 1949;91:649–655. [Google Scholar]
- Connolly JB, Tully T. Behavior, learning, and memory. In: Roberts DB, editor. Drosophila: A practical approach. IRL; Oxford: 1998. pp. 265–317. [Google Scholar]
- Dankert H, Wang L, Hoopfer ED, Anderson DJ, Perona P. Automated monitoring and analysis of social behavior in Drosophila. Nat Methods. 2009;6:297–303. doi: 10.1038/nmeth.1310. [DOI] [PMC free article] [PubMed] [Google Scholar]
- de Gee M, Lof M, Hemerik L. The effect of chemical information on the spatial distribution of fruit flies: ii parameterization, calibration, and sensitivity. Bulletin of Mathematical Biology. 2008;70:1850–1868. doi: 10.1007/s11538-008-9329-y. [DOI] [PMC free article] [PubMed] [Google Scholar]
- Ejima A, Griffith LC. Courtship initiation is stimulated by acoustic signals in Drosophila melanogaster. PLoS ONE. 2008;3:e3246. doi: 10.1371/journal.pone.0003246. [DOI] [PMC free article] [PubMed] [Google Scholar]
- Ejima A, Griffith LC. Measurement of courtship plasticity in Drosophila. In: Zhang B, Freeman M, Waddell S, editors. Drosophila Neurobiology, A Laboratory Manual. Cold Spring Harbor Laboratory Press; Cold Spring Harbor, New York: 2010. pp. 475–481. [Google Scholar]
- Emlen JT. Flocking behavior in birds. The Auk. 1952;69:160–170. [Google Scholar]
- Fry SN, Rohrseitz N, Straw AD, Dickinson MH. TrackFly: virtual reality for a behavioral system analysis in free-flying fruit flies. J Neurosci Methods. 2008;171:110–117. doi: 10.1016/j.jneumeth.2008.02.016. [DOI] [PubMed] [Google Scholar]
- Ganguly-Fitzgerald I, Donlea J, Shaw PJ. Waking experience affects sleep need in Drosophila. Science. 2006;313:1775–1781. doi: 10.1126/science.1130408. [DOI] [PubMed] [Google Scholar]
- Gottesman II, Gould TD. The endophenotype concept in psychiatry: etymology and strategic intentions. Am J Psychiatry. 2003;160:636–645. doi: 10.1176/appi.ajp.160.4.636. [DOI] [PubMed] [Google Scholar]
- Green MM. 2010: A century of Drosophila genetics through the prism of the white gene. Genetics. 2010;184:3–7. doi: 10.1534/genetics.109.110015. [DOI] [PMC free article] [PubMed] [Google Scholar]
- Griffith LC, Ejima A. Multimodal sensory integration of courtship stimulating cues in Drosophila melanogaster. Annals of the New York Academy of Sciences. 2009;1170:394–398. doi: 10.1111/j.1749-6632.2009.04367.x. [DOI] [PMC free article] [PubMed] [Google Scholar]
- Kent C, Azanchi R, Smith B, Chu A, Levine J. A model-based analysis of chemical and temporal patterns of cuticular hydrocarbons in male Drosophila melanogaster. PLoS ONE. 2007;2:e962. doi: 10.1371/journal.pone.0000962. [DOI] [PMC free article] [PubMed] [Google Scholar]
- Kent C, Azanchi R, Smith B, Formosa A, Levine JD. Social context influences chemical communication in D. melanogaster males. Curr Biol. 2008;18:1384–1389. doi: 10.1016/j.cub.2008.07.088. [DOI] [PubMed] [Google Scholar]
- Krupp JJ, Kent C, Billeter JC, Azanchi R, So AK, Schonfeld JA, Smith BP, Lucas C, Levine JD. Social experience modifies pheromone expression and mating behavior in male Drosophila melanogaster. Curr Biol. 2008;18:1373–1383. doi: 10.1016/j.cub.2008.07.089. [DOI] [PubMed] [Google Scholar]
- Kubli E. Sex-peptides: seminal peptides of the Drosophila male. Cell Mol Life Sci. 2003;60:1689–1704. doi: 10.1007/s00018-003-3052. [DOI] [PMC free article] [PubMed] [Google Scholar]
- Larsson MC, Domingos AI, Jones WD, Chiappe ME, Amrein H, Vosshall LB. Or83b encodes a broadly expressed odorant receptor essential for Drosophila olfaction. Neuron. 2004;43:703. doi: 10.1016/j.neuron.2004.08.019. [DOI] [PubMed] [Google Scholar]
- Lee H-G, Kim Y-C, Dunning JS, Han K-A. Recurring ethanol exposure induces disinhibited courtship in Drosophila. PLoS ONE. 2008;3:e1391. doi: 10.1371/journal.pone.0001391. [DOI] [PMC free article] [PubMed] [Google Scholar]
- Lefranc A, Jeune B, Thomas-Orillard M, Danchin E. Non-independence of individuals in a population of Drosophila melanogaster: effects on spatial distribution and dispersal. Comptes Rendus de l’Academie des Sciences - Series III - Sciences de la Vie. 2001;324:219–227. doi: 10.1016/s0764-4469(00)01297-x. [DOI] [PubMed] [Google Scholar]
- Levine JD, Funes P, Dowse HB, Hall JC. Resetting the circadian clock by social experience in Drosophila melanogaster. Science. 2002;298:2010–2012. doi: 10.1126/science.1076008. [DOI] [PubMed] [Google Scholar]
- Lilly M, Kreber R, Ganetzky B, Carlson JR. Evidence that the Drosophila olfactory mutant smellblind defines a novel class of sodium channel mutation. Genetics. 1994;136:1087–1096. doi: 10.1093/genetics/136.3.1087. [DOI] [PMC free article] [PubMed] [Google Scholar]
- Liu W, Liang X, Gong J, Yang Z, Zhang YH, Zhang JX, Rao Y. Social regulation of aggression by pheromonal activation of Or65a olfactory neurons in Drosophila. Nat Neurosci. 2011;14:896–902. doi: 10.1038/nn.2836. [DOI] [PubMed] [Google Scholar]
- Lloyd VK, Sinclair DA, Alperyn M, Grigliatti TA. Enhancer of garnet/deltaAP-3 is a cryptic allele of the white gene and identifies the intracellular transport system for the white protein. Genome. 2002;45:296–312. doi: 10.1139/g01-139. [DOI] [PubMed] [Google Scholar]
- Lof M, Etienne R, Powell J, de Gee M, Hemerik L. The effect of chemical information on the spatial distribution of fruit flies: i model results. Bulletin of Mathematical Biology. 2008;70:1827–1849. doi: 10.1007/s11538-008-9327-0. [DOI] [PMC free article] [PubMed] [Google Scholar]
- Lof ME, de Gee M, Hemerik L. Odor-mediated aggregation enhances the colonization ability of Drosophila melanogaster. J Theor Biol. 2009;258:363–370. doi: 10.1016/j.jtbi.2008.08.019. [DOI] [PubMed] [Google Scholar]
- Mery F, Varela SAM, Danchin E, Blanchet S, Parejo D, Coolen I, Wagner RH. Public versus personal information for mate copying in an invertebrate. Current Biology. 2009;19:730–734. doi: 10.1016/j.cub.2009.02.064. [DOI] [PubMed] [Google Scholar]
- Miyamoto T, Amrein H. Suppression of male courtship by a Drosophila pheromone receptor. Nat Neurosci. 2008;11:874–876. doi: 10.1038/nn.2161. [DOI] [PMC free article] [PubMed] [Google Scholar]
- Mogilner A, Edelstein-Keshet L, Bent L, Spiros A. Mutual interactions, potentials, and individual distance in a social aggregation. J Math Biol. 2003;47:353–389. doi: 10.1007/s00285-003-0209-7. [DOI] [PubMed] [Google Scholar]
- Montell C. A taste of the Drosophila gustatory receptors. Curr Opin Neurobiol. 2009;19:345–353. doi: 10.1016/j.conb.2009.07.001. [DOI] [PMC free article] [PubMed] [Google Scholar]
- Navarro J, del Solar E. Pattern of spatial distribution in Drosophila melanogaster. Behavior Genetics (Historical Archive) 1975;5:9–16. doi: 10.1007/BF01067577. [DOI] [PubMed] [Google Scholar]
- Parrish JK, Edelstein-Keshet L. Complexity, pattern, and evolutionary trade-offs in animal aggregation. Science. 1999;284:99–101. doi: 10.1126/science.284.5411.99. [DOI] [PubMed] [Google Scholar]
- Rohlfs M, Hoffmeister TS. Spatial aggregation across ephemeral resource patches in insect communities: an adaptive response to natural enemies? Oecologia. 2004;140:654–661. doi: 10.1007/s00442-004-1629-9. [DOI] [PubMed] [Google Scholar]
- Romero-Calderon R, Shome RM, Simon AF, Daniels RW, DiAntonio A, Krantz DE. A screen for neurotransmitter transporters expressed in the visual system of Drosophila melanogaster identifies three novel genes. Developmental Neurobiology. 2007;67:550–569. doi: 10.1002/dneu.20342. [DOI] [PubMed] [Google Scholar]
- Simon AF, Daniels R, Romero-Calderon R, Grygoruk A, Chang H-Y, Najibi R, Shamouelian D, Salazar E, Solomon M, Ackerson LC, Maidment NT, DiAntonio A, Krantz DE. Drosophila vesicular monoamine transporter mutants can adapt to reduced or eliminated vesicular stores of dopamine and serotonin. Genetics. 2009;181:525–541. doi: 10.1534/genetics.108.094110. [DOI] [PMC free article] [PubMed] [Google Scholar]
- Simon AF, Liang DT, Krantz DE. Differential decline in behavioral performance of Drosophila melanogaster with age. Mechanisms of Ageing and Development. 2006;127:647. doi: 10.1016/j.mad.2006.02.006. [DOI] [PubMed] [Google Scholar]
- Simon AF, Shih C, Mack A, Benzer S. Steroid control of longevity in Drosophila melanogaster. Science. 2003;299:1407–1410. doi: 10.1126/science.1080539. [DOI] [PubMed] [Google Scholar]
- Simon JC, Dickinson MH. A new chamber for studying the behavior of Drosophila. PLoS One. 2010;5:e8793. doi: 10.1371/journal.pone.0008793. [DOI] [PMC free article] [PubMed] [Google Scholar]
- Slawson JB, Kim EZ, Griffith LC. High-resolution video tracking of locomotion in adult Drosophila melanogaster. J Vis Exp. 2009;24:1096. doi: 10.3791/1096. doi: 1010.3791/1096. [DOI] [PMC free article] [PubMed] [Google Scholar]
- Sokolowski MB. Social Interactions in “Simple” Model Systems. Neuron. 2010;65:780–794. doi: 10.1016/j.neuron.2010.03.007. [DOI] [PubMed] [Google Scholar]
- Stark WS, Wasserman GS. Wavelength-specific ERG characteristics of pigmented- and white-eyed strains of Drosophila. Journal of Comparative Physiology A: Neuroethology, Sensory, Neural, and Behavioral Physiology. 1974;91:427. [Google Scholar]
- Suh GSB, Wong AM, Hergarden AC, Wang JW, Simon AF, Benzer S, Axel R, Anderson DJ. A single population of olfactory sensory neurons mediates an innate avoidance behaviour in Drosophila. Nature. 2004;431:854–859. doi: 10.1038/nature02980. [DOI] [PubMed] [Google Scholar]
- Sulzer D. Multiple hit hypotheses for dopamine neuron loss in Parkinson’s disease. Trends in Neurosciences. 2007;30:244–250. doi: 10.1016/j.tins.2007.03.009. [DOI] [PubMed] [Google Scholar]
- Svetec N, Ferveur J-F. Social experience and pheromonal perception can change male-male interactions in Drosophila melanogaster. J Exp Biol. 2005;208:891–898. doi: 10.1242/jeb.01454. [DOI] [PubMed] [Google Scholar]
- Svetec N, Houot B, Ferveur JF. Effect of genes, social experience, and their interaction on the courtship behaviour of transgenic Drosophila males. Genet Res. 2005;85:183–193. doi: 10.1017/S0016672305007536. [DOI] [PubMed] [Google Scholar]
- Symonds MRE, Wertheim B. The mode of evolution of aggregation pheromones in Drosophila species. J Evol Biol. 2005;18:1253–1263. doi: 10.1111/j.1420-9101.2005.00971.x. [DOI] [PubMed] [Google Scholar]
- Tinette S, Zhang L, Garnier A, Engler G, Tares S, Robichon A. Exploratory behaviour in NO-dependent cyclase mutants of Drosophila shows defects in coincident neuronal signalling. BMC Neurosci. 2007;8:65. doi: 10.1186/1471-2202-8-65. [DOI] [PMC free article] [PubMed] [Google Scholar]
- Tinette S, Zhang L, Robichon A. Cooperation between Drosophila flies in searching behavior. Genes Brain Behav. 2004;3:39–50. doi: 10.1046/j.1601-183x.2003.0046.x. [DOI] [PubMed] [Google Scholar]
- Ueda A, Wu C-F. Effects of social isolation on neuromuscular excitability and aggressive behaviors in Drosophila: altered responses by Hk and gsts1, two mutations implicated in redox regulation. J Neurogenet. 2009 doi: 10.3109/01677060903063026. [DOI] [PMC free article] [PubMed] [Google Scholar]
- Uvarov BP. Locusts and grasshoppers. Imperial Bureau of Entomology; London: 1928. [Google Scholar]
- Valente D, Mitra PP. Analysis of the trajectory of Drosophila melanogaster in a circular open field arena. PLoS One. 2007;2:1083. doi: 10.1371/journal.pone.0001083. [DOI] [PMC free article] [PubMed] [Google Scholar]
- Villella A, Hall JC, Jeffrey CH. Advances in Genetics. Academic Press; 2008. Chapter 3 Neurogenetics of courtship and mating in Drosophila; pp. 67–184. [DOI] [PubMed] [Google Scholar]
- Wang L, Anderson DJ. Identification of an aggression-promoting pheromone and its receptor neurons in Drosophila. Nature. 2010;463:227–231. doi: 10.1038/nature08678. [DOI] [PMC free article] [PubMed] [Google Scholar]
- Wang L, Dankert H, Perona P, Anderson DJ. Inaugural Article: A common genetic target for environmental and heritable influences on aggressiveness in Drosophila. Proceedings of the National Academy of Sciences. 2008;105:5657–5663. doi: 10.1073/pnas.0801327105. [DOI] [PMC free article] [PubMed] [Google Scholar]
- Yarali A, Krischke M, Michels B, Saumweber T, Mueller MJ, Gerber B. Genetic distortion of the balance between punishment and relief learning in Drosophila. J Neurogenet. 2009;23:235–247. doi: 10.1080/01677060802441372. [DOI] [PubMed] [Google Scholar]
- Yew JY, Dreisewerd K, Luftmann H, Müthing J, Pohlentz G, Kravitz EA. A new male sex pheromone and novel cuticular cues for chemical communication in Drosophila. Current Biology. 2009;19:1245–1254. doi: 10.1016/j.cub.2009.06.037. [DOI] [PMC free article] [PubMed] [Google Scholar]
- Zhang SD, Odenwald WF. Misexpression of the white (w) gene triggers male-male courtship in Drosophila. Proceedings of the National Academy of Sciences U S A. 1995;92:5525–5529. doi: 10.1073/pnas.92.12.5525. [DOI] [PMC free article] [PubMed] [Google Scholar]
Associated Data
This section collects any data citations, data availability statements, or supplementary materials included in this article.