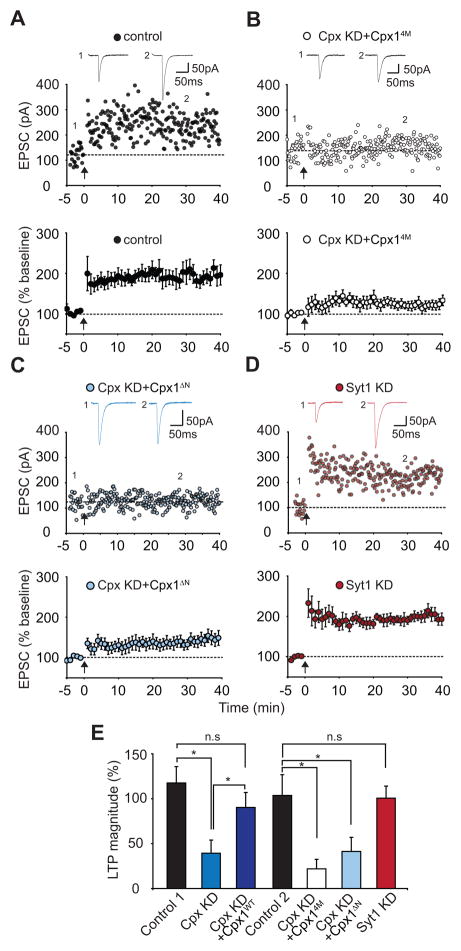
Figure 3. Postsynaptic Complexin Function in LTP Requires Its Interaction With the SNARE Complex and Its N-terminal Activation Domain.
(A) Sample experiment (top panel) and summary graph (bottom panel) of LTP in control cells that were interleaved with the complexin replacement experiments. (B) Sample experiment (top panel) and summary graph (bottom panel) of impaired LTP in Cpx KD cells expressing the Cpx14M mutant (Cpx KD+Cpx14M). (C) Sample experiment (top panel) and summary graph (bottom panel) of impaired LTP in Cpx KD cells expressing Cpx1ΔN mutant (Cpx KD+Cpx1ΔN). (D) Sample experiment (top panel) and summary graph (bottom panel) of LTP in synaptotagmin-1 knockdown (Syt1 KD) cells. (E) Summary graph of the effects of the molecular manipulations of Cpx and Syt1 on LTP. *p < 0.05. Bottom graphs in A–D and bar graphs in E represent means ± SEM.

