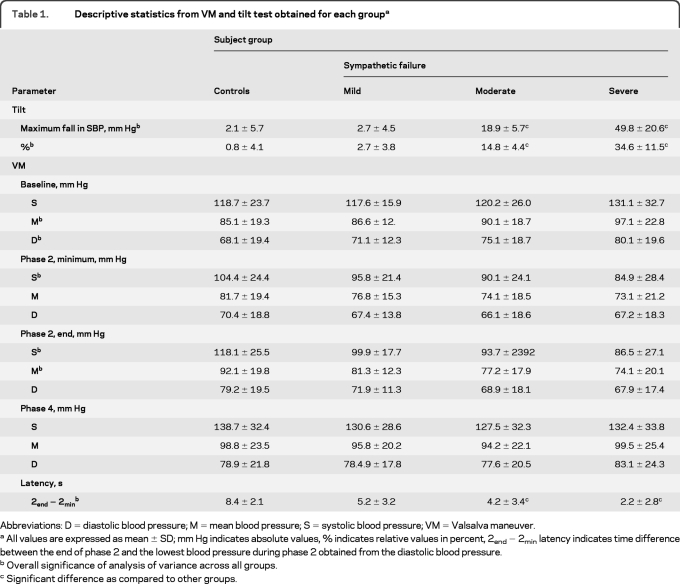
Table 1.
Descriptive statistics from VM and tilt test obtained for each groupa
Abbreviations: D = diastolic blood pressure; M = mean blood pressure; S = systolic blood pressure; VM = Valsalva maneuver.
All values are expressed as mean ± SD; mm Hg indicates absolute values, % indicates relative values in percent, 2end − 2min latency indicates time difference between the end of phase 2 and the lowest blood pressure during phase 2 obtained from the diastolic blood pressure.
Overall significance of analysis of variance across all groups.
Significant difference as compared to other groups.

