Abstract
We present a non-invasive method for estimating individual-specific cartilage maps directly from in vivo kinematic data and computed tomography (CT) volume images, and a novel algorithm for computing cartilage surface deformations. Our proposed cartilage model, a meshless incompressible height-field captures the physical properties important for estimating the shape, contact area, and deformation magnitude of cartilage at each articulation. This cartilage model can serve as an effective building block for a future forward-dynamic predictive model of the human wrist.
I. INTRODUCTION
The carpal cartilages in the wrist are among the least documented soft-tissue structures in human anatomy, impacting negatively our understanding of the many degenerative and repetitive-strain diseases afflicting this versatile joint. The reasons lie in the very versatile nature of the wrist articulation: its complexity and compactness (eight kidney-bean-sized bones) means cartilage is thinner than in other joints. Carpal cartilage is thus hard to image in vivo, although that is where its functional role in wrist kinematics would be most naturally investigated. In turn, examination in vitro requires invasive disruption of the articulation and thus results in artificially-imposed kinematics.
We introduce a non-invasive, individual-specific carpal cartilage modeling approach that allows for the in vivo exploration of cartilage functional role. We present a method for estimating individual-specific cartilage maps (location and thickness) directly from in vivo kinematic data and computed tomography (CT) volume images, and a novel algorithm for computing cartilage surface deformations. Our proposed cartilage model, a meshless incompressible height-field captures the physical properties important for estimating the shape, contact area, and deformation magnitude of cartilage at each articulation. The model is more complex and potentially more realistic than other current in vivo carpal cartilage models [1], while being faster to calculate than finite element approaches [2]. Thus our model can serve as an effective building block for a future forward-dynamic predictive model of the human wrist.
II. METHODS
Our computational approach proceeds in four steps. First, we acquire and segment CT volume images of a given individual's wrist in different kinematic poses, then recover through registration the wrist bone kinematics. Next, we use the recovered bone surfaces and kinematics to compute the space between bones during motion. We use this inter-bone space measure to define cartilage map location and thickness. Finally, we model the cartilage map as a deformable height field, and use this model to compute cartilage contact. We describe each step below.
A. Data Acquisition and Recovery of Kinematics
Our data was generated by CT-imaging the wrist bones of a young male volunteer in seven different poses (Hispeed Advantage, General Electric Medical System, scan parameters: 80kV, 80mA, image resolution 0.94 × 0.94 × 1 mm3), followed by registration of the bones across all volume-images. Each CT volume-image corresponds to an articulation pose, thus sampling the space of articulation kinematics, from wrist flexion to extension and ulnar deviation. An additional higher-resolution scan (0.31 × 0.31 × 1 mm3) was acquired in a reference neutral pose, allowing us to segment the bone surfaces with higher accuracy.
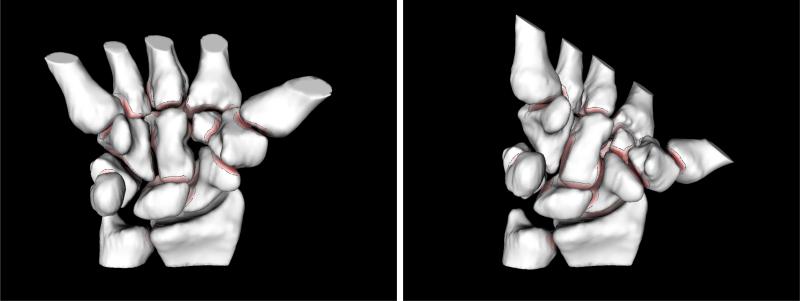
Through manual segmentation, thresholding, and user interaction, bone surfaces are extracted from the high-resolution reference CT volume image [3]. Bone surfaces are further modeled as NURBS surfaces (Raindrop GeoMagic, Research Triangle Park, NC). The resulting triangular meshes have each approximately 50,000 faces. Next, each bone surface is tracked with sub-voxel accuracy through the sequence of remaining CT volume images [4]. The tracking procedure reports relative bone-motion from one articulation pose to another. The resulting dataset consists thus of the articular-joint geometry and its sampled kinematics. Fig. 1 shows two recovered poses of our volunteer's wrist.
Fig. 1.
Modeling inter-bone joint-spacing with motion: two different poses recovered through CT-imaging, segmentation and registration of the same wrist joint (eight carpal, two forearm, and five metacarpal bones). Bones are color-mapped and contoured. The color saturation on bone surfaces indicates the distance to the nearest point on the opposite bone; darker regions are closer. Bone surfaces where the inter-bone distances are larger than a prescribed threshold (2mm) are shown in white. We trace these minimum-distance regions across multiple poses in order to estimate cartilage-map location and thickness.
B. Inter-Bone Joint-Space Modeling
Using the bone geometry and kinematics recovered as described above, we compute the inter-bone joint-space across motion. Because one of the roles of articular cartilage is friction-minimization between bones during motion, our assumption is that the minimum inter-bone joint-space should correlate with cartilage location. The inter-bone joint-spacing defines the cortical surface where bones articulate near each other; it is defined as the cortical surface area on the bone that is less than a prescribed threshold distance t(t=2mm in our experiments) from the cortical surface of a neighboring bone.
Modeling the inter-bone joint spacing requires cortical bone-to-bone distance information for multiple poses. Distance fields for each bone are computed from the reconstructed NURBS bone models using a level-set approach [5]. We use the distance fields to find distances from every vertex in the surface model of one bone to its neighbor. Using the inter-bone distance we also compute isocontours on the cortical-bone surface, each contour showing where the distance map is equal to a constant distance. The inter-bone joint-spacing is then the area of the surface triangles within the t contour.
In Fig. 1 we visualize inter-bone joint-spacing areas using color mapping and contouring. Color maps are generated for each bone so that distance values of surface points are mapped to varying color saturations (more saturated colors represent shorter distances). Distances larger than the threshold value t are neither colored nor contoured and are shown as white surfaces.
C. Cartilage Map Generation
To generate cartilage maps, we repeat the inter-bone joint-space calculation for each kinematic pose. For each cortical-surface vertex we keep track of the minimum distance value across all poses. We extrude each surface vertex by half this minimum distance plus an experimentally-determined percentage in the direction of the bone surface normal at that vertex. Vertices whose minimum distance value across all poses is larger than t are not extruded. The collection of extruded points pi and their oriented normals ni defines our height-field representation of the cartilage map.
Finally, for each pose and pair of articulating bones we keep a list of the height-field points whose original cortical-surface support vertices had a minimum distance below 2mm. These lists are used to speed up the computation of cartilage local deformation.
D. Cartilage Contact Simulation
Our cartilage model is a meshless, incompressible, deformable height-field whose initial conditions are determined as described above. While cartilage is a compressible material, the computational requirements for a multi-articular model necessitate some simplifications. Given the small deformations likely to take place in the wrist, assuming cartilage is incompressible but deformable is reasonable. Incompressibility is achieved by transferring volume from compressed locations to locations not in contact.
We resolve cartilage contact iteratively through repeated collision detection, negative displacement in the direction of the normal nj of colliding points pj, and volume preservation through positive displacement in the direction of the normal nk of the non-colliding points pk in the collision neighborhood, for each object involved in a collision. Cartilage volume is preserved by constraining each height-field response such that the integral of all displacements over the height-field is zero. In our experiments, cartilage contact was usually resolved within under 100 iterations. The height-field points in contact after resolving all collisions defines the cartilage contact area.
III. VALIDATION AND RESULTS
We validate against in vitro data the location of our kinematically-generated cartilage maps, their thickness, and the computed cartilage contact areas.
1) Cartilage location
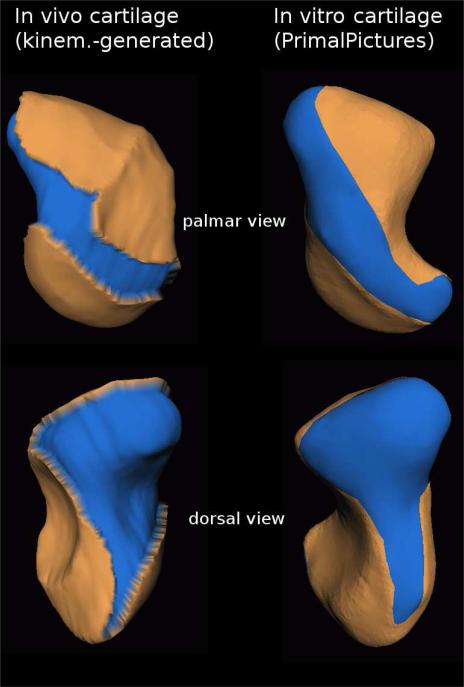
In Fig. 2 we compare the location of the in-vivo cartilage map we generated through our method for the scaphoid bone against a similar cartilage map reported in vitro (in vitro data courtesy of Primal Pictures Ltd., London, UK). Note the generally similar location-on-bone of the in vivo and in vitro cartilage-map. Despite subtle anatomical differences between the in vivo and in vitro bone-shape, note the diagonal strip cutting through cartilage in both palmar views, and the bottom sliver-cut in both dorsal views.
Fig. 2.
In vivo scaphoid cartilage map generated through our non-invasive kinematic modeling approach (left) versus a scaphoid cartilage map estimated through dissection in vitro (right). Bone is shown in blue, cartilage in tan (light-grey in grayscale reproductions); top: palmar view, bottom: dorsal view. Note the generally similar location-on-bone of the in vivo and in vitro cartilage-map. Despite subtle anatomical differences between the in vivo and in vitro bone-shape, note the diagonal strip cutting through cartilage in both palmar views, and the sliver-cut extending towards the bottom in both dorsal views. In vitro data (Primal Pictures Ltd.) does not include cartilage-map thickness.
Fig. 3 shows a similar comparison between the location of the in vivo generated cartilage map for the trapezoid bone against a trapezoid cartilage map reported in vitro (Primal Pictures Ltd.). Again, we note the similar location-on-bone of the in vivo and in vitro cartilage-map (tennis-shoe shape), despite slight anatomical differences between the in vivo and in vitro subject.
Fig. 3.
In vivo trapezoid cartilage map generated through our kinematic modeling approach (left) versus a trapezoid cartilage map estimated through dissection in vitro (right). Bone is shown in blue, cartilage in tan (light-grey in grayscale reproductions). Note the similar location-on-bone of the in vivo and in vitro cartilage-map, despite slight anatomical differences between the in vivo and in vitro subject. In vitro data (Primal Pictures Ltd.)does not include cartilage-map thickness.
We found that increasing or decreasing the t=2mm threshold influences the extent of the cartilage maps; increasing the threshold causes certain features like the diagonal palmar strip shown in Fig. 2 to disappear, while decreasing the threshold introduces holes in the cartilage map.
2) Cartilage thickness
To validate the thickness of our cartilage model, we dissected the trapezoid bone and second metacarpal from the left wrist of an unembalmed cadaver upper extremity (female, age 66 years). The trapezoid was cut in the frontal plane, yielding dorsal and volar fragments for analysis. The volar fragment of the trapezoid was immersed in barium sulfate (BaSO4) suspension (Liquid Barosperse, Lafayette Pharmaceuticals) and a 3-D volume image was made of the contrast-surrounded bone using a desktop μCT (μCT 20, Scanco Medical). The voxel size of the acquired image was 34μm3. The μCT volume image was imported into Analyze image analysis software (Biomedical Imaging Resource, Mayo Clinic, Rochester MN) and the cartilage and bone contours were segmented separately from each of the CT slice images. Triangular meshes were generated from the contours (Raindrop GeoMagic, Research Triangle Park, NC). After scanning, the bone fragment was fixed in formalin, demineralized, and embedded in paraffin. 5.0 μm sections were cut parallel to the cut, flat surface for comparison to the μCT images. Alternate sections were stained with hematoxylin and eosin, and Safranin-O/fast green. Our technique yielded high-resolution segmentable images where the cartilage was clearly distinguishable from the surrounding contrast and underlying bone tissue, based on a comparison with the histological sections. Interestingly, there was an obvious difference in shape of the μCT and histology cross-sections, attributed to nonuniform shrinkage of the tissue during histological processing. The thickness of the cartilage in the 1mm section of trapezoid evaluated in this study was relatively uniform, with an average thickness of 0.66 ± 0.14 mm (min. 0.22 mm, max. 1.07 mm).
The thickness of our in vivo cartilage model was determined by computing the average height of the kinematically-generated trapezoid undeformed height-field. The thickness of our model was also relatively uniform, with an average thickness of 0.64±0.19 mm. The results reported in Table I show remarkable correlation between the in vivo and in vitro measurements.
TABLE I.
Trapezoid Cartilage Thickness
| Trapezoid cartilage thickness | In vitro (invasively, μCT-imaged) | In vivo (non-invasively, kinem.-generated) |
|---|---|---|
| Mean ± Std.dev. | 0.66mm ± 0.14mm | 0.64mm ± 0.19mm |
| Min | 0.22mm | 0.147mm |
| Max | 1.07mm | 1.049mm |
3) Cartilage contact
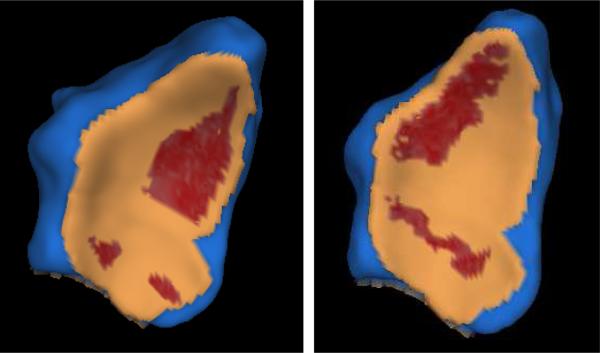
We compare the cartilage contact areas generated in vivo through our method against the in vitro pressure-film results reported by Patterson and Viegas [6] for the radius-scaphoid-lunate joint. Although our results are generated for an unloaded joint while Patterson and Viegas report (lightly) loaded joint results, we expect our results to extrapolate the loaded results in the direction of the lowest loads. In Fig. 4 we show the cartilage contact generated through our method on the radius distal surface by the lunate and scaphoid bones, in two different poses – neutral and extension. As in [6], the contact areas were localized and accounted for a relatively small fraction of the joint surface (approx. 24%). The scaphoid-radius contact-area shifted from a palmar location to a distal location as the wrist moved from the neutral pose to the extension pose, consistent with the in vitro findings of Patterson and Viegas. The in vivo radius contact area was 75 mm2 in the neutral pose and 49 mm2 in the extended pose, again in agreement with the in vitro results reported in [6].
Fig. 4.
In vivo contact area between the distal radius bone (shown) and the lunate and scaphoid bones (not shown) in a normal unloaded wrist, neutral pose and an extension pose. Bone is shown in blue, cartilage in tan, cartilage contact in red (largest area depicted corresponds to the scaphoid-radius contact). The contact areas are localized and account for a relatively small fraction of the joint surface. Note the scaphoid-radius contact-area shift from a palmar location to a distal location as the wrist moves from the neutral pose (left) to the extension pose (right).
In this experiment we used cartilage maps generated with an extra-thickness parameter value of 1%. Increasing the 1% value generated in general contact areas close to 100 mm2; such numbers would contradict the in vitro measurements of Patterson and Viegas [6], who found that for loads under 23 pounds these areas stay under 100 mm2.
IV. DISCUSSION AND CONCLUSION
The validation experiments show good correlation between our in vivo kinematically-generated cartilage maps and in vitro-observed cartilage maps. Interestingly, our cartilage thickness experiment seems to indicate that “growing” cartilage by half the inter-bone distance (as previously done by Carrigan et al. [2]) is a reasonable approach when modeling the wrist joint – larger bones in the wrist like the scaphoid do not seem to grow thicker cartilage.
Our cartilage map generation method uses two experimentally-determined parameters, the cartilage-location threshold, and the extra-thickness parameter. The 2mm threshold value seems to indicate that modeling carpal cartilage as a uniform 1mm-thick shell wrapping articular surfaces (as previously done by Thoomukuntla et al [1]) is a reasonable approach for at least certain bones like the trapezoid, although our measurements for other carpal bones indicate less uniform thicknesses. Similarly, the experimentally determined extra-thickness value of 1% may indicate that unloaded carpal cartilage is minimally compressed during motion.
Our cartilage-map generation method is limited in that it requires the acquisition of a number of poses spanning the whole space of joint kinematics. However, since our cartilage model deforms locally, missing cartilage areas are not likely to influence the contacts we compute. The correlation between minimum inter-bone distance during motion and cartilage location may have in itself strong biological implications.
Another limitation of our model is that we assume cartilage is incompressible; given the small deformations we expect to find in the unloaded wrist during motion, assuming that cartilage is incompressible but deformable is a reasonable assumption. We note that for static, loaded poses our innovative model can be easily coupled with finite element analysis to enable more sophisticated models of deformation and stress throughout the material.
In conclusion, we presented in this paper a non-invasive method for estimating carpal cartilage geometry in vivo, directly from CT-imaged bone geometry and joint kinematics. The resulting in vivo cartilage maps match well in vitro cartilage maps. We augmented the cartilage maps with a novel height-field computational model of cartilage deformation, and showed the resulting contact areas replicate carpal cartilage contact observed in vitro. The model is very fast to calculate and thus can serve as an effective building block for a future data-driven, subject-specific forward-dynamic model of the human wrist.
ACKNOWLEDGMENTS
The authors are grateful to Primal Pictures Ltd. for sharing their data. Particular thanks to Jane Casey (Brown Medical School) and Prof. Sharon Swartz (Department of Ecology and Evolutionary Biology, Brown University), for useful discussions on cartilage function. This work was supported by NSF CCR-0093238 and NIH AR44005.
Contributor Information
G. Elisabeta Marai, Computer Science Department, Brown University, Providence RI 02912, USA gem@cs.brown.edu.
Joseph J. Crisco, Orthopedics Department, Brown Medical School, Providence RI 02912, USA Joseph_Crisco@brown.edu
David H. Laidlaw, Computer Science Department, Brown University, Providence RI 02912, USA dhl@cs.brown.edu
References
- 1.Thoomukuntla BR, Pillai RR, McIff TE, Bilgen M, Ateshian GA, Fischer KJ. Validation of an MRI-Based Method for In Vivo Joint Contact Mechanics Analyses.. American Society of Mechanical Engineers Summer Bioengineering Conference; Vail CO. 2005. [Google Scholar]
- 2.Carrigan SD, Whiteside RA, Pichora DR, Small CF. Development of a Three-Dimensional Finite Element Model for Carpal Load Transmission in a Static Neutral Posture. Annals of Biomed. Eng. 2003;31:718–725. doi: 10.1114/1.1574027. [DOI] [PubMed] [Google Scholar]
- 3.Crisco JJ, McGovern RD, Wolfe SW. A non-invasive technique for measuring in vivo three-dimensional carpal bone kinematics. J. Orthopaedic Research. 1999;17(1):96–100. doi: 10.1002/jor.1100170115. [DOI] [PubMed] [Google Scholar]
- 4.Marai GE, Laidlaw DH, Crisco JJ. Super-Resolution Registration Using Tissue-Classified Distance Fields. IEEE Trans. on Medical Imaging. 2006;25(2):177–187. doi: 10.1109/TMI.2005.862151. [DOI] [PubMed] [Google Scholar]
- 5.Mauch S. A Fast Algorithm for Computing the Closest Point and Distance Transform. http://www.acm.caltech.edu/seanm/software/cpt/cpt.pdf.
- 6.Patterson RM, Viegas SF. Biomechanics of the Wrist. J. Hand Therapy. 1995;8(2):97–105. doi: 10.1016/s0894-1130(12)80306-1. [DOI] [PubMed] [Google Scholar]


