

Abstract
The interactions of elongation factor 1A (eEF1A) from Saccharomyces cerevisiae with elongation factor 1Bα (eEF1Bα), guanine nucleotides, and aminoacyl-tRNA were studied kinetically by fluorescence stopped-flow. eEF1A has similar affinities for GDP and GTP, 0.4 and 1.1 μM, respectively. Dissociation of nucleotides from eEF1A in the absence of the guanine nucleotide exchange factor is slow (about 0.1 s−1) and is accelerated by eEF1Bα by 320-fold and 250-fold for GDP and GTP, respectively. The rate constant of eEF1Bα binding to eEF1A (107–108 M−1 s−1) is independent of guanine nucleotides. At the concentrations of nucleotides and factors prevailing in the cell, the overall exchange rate is expected to be in the range of 6 s−1, which is compatible with the rate of protein synthesis in the cell. eEF1A·GTP binds Phe-tRNAPhe with a Kd of 3 nM, whereas eEF1A·GDP shows no significant binding, indicating that eEF1A has similar tRNA binding properties as its prokaryotic homolog, EF-Tu.
The eukaryotic translation elongation factor 1 (eEF1)3 comprises eEF1A and eEF1B (1). eEF1A, a 50-kDa protein homologous to prokaryotic elongation factor Tu (EF-Tu), delivers aminoacyl-tRNAs (aa-tRNAs) to the A site of the ribosome. Similarly to EF-Tu, eEF1A is a member of the GTPase superfamily and can bind GTP and GDP. The dissociation of GDP from eEF1A is accelerated by a guanine nucleotide exchange factor (GEF), eEF1B, which is composed of two subunits, eEF1Bα and eEF1Bγ, in yeast, or three subunits, eEF1Bα, eEF1Bγ, and eEF1Bβ, in mammals. eEF1Bα contains the catalytic domain necessary for nucleotide exchange and is thus the functional equivalent to the bacterial GEF of EF-Tu, EF-Ts. Although eEF1Bα and EF-Ts have the same function, the two proteins do not exhibit any significant sequence homology. While the isolated structure of the C terminus of eEF1Bα was initially reported to be similar to one domains of EF-Ts (2), the two GEFs bind their G-proteins in fundamentally different ways. eEF1Bα interacts with domains 1 and 2 of eEF1A (3), disrupting the switch 2 region of eEF1A, which forms part of the binding pocket for Mg2+ and the γ-phosphate of GTP, and inserting the highly conserved Lys205 of eEF1Bα into the Mg2+ and GDP/GTP binding sites of eEF1A. This prevents the binding of the β- and γ-phosphates to the P loop (4). The structures of the sugar- and base-binding pockets of eEF1A are mostly unperturbed by eEF1Bα, which is not the case in the EF-Tu·EF-Ts complex. EF-Ts, on the other hand, binds EF-Tu via domains I and III (5, 6). Because eEF1Bα instead interacts with domains 1 and 2 of eEF1A, the latter of which is the binding site of aa-tRNA (3), binding of eEF1Bα and aa-tRNA to eEF1A may either be mutually exclusive or either contribute to forming a binding pocket for aa-tRNA.
eEF1A from many different organisms was reported to have similar affinities for GTP and GDP, for example 0.7 μM and 1μM for GTP and GDP, respectively, as measured for eEF1A from S. cerevisiae (7). Thus, the formation of active eEF1A·GTP is thermodynamically favored by the higher intracellular concentration of GTP over GDP. In addition, the high concentration of aa-tRNA in the cell is expected to further shift the equilibrium toward the GTP-bound state due to the formation of EF-Tu·GTP·aa-tRNA, without affecting the kinetics of nucleotide exchange. However, the rate of spontaneous GDP release from eEF1A, about 0.17 s−1 (8) appears to be too slow to maintain the rate of protein synthesis, about 10 s−1 in yeast cells (9, 10), which explains the necessity for eEF1Bα. On the other hand, the rate of spontaneous GDP release from eEF1A is almost 100-fold faster than that from EF-Tu, 0.002 s−1 (11, 12), which suggests why overexpression of eEF1A allows protein synthesis in the absence of eEF1Bα in vivo (13), i.e. when at any time sufficient amounts of eEF1A·GTP are available to bind aa-tRNA, despite the slow nucleotide exchange.
By analogy to the prokaryotic EF-Tu·EF-Ts (11) and in agreement with crystallographic studies on eEF1A·eEF1Bα complexes (4), the exchange reaction is initiated by the binding of eEF1Bα to eEF1A·GDP to form the eEF1A·GDP·eEF1Bα complex, which dissociates into GDP and eEF1A·eEF1B α. Next, GTP binds to the eEF1A·eEF1Bα complex to form the intermediary eEF1A·GTP·eEF1Bα complex, which dissociates into eEF1Bα and eEF1A·GTP, thereby completing the exchange reaction (Fig. 1). Nucleotide exchange in eEF1A in the presence of eEF1Bα was suggested to be the rate-controlling step of eukaryotic translation (14). Recent rapid kinetics measurements indicated that the rate constant of eEF1B-catalyzed GDP dissociation from eEF1A is quite high, 100–200 s−1 at physiological Mg2+ concentrations (8); hence GDP release by itself does not seem to be rate-limiting for protein elongation. However, as the rate constants of all other steps are unknown, it cannot be excluded that some other step of nucleotide exchange, e.g. formation of the eEF1A·GDP·eEF1B complex or binding of GTP to the eEF1A·eEF1B complex, is rate-limiting.
FIGURE 1. Kinetic scheme of eEF1A interactions with guanine nucleotides and eEF1Bα.
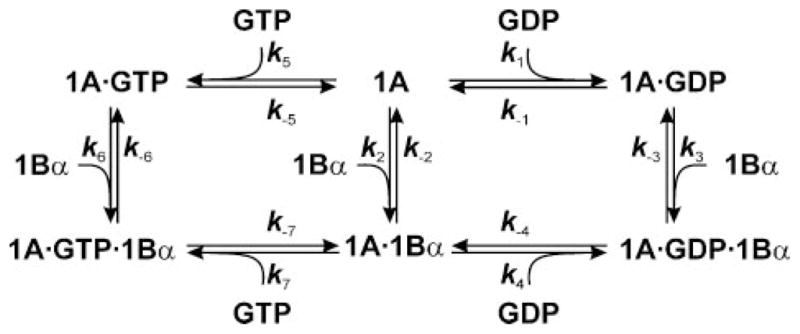
eEF1A can bind GDP (rate constant k1), GTP (k5), or eEF1Bα (k2) to form the respective binary complexes, which dissociate with the rate constants, k−1, k−5, and k−2, respectively. The binary complexes formed with either GDP or GTP bind eEF1Bα (k3 and k6) resulting in ternary complexes consisting of the two elongation factors and the respective nucleotide. The ternary complexes can dissociate by releasing either the nucleotide with the rate constants k−4 (GDP) or k−7 (GTP), or eEF1Bα with the rate constants k−3 or k−6. Finally, the eEF1A·eEF1Bα complex can bind guanine nucleotides, rate constants k4 (GDP) or k7 (GTP), or dissociate, rate constant k−2. Note that k1 to k7 are second-order association rate constants (M−1 s−1), while k−1 to k−7 are first-order dissociation rate constants (s−1).
Like prokaryotic EF-Tu, yeast eEF1A is able to bind aa-tRNA in a GTP-dependent manner and promote its binding to the mRNA-programmed 80S ribosome (15). While the ternary complex from bacteria is very well-characterized from a biochemical (11, 16–18) as well as a structural (19, 20) point of view, the available information about the corresponding eukaryotic eEF1A·GTP·aa-tRNA complex is more sparse and divergent. Notably, the existence of non-canonical mammalian eEF1A·GDP complexes with deacylated tRNA was suggested (21). The equilibrium dissociation constant, Kd, of the latter complex was estimated to 20 nM (21), a value which is comparable to that of canonical EF-Tu·GTP·aa-tRNA, and 1000 times lower than the Kd of the EF-Tu·GDP·aa-tRNA complex (16). Here we report the rate and equilibrium affinity constants of interactions among eEF1A, eEF1Bα, GDP, or GTP, and aa-tRNA, as determined by stopped-flow kinetics. Nucleotide binding/dissociation was studied using fluorescent derivatives of GDP/GTP, mant-GDP/GTP, which were shown to closely mimic unmodified guanine nucleotides in their interactions with eEF1A (8). The binding of eEF1A to eEF1Bα was monitored by fluorescence changes of intrinsic Trp residues. Binding of aa-tRNA to eEF1A was monitored using a fluorescence reporter group in Phe-tRNAPhe(Prf16/17). The combination of these observables allowed us to solve the kinetic mechanism of nucleotide exchange in eEF1A and of aa-tRNA binding to the factor, and to estimate the effective rate of the reactions at the concentrations of components prevailing in the cell.
EXPERIMENTAL PROCEDURES
Biochemical Methods
eEF1A was purified as described (22). eEF1Bα was expressed and purified by nickel chelation affinity chromatography followed by further purification on a Source-Q anion exchange column (GE Healthcare) equilibrated by 20 mM Tris-Cl, pH 7.6 and 0.5 mM dithiothreitol. eEF1Bα was eluted using a linear gradient from 120 mM to 600 mM KCl. Protein concentrations were determined both colorimetrically (Bradford Assay, Bio-Rad) and by absorbance measurements at 205, 210, and 280 nm, using an extinction coefficient (280 nm) of 44,920 M−1cm−1 for eEF1A and 20,970 M−1 cm−1 for eEF1Bα (23–25). eEF1A preparations were free of GTP or GDP as determined by HPLC analysis (26). tRNAPhe(Prf16/17) was prepared as described (27, 28). Amino-acylation was carried out with tRNAPhe(Prf16/17) (4 μM), purified yeast phenylalanyl-tRNA synthetase (3% v/v), [14C]phenylalanine (30 μM), ATP (3 mM) in buffer A (50 mM Tris-HCl pH 7.5, 70 mM NH4Cl, 30 mM KCl, 10 mM MgCl2) for 15 min at 37 °C. The extent of aminoacylation was determined by trichloroacetic acid precipitation and filtration through GF/C filters.
Rapid Kinetic Measurements
The interactions of eEF1A with guanine nucleotides and eEF1Bα were studied essentially as previously described for EF-Tu (11, 12). Fluorescence stopped-flow measurements were performed on a SX-18MV spectrometer (Applied Photophysics) in buffer A (50 mM Tris-HCl, pH 7.5, 70 mM NH4Cl, 30 mM KCl, 10 mM MgCl2) at 20 °C, if not stated otherwise. The interaction between eEF1A and eEF1Bα was monitored by changes in tryptophan fluorescence (11, 29). eEF1A contains eight tryptophan residues of which six are located in the G domain of eEF1A. Tryptophan fluorescence was excited at 280 nm and measured after passing KV335 filters (Schott). To prepare the complexes of eEF1A with the fluorescent nucleotides mant-GTP or mant-GDP, the protein was pre-incubated with a 5-fold excess of the respective nucleotide; purification of complexes from unbound nucleotides was not possible because of dissociation of unstable eEF1A·nucleotide complexes during purification. The fluorescence of mant-GDP/GTP bound to eEF1A was excited via fluorescence resonance energy transfer (FRET) from tryptophan (excitation wavelength, 280 nm) and measured after passing KV408 filters (Schott). Proflavin fluorescence was excited at 470 nm and measured after passing KV500 filter (Schott).
Stopped-flow experiments were performed by rapidly mixing equal volumes (60 μl each) of the reactants and monitoring the time course of fluorescence change. Time courses depicted in the figures were obtained by averaging 5–10 individual transients. Data were evaluated by fitting to a single exponential function with a characteristic time constant (kapp), amplitude (A), and another variable for the final signal (F∞) according to the equation where F is the fluorescence at time t. Where necessary, two exponential terms were used with two characteristic time constants (kapp1, kapp2), amplitudes (A, B), and another variable for the final signal (F8) according to the equation . Calculations were performed using Table-Curve software (Jandel Scientific) or Prism (Graphpad Soft-ware). Standard deviations were calculated using the same software.
Equilibrium Titrations
To determine the equilibrium dissociation constant (Kd) of the eEF1A·eEF1Bα complex, titrations were carried out by adding increasing amounts of eEF1Bα to a fixed amount of eEF1A (0.1 μM). The increase of the tryptophan fluorescence of eEF1A upon complex formation was measured in a PTI fluorimeter (excitation at 280 nm, emission at 333 nm). As eEF1Bα contains three tryptophan residues, a control titration was carried out in the absence of eEF1A and the resulting fluorescence signal subtracted from the signal obtained in the presence of eEF1A. The measured fluorescence was corrected for dilution. Fluorescence titrations were evaluated as described in detail in (30). The affinity of mant-GTP/ mant-GDP to eEF1A was measured at constant nucleotide concentration (0.01 μM) and increasing concentrations of eEF1A. Fluorescence emission at 448 nm was measured upon excitation at 355 nm. To determine the Kd values of the eEF1A·GTP·Phe-tRNAPhe complex, a fixed amount of Phe-tRNAPhe(Prf16/17) (0.01 μM) aminoacylated in situ (see above) was mixed with increasing amounts of eEF1A in the presence of GTP (2 mM). Fluorescence emission at 510 nm was measured upon excitation at 470 nm, and the data were treated as described above.
RESULTS
Interactions of eEF1A with GDP and GTP
Interactions of GDP and GTP with eEF1A were studied as described before (11, 12), using FRET from tryptophan residues in eEF1A to the mant group of mant-GDP or mant-GTP. The intrinsic GTPase activity of eEF1A was very low, <0.14 h−1; hence no appreciable conversion of GTP to GDP occurred during the experiments. Upon binding of labeled nucleotide, a 60% increase of mant fluorescence was observed. To determine association rate constants, a fixed concentration of nucleotide-free eEF1A was mixed with varying concentrations of fluorescent guanine nucleotides. The time curves obtained were described best by two-exponential fitting, resulting in apparent rate constants kapp1 and kapp2. Both kapp1 and kapp2 values increased with nucleotide concentration (Fig. 2B). In both cases, the concentration dependence deviated from the linear behavior expected for a second-order binding reaction. Rather, the kapp values saturated at high nucleotide concentration, suggesting that the observed fluorescence changes reported steps following the bimolecular binding step. The observed concentration dependence would be consistent with a reaction scheme A+B⇔C⇔D⇔E, where the bimolecular reaction A+B⇔C is too fast to be measured or does not result in an appreciable fluorescence change, while the first-order reactions C⇔D and D⇔E yield kapp1 and kapp2, respectively. However, the observed concentration dependence of kapp values would be equally consistent with eEF1A being heterogeneous. In such a case, a fraction of the protein would bind nucleotides faster and yield kapp1, while another fraction would be less active and give the lower kapp2; for both fractions, the kapp would reflect a monomolecular transition in the reaction scheme A+B⇔C⇔D. Because the two reaction mechanisms cannot be distinguished, and information about the second-order step is not available, the complete set of rate constants could not be calculated. Furthermore, attempts to fit the concentration dependences depicted in Fig. 2B using the values of k−1 and k−5, as well as the equilibrium dissociation constants determined below yielded satisfactory fits for both mechanisms. The values of the rate constants varied significantly depending on the assumed mechanism, and, as the mechanisms cannot be distinguished, are not reported here. Nevertheless, two qualitative statements can be made: (i) eEF1A binds to GDP and GTP in a very similar way, and (ii) structural rearrangements, rather than bimolecular binding steps, result in FRET changes.
FIGURE 2. Binding of mant-GDP/mant-GTP to eEF1A.

A, FRET change upon mixing nucleotide-free eEF1A (0.2 μM) with mant-GDP (3 μM) (1), mant-GTP (3 μM) (2) or buffer (3). B, concentration dependence of kapp1 (circles) and kapp2 (triangles) of mant-GDP (○, △) and mant-GTP (●, ▲). Values of kapp1 and kapp2 were determined by exponential fitting of time courses as in Fig. 2A. Goodness of hyperbolic fits of kapp values (R2 > 0.99 for kapp1 with GTP or GDP, 0.86 for kapp2 with GDP and 0.66 for kapp2 with GTP) was significantly better than that of linear fits (not shown; R2 > 0.92 for kapp1 with GTP or GDP, 0.65 for kapp2 with GDP and 0.30 for kapp2 with GTP); C, dissociation of eEF1A·mant-GDP (1) or eEF1A·mant-GTP (2) complexes (0.1 μM) in the presence of GDP or GTP (25 μM), respectively, or in the absence of excess unlabeled nucleotide (3). D, equilibrium titration of mant-GDP (○) or mant-GTP (●) (0.01 μM) with eEF1A.
Nucleotide dissociation rate constants were determined upon mixing eEF1A·mant-GDP or eEF1A·mant-GTP with an excess unlabeled nucleotide. The release of the labeled nucleotide from the elongation factor resulted in a fluorescence decrease, and the time courses were single-exponential. Given the complicated nucleotide binding mechanism, the observation of a single dissociation step suggests that this step is rate-limiting in nucleotide release; hence we assigned the respective values to the effective rate constants of nucleotide dissociation, k−1 and k−5. From single-exponential fitting of the time courses of Fig. 2C, the following rate constants were obtained: k−1 = 0.13 ± 0.01 s−1 (GDP), k−5 = 0.10 ± 0.01 s−1 (GTP).
Nucleotide binding affinities of eEF1A were determined by titrating mant-GTP or mant-GDP with increasing concentrations of eEF1A (“Experimental Procedures”) (Fig. 2D). From the hyperbolic fits, the values Kd = 0.4 ± 0.1 μM (GDP) and Kd = 1.1 ± 0.2 μM (GTP) were obtained. Because the detailed kinetic mechanism of nucleotide binding could not be determined, we made estimations for the effective constants of nucleotide association with eEF1A, assuming a single binding step. The resulting association rate constants were 3.3·105 M−1 s−1 (GDP) and 0.9·105 M−1 s−1 (GTP), which were assigned to the rate constants k1 and k5, respectively. Note that these rate constants, and probably also k−1 and k5, reflect effective rate constants that characterize the overall binding reaction where the individual equilibrium steps are grouped into one.
Binding of eEF1Bα to eEF1A in the Absence of Nucleotides
The association of eEF1Bα with eEF1A was monitored by the increase in intrinsic tryptophan fluorescence (Fig. 3A). Because there are eight tryptophan residues in eEF1A and three in eEF1Bα, and probably only part of them exhibits a fluorescence change upon complex formation, the amplitude of the signal change was small, but reproducible, particularly when up to 10 individual transients were averaged. To calculate the association rate constant k2, time courses were measured at a fixed concentration of eEF1A and varying eEF1Bα concentrations. Apparent rate constants were determined by exponential fitting and plotted against the eEF1Bα concentration (Fig. 3B); from the slope of the linear plot k2 = (12 ± 2) ·106 M−1 s−1 was determined, from the Y-axis intercept k−2 = 1.0 ± 0.8 s−1. To obtain a more precise estimation for k−2, we determined the equilibrium dissociation constant of eEF1A binding to eEF1Bα, and calculated k−2 from k2 and Kd. To determine Kd, a fixed amount of nucleotide-free eEF1A was titrated with eEF1Bα and tryptophan fluorescence was measured at equilibrium (Fig. 3C). Hyperbolic fitting resulted in a value of Kd = 0.16 ± 0.02 μM. Using these values, k−2 = 1.9 ± 0.4 s−1 was obtained, in agreement with the value estimated from kinetic experiments.
FIGURE 3. eEF1A·eEF1Bα interactions.

A, tryptophan fluorescence change upon mixing nucleotide-free eEF1A (0.25 μM) with eEF1Bα (0.9 μM) (1) or buffer (2). The apparent rate constant of the interaction, kapp, was determined by exponential fitting. B, concentration dependence of kapp. From the slope of the plot, the value of the bimolecular association rate constant (k2) was calculated. C, equilibrium titration of eEF1A (0.1 μM) with eEF1Bα. The relative change of the intrinsic tryptophan fluorescence (ΔF) was corrected for dilution and linear increase of free eEF1Bα fluorescence.
Interactions of eEF1A with eEF1Bα in the Presence of GDP
Dissociation of the eEF1A·mant-GDP complex after binding of eEF1Bα was monitored by the decrease of FRET from tryptophan to mant-GDP. An excess of unlabeled GDP was included with eEF1Bα to prevent rebinding of mant-GDP. Time courses of dissociation at non-saturating eEF1Bα concentrations showed two exponential phases, a faster, which reflected the dissociation of mant-GDP from the eEF1A·mant-GDP·eEF1Bα complex, and a slower, caused by the spontaneous dissociation of the eEF1A·mant-GDP complex (Fig. 4A). The apparent rate constant of mant-GDP release from the eEF1A·mant-GDP·eEF1Bα complex exhibited a hyperbolic dependence on the concentration of eEF1Bα (Fig. 4B). At low concentrations of eEF1Bα, the apparent rate constant of the dissociation of eEF1A·mant-GDP·eEF1Bα increased linearly with the concentration eEF1Bα (Fig. 4B, inset), indicating the concentration range where the binding of eEF1Bα to eEF1A·mant-GDP is rate-limiting. As rebinding of mant-GDP is negligible, the initial slope (modified from equation on p. 124 of Ref. 31) is equal to k3/(1 + k−3/k−4) = 20 ± 2 μM−1 s−1, and k3 can be calculated when k−3 and k−4 are known. At higher concentration of eEF1Bα, the dissociation of GDP from the ternary complex becomes rate-limiting, and the apparent rate constant measured at saturation with eEF1Bα yields k−4 = 42 ± 1 s−1 (Fig. 4B).
FIGURE 4. Interactions between eEF1A, eEF1Bα, and GDP.

A, dissociation of eEF1A·mant-GDP complex (0.1μM) upon addition of EF1Bα (0.7 μM) and GDP (25 μM) (1) or buffer (2) monitored by FRET. B, concentration dependence of kapp of mant-GDP dissociation from the eEF1A·mant-GDP complex in the presence of increasing eEF1Bα concentration and excess GDP (25 μM). Inset, initial slope of the curve. C, dissociation of eEF1A·eEF1Bα (0.5 μM) upon addition of GDP (25 μM) (1) or buffer (2), monitored by tryptophan fluorescence. D, dependence of kapp of eEF1A·eEF1Bα dissociation on GDP concentration. Inset, initial slope of the curve.
To determine k−3, a constant concentration of eEF1A·eEF1Bα complex was titrated with increasing concentrations of GDP and the dissociation of the binary complex detected by the decrease of the intrinsic tryptophan fluorescence (Fig. 4C). Apparent rate constants were estimated by single exponential fitting. The concentration dependence of the apparent rate constants was hyperbolic (Fig. 4D). At saturation, the dissociation of eEF1Bα is rate-limiting, thus k−3 can be determined directly, with k−3 = 117 ± 8 s−1. The initial slope was equal to k4/(1 + k−4/k−3) = 3.3 ± 0.5 μM−1 s−1, as the binding of GDP to the binary complex was rate-limiting at low GDP concentrations (Fig. 4D, inset). With the known values for k−3 and k−4 and the initial slopes for both hyperbolic curves known, the values for k3 and k4 can be calculated, k3 = 7.5·107 M−1 s−1 and k4 = 4.5·106 M−1 s−1.
Interactions of eEF1A with eEF1Bα in the Presence of GTP
The interaction of eEF1A with eEF1Bα in the presence of GTP was studied essentially in the same way as for GDP, except that the GTP solutions were preincubated with phosphoenol pyruvate and pyruvate kinase to convert any GDP present into GTP. Similarly to eEF1A·mant-GDP, the addition of eEF1Bα to eEF1A·mant-GTP resulted in a biphasic FRET decrease, with the first phase reflecting the dissociation of mant-GTP from the eEF1A·mantGTP·eEF1Bα complex, and the second reflecting the spontaneous eEF1A·mant-GTP dissociation (Fig. 5A). The dependence of the apparent rate constant of mant-GTP release on eEF1Bα concentration was hyperbolic (Fig. 5B). The rate constant of mant-GTP dissociation from the eEF1A·mantGTP·eEF1Bα determined from kapp at saturation was k−7 = 25 ± 1s−1;the initial part of the plot yielded k6/(1 + k−6/k−7) = 15 ± 1μM−1 s−1 (Fig. 5B, inset).
FIGURE 5. Interactions between eEF1A, eEF1Bα, and GTP.

A, dissociation of eEF1A·mant-GTP complex (0.1μM) upon addition of EF1Bα (0.7 μM) and GTP (25 μM) (1) or buffer (2) measured by FRET. B, eEF1Bα concentration dependence of kapp of mant-GTP dissociation from the eEF1A·mant-GTP complex in the presence of eEF1Bα as indicated and excess GDP (25 μM). Inset, initial slope of the curve. C, dissociation of eEF1A·eEF1Bα (0.5 μM) upon addition of GTP (25 μM) (1) or buffer (2), monitored by tryptophan fluorescence. D, dependence of kapp of eEF1A·eEF1Bα dissociation on GDP concentration. Inset, initial slope of the curve.
The dissociation of the eEF1A·eEF1Bα complex upon addition of GTP (Fig. 5C) was monitored by tryptophan fluorescence at varying GTP concentrations (Fig. 5D). The apparent rate constant of eEF1Bα release from eEF1A·mantGTP·eEF1Bα, as calculated by hyperbolic fitting of the concentration dependence of Fig. 5D, was k−6 = 130 ± 9 s−1, and the slope of the initial part of the plot was k7/ (1 + k−7/k−6) = 0.8 ± 0.1 μM−1 s−1. From these values, the rate constants k6 = 9.0·107 M−1 s−1 and k7 = 1.0·106 M−1 s−1 were calculated.
Comparison of the GDP and GTP Cycles
To test the consistency of the kinetic model, we compared the thermodynamic cycles of GDP and GTP exchange. As the binding of eEF1A to eEF1Bα is a step that is common to both GDP and GTP cycles, the same K2 value should arise regardless of how the value was calculated, as K2 = K5 ·K6/K7 or K2 = K1·K3/K4, and should be close to the measured K2 value (Fig. 3). Using the values in Fig. 7, identical K2 values, 0.07 μM, were calculated from the GDP and GTP cycles, which is within the statistical significance identical to the value calculated from the rate constants, 0.08 μM, and is similar to the measured Kd (0.16 μM).
FIGURE 7.
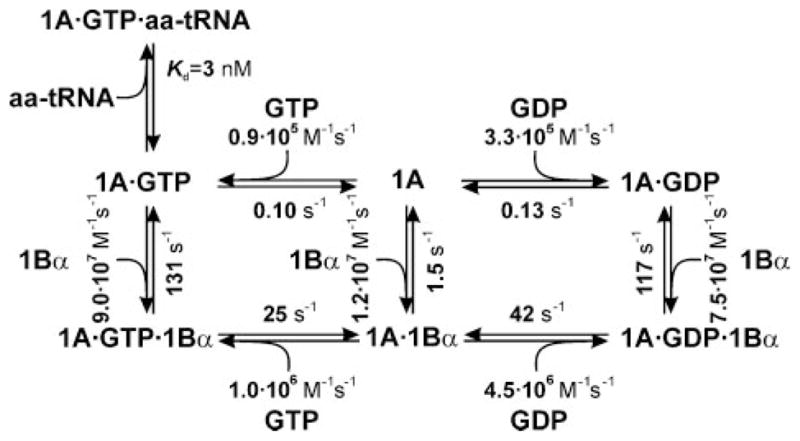
Kinetic mechanism of nucleotide exchange and aa-tRNA binding to eEF1A from S. cerevisiae.
aa-tRNA Binding
Association of aa-tRNA with eEF1A was measured utilizing the fluorescence change of yeast Phe-tRNAPhe containing a fluorescent dye, proflavin, at positions 16 or 17 in the D loop. Upon addition of eEF1A·GTP to Phe-tRNAPhe(Prf17/16), a decrease in fluorescence was observed (Fig. 6A). The apparent rate constants of association were determined by single-exponential fitting. The concentration dependence of kapp was not linear (Fig. 6B), suggesting that the fluorescence change reflected a rearrangement step following an initial rapid-equilibrium binding step, which was not accompanied by a fluorescence change. From hyperbolic fitting of the concentration dependence of kapp, a Kd1 value for the first step of 0.9 ± 0.3 μM was determined, and the forward rate constant of the second step was 5.7 ± 0.3 s−1; the value for the backward rate constant of the second step was very close to 0 (Y-axis intercept) and could not be determined with precision. The amplitudes of fluorescence changes did not change with eEF1A concentration, suggesting that the affinity of binding was <0.2 μM (the first concentration point measured). The lower limit for the bimolecular rate constant of aa-tRNA binding to eEF1A was estimated from the initial slope of the concentration dependence, about 2·106 M−1 s−1.
FIGURE 6. Binding of eEF1A to Phe-tRNAPhe.

A, time courses of Phe-tRNAPhe(Prf16/17) (0.2 μM) binding to eEF1A·GTP (1 μM); (2), control in the absence of eEF1A. B, concentration dependence of kapp of the reaction between Phe-tRNAPhe(Prf16/17) and eEF1A·GTP. C, equilibrium titrations of Phe-tRNAPhe(Prf16/17) (0.01 μM) with eEF1A·GTP.
To determine the overall affinity of Phe-tRNAPhe to eEF1A·GTP, equilibrium fluorescence titrations were performed with constant amounts of Phe-tRNAPhe(Prf16/17) and varying eEF1A concentration (Fig. 6C). The Kd value for the eEF1A·GTP·Phe-tRNAPhe complex was 3 ± 1 nM. Taking into account that the overall affinity of the two-step binding equilibrium is the product of the Kd values of each step, i.e. Kd = Kd1·k−2/k2, the k−2 value can be calculated using the values of Kd1 and k2 determined above, k−2 = 0.02 ± 0.01 s−1.
It has been reported that eukaryotic eEF1A·GDP, unlike bacterial EF-Tu·GDP, can promote the binding of aa-tRNA to the mRNA-programmed ribosome, though to a smaller extent than with GTP (32). However, given the similarity of the affinities of GTP and GDP for eEF1A, a small GTP contamination in GDP solutions would yield a certain amount of eEF1A·GTP which could bind aa-tRNA. In fact, when binding experiments were carried out with GDP solutions that did not contain any detectable GTP (33), no fluorescence change of Phe-tRNAPhe(Prf16/ 17) was observed upon addition of eEF1A·GDP up to 1 μM. This suggests that the affinity of aa-tRNA for eEF1A in the GDP form is very low, and at least 300 times lower than that for eEF1A·GTP.
Previously, mammalian eEF1A was reported to bind deacylated tRNAPhe in the presence of GDP. To test whether the yeast factor is also able to bind deacylated tRNA as suggested (21), we performed stopped-flow and fluorescence titration experiments as described above for Phe-tRNAPhe with deacylated tRNAPhe(Prf16/17) and eEF1A·GTP or eEF1A·GDP. No fluorescence change was observed, even at high concentrations of factors. Furthermore, if deacylated tRNA binds to eEF1A, it should be able to compete with Phe-tRNAPhe for the binding to the factor. However, even a large excess of deacylated tRNAPhe did not chase Phe-tRNAPhe(Prf16/17) from eEF1A, regardless of whether GTP or GDP was present. Thus, we have to conclude that deacylated tRNA most likely does not bind to yeast eEF1A to any significant extent.
DISCUSSION
Nucleotide Binding to eEF1A
eEF1A from S. cerevisiae binds GDP and GTP with similar affinities, 0.4 and 1.1 μM, respectively, in agreement with earlier reports (Kd GDP = 1 μM and Kd GTP = 0.7 μM (7); Kd = 0.18 μM for mant-GDP (8); both at somewhat different reaction conditions). The nucleotide binding properties of eEF1A differ from those of other GTPases, most notably of its prokaryotic counterpart EF-Tu (11, 12), eukaryotic initiation factor eIF2 (34), translation termination factors RF3 (35) and eRF3 (36), as well as from those of most Ras-like GTPases and the Gα subunits of heterotrimeric G-proteins, which bind GDP about 10–100 times more tightly than GTP. The intrinsic rate of GDP dissociation from EF-Tu, eIF2, RF3, or Ras-like GTPases is very slow, limiting GTP binding (11, 37, 38). However, in a number of GTPases, including translation factors IF2 (39) and its eukaryotic ortholog eIF5B (40), EF-G (33), SelB (41), eRF3 (36) or the GTPases of the signal recognition particle pathway (42, 43), the GDP-to-GTP exchange is rapid and spontaneous. Structures of EF-G and SelB crystallized in the nucleotide-free forms or with GDP or GTP bound show similar overall domain arrangement, regardless of the nucleotide (44–49), in contrast to many other GTPases that undergo a large conformational change when switching from the GTP-bound to GDP-bound form (50). Particularly striking differences are found between the three elongation factors that deliver aa-tRNA to the ribosome: while EF-Tu has a strong preference for GDP and practically does not release GDP in the absence of EF-Ts, which acts as a GEF, eEF1A has similar affinities for GTP and GDP, and SelB has a preference for GTP and does not require a GEF.
The binding of nucleotides to eEF1A entails at least two steps. The complex binding mechanism can be understood by assuming that in the absence of a nucleotide the active site of eEF1A has an “open” structure. The first step of binding probably represents a diffusion-controlled association of the nucleotide with the binding pocket. The resulting weak complex rearranges to a “closed” form of the binding pocket, which stabilizes nucleotide binding and thus increases the nucleotide affinity, and leads to a change in mant fluorescence. A similar biphasic nucleotide binding was observed with eRF3 (36), Ffh (43), and Ras (51). Spontaneous dissociation of GDP from eEF1A takes place at a rate of 0.13 s−1, in excellent agreement with the results of a recent kinetic study (0.17 s−1) (8). The rates of GTP and GDP dissociation from eEF1A are similar, which is the major difference to the nucleotide release from the prokaryotic homolog, EF-Tu, which, in the absence of EF-Ts, releases GDP more slowly (0.002 s−1) than GTP (0.03 s−1) (11, 12). This suggests that the nucleotide binding pocket in the GTP- and GDP-bound form of eEF1A, even in its “closed” form, is more open than that of EF-Tu and that the structural differences between the GTP- and GDP-bound forms of eEF1A is probably less dramatic than in the case of EF-Tu (52–54).
Nucleotide Exchange in eEF1A
In the presence of eEF1Bα, the eEF1A·GDP complex dissociates rapidly, at a maximum rate of 42 s−1 (at 10 mM Mg2+ and 20 °C). This value is again in very good agreement with the published value of 75 s−1, measured at the same Mg2+concentration and 37 °C (8). In the presence of eEF1Bα, the release of GDP and GTP is accelerated 320-fold and 250-fold, respectively, relative to the spontaneous release (Fig. 7). This is a rather modest effect, compared with the 60,000-fold acceleration of GDP dissociation from EF-Tu by EF-Ts. However, the rate of the nucleotide release from the ternary complex eEF1A·GDP·eEF1Bα is only 3-fold lower that from EF-Tu·GDP·EF-Ts (125 s−1) (11). The main difference is a much faster (65-fold) spontaneous dissociation of GDP from eEF1A compared with EF-Tu, which is also one of the main quantitative differences in the kinetic mechanisms of nucleotide exchange between eEF1A and EF-Tu. Another difference is the 30-fold lower stability of the eEF1A·eEF1Bα complex in the absence of a nucleotide compared with EF-Tu·EF-Ts, which most likely reflects the fact that the contacts in the eEF1A·eEF1Bα complex are quite different from those in EF-Tu·EF-Ts (3).
Another interesting implication of the data is that the bimolecular rate constant of eEF1Bα binding to eEF1A is largely independent of the nucleotide binding state of eEF1A. Furthermore, the rates of eEF1Bα binding to eEF1A were very similar to those of the formation of the EF-Ts·EF-Tu complex with or without nucleotides, which is remarkable, given that the GEFs are entirely unrelated in sequence. The values of the association rate constants k3 and k6 suggest a diffusion-controlled reaction, assuming the encounter frequency of 7 · 109 and a steric factor of about 0.01 (31). This would explain why the association rates are insensitive to the structure of the contact surface and are similar to those determined for other GTPase-GEF complexes such as Ran-RCC1 (55). Specific interactions in the respective protein-protein complexes are expected to affect the following rearrangements steps which were however not observed in the present study. The crystal structures indicate that binding of the eEF1Bα fragment to eEF1A, eEF1A·GDPNP, or eEF1A·GDP produced only minor changes in the relative orientations of the domains in all complexes (4). The changes in the two proteins were limited to new conformations of a few side chains surrounding the nucleotide binding site. Such small rearrangements may be very rapid and will probably not give rise to discernible kinetic steps.
Assuming that the concentrations of eEF1A and tRNAs in yeast cells are comparable, about 100 μM (56), the ratio of eEF1A to eEF1Bα is 4:1 to 3:1 (7), and GTP is present in a 10–30-fold excess over GDP, the effective rate of nucleotide exchange can be calculated for these concentrations in vivo. Even though a fraction of eEF1A is likely to be bound to actin (57) and thus may be inaccessible for eEF1Bα binding, the rate of eEF1Bα binding to eEF1A·GDP, calculated from the values of k3, k−3, and k−4 (observed rate = k3[eEF1Bα]/(1 + k−3/k−4)), is very high, because of the high concentration of eEF1Bα, and clearly not rate-limiting for the reaction. The effective dissociation rate of GDP from the ternary complex is in the range of 8–18 s−1 depending on the assumed GTP/GDP ratio (rate = k−4/[1 + (k4[GDP])/(k7[GTP])). The following step of GTP binding is very fast (>1000 s−1), because of the high intracellular concentration of GTP. The dissociation of eEF1Bα from the eEF1A·GTP·eEF1Bα complex takes place at about 13 s−1 (rate = k−6/[1 + (k6[eEF1Bα])/kaa-tRNA-binding[aa-tRNA]), which appears to be the second partially rate-limiting step of nucleotide exchange, in addition to GDP dissociation. In total, the overall rate of nucleotide exchange is expected to be in the range of about 6 s−1. The rate of protein synthesis in yeast cells is about 2.3 s−1 at doubling times characteristic for the temperature, 20 °C, used in the present experiments (58, 59), suggesting that nucleotide release is not limiting at conditions of normal growth. However, because the effective rate of eEF1Bα binding to eEF-1A·GDP linearly depends on eEF1Bα concentration, the binding step may become at least partially rate-limiting upon eEF1Bα depletion, thus decreasing the overall rate of nucleotide exchange and potentially affecting the rate of protein synthesis in the cell.
Structural and kinetic analyses of the nucleotide exchange in EF-Tu suggested that several interactions with EF-Ts contribute to nucleotide exchange. EF-Ts induces a movement of helix D of the G domain of EF-Tu that shifts residues that are involved in the stabilization of the ribose and the guanine base away from the nucleotide-binding site, thereby relaxing the interactions of those residues with the ribose and/or guanine base (5, 6). A residue in the conserved TDFV sequence motif of EF-Ts, Phe81, intrudes between switch II region and His118 of EF-Tu and disrupts the binding of the β-phosphate of GDP and shifts the position of helix B of EF-Tu and alters the position of the residues coordinating the Mg2+ ion in the EF-Tu·GDP complex. Somewhat disappointingly, the disruption of any of the putative key interactions in the EF-Tu·EF-Ts complex resulted in only small to moderate changes in the efficiency of nucleotide exchange (60–64). It is possible that in addition to the contacts indicated by crystal structures, EF-Ts binding induces many small rearrangements of EF-Tu that contribute synergistically to efficient exchange of guanine nucleotides. Recognition of eEF1A by eEF1Bα is very different from that of EF-Tu by EF-Ts (3, 4). The residues of eEF1A that interact with the base and sugar moieties of GTP are undisturbed. The structure of the Mg2+ binding site is altered by a reorganization of the switch 2 region and the insertion of Lys205 of eEF1Bα into the binding site. As a result, the interactions with the β- and γ-phosphates of GDP or GTP are disrupted, which may accelerate nucleotide release. The peptide flip in the P loop takes place in both eEF1A·eEF1Bα and EF-Tu·EF-Ts, and this makes GDP binding unfavorable (3, 6). Lys205 of eEF1Bα appears to be important for the mechanism of nucleotide exchange, and the K205A mutation is lethal due to impaired GEF function (4, 8). However, mutagenesis and kinetic studies showed that the mutation reduced the rate of GDP release from eEF1A by a factor of 13 only (at 1 mM Mg2+) (8). Likewise, removal of Mg2+ increased the rate of eEF1Bα-induced GDP dissociation no more than 6-fold (8). This suggests that, similarly to EF-Tu·EF-Ts, any contact in the eEF1A·eEF1Bα complex alone is expected to contribute moderately to the destabilization of nucleotide binding, but together they act synergistically to bring about the overall acceleration of nucleotide exchange.
The role of the nucleotide exchange co-factor, eEF1Bγ, is not clear. eEF1Bγ by itself has no measurable exchange activity, but has a small positive effect on nucleotide exchange in the complex with eEF1Bα, i.e. it increases the rate of GDP dissociation from yeast eEF1A in the presence of eEF1Bα by a factor of two (7), or from Artemia eEF1A by a factor of 1.6 (14). However, eEF-1γ contains a hydrophobic tail and appears to have an affinity toward membrane and cytoskeletal elements (65) and RNA (66), and could thereby contribute to the anchoring of mRNAs and translation components in the vicinity of cytoskeleton- or membrane-bound ribosomes (67). In addition, loss of the two yeast genes encoding eEF1Bγ results in constitutive resistance to oxidative stress(68)This may indicate that the activity of the eEF1B complex responds to stress, which remains to be determined.
eEF1A Interaction with aa-tRNA
Yeast eEF1A·GTP binds aa-tRNA very tightly, with nanomolar affinity. This suggests that the local conformation of eEF1A at the aa-tRNA binding pocket is sufficiently different for aa-tRNA to select between the GTP- and the GDP form, despite the similar affinities of eEF1A binding to GTP and GDP. Although gross rearrangements in the eEF1A·eEF1Bα complex were not observed upon binding of different nucleotides (4), conformational changes that may occur in the absence of eEF1Bα cannot be excluded. In this respect, yeast eEF1A seems to be quite similar to its pro-karyotic homolog EF-Tu.
Acknowledgments
We thank Carmen Schillings, Astrid Böhm, Simone Möbitz, and Petra Striebeck for expert technical assistance.
Footnotes
The work was supported by the Deutsche Forschungsgemeinschaft (to M. V. R.) and National Institutes of Health Grant R01 GM57483 (to T. G. K.).
The abbreviations used are: eEF, eukaryotic elongation factor; EF-Tu, elongation factor Tu; EF-Ts, elongation factor Ts; GEF, guanine nucleotide exchange factor; aa-tRNA, aminoacyl-tRNA; mant-GDP/GTP, (2′/3′-O(N-methyl-anthraniloyl-GDP/GTP); Prf, proflavin.
References
- 1.Merrick WC, Nyborg J. In: Translational Control of Gene Expression. Sonenberg N, Hershey JWB, Mathews MB, editors. Cold Spring Harbor Laboratory; Cold Spring Harbor, NY: 2000. pp. 89–126. [Google Scholar]
- 2.Perez JM, Siegal G, Kriek J, Hard K, Dijk J, Canters GW, Moller W. Structure. 1999;7:217–226. doi: 10.1016/s0969-2126(99)80027-6. [DOI] [PubMed] [Google Scholar]
- 3.Andersen GR, Pedersen L, Valente L, Chatterjee I, Kinzy TG, Kjeldgaard M, Nyborg J. Mol Cell. 2000;6:1261–1266. doi: 10.1016/s1097-2765(00)00122-2. [DOI] [PubMed] [Google Scholar]
- 4.Andersen GR, Valente L, Pedersen L, Kinzy TG, Nyborg J. Nat Struct Biol. 2001;8:531–534. doi: 10.1038/88598. [DOI] [PubMed] [Google Scholar]
- 5.Kawashima T, Berthet-Colominas C, Wulff M, Cusack S, Leberman R. Nature. 1996;379:511–518. doi: 10.1038/379511a0. [DOI] [PubMed] [Google Scholar]
- 6.Wang Y, Jiang YX, Meyering-Voss M, Sprinzl M, Sigler PB. Nat Struct Biol. 1997;4:650–656. doi: 10.1038/nsb0897-650. [DOI] [PubMed] [Google Scholar]
- 7.Saha SK, Chakraburtty K. J Biol Chem. 1986;261:12599–12603. [PubMed] [Google Scholar]
- 8.Pittman YR, Valente L, Jeppesen MG, Andersen GR, Patel S, Kinzy TG. J Biol Chem. 2006;281:19457–19468. doi: 10.1074/jbc.M601076200. [DOI] [PubMed] [Google Scholar]
- 9.Boehlke KW, Friesen JD. J Bacteriol. 1975;121:429–433. doi: 10.1128/jb.121.2.429-433.1975. [DOI] [PMC free article] [PubMed] [Google Scholar]
- 10.Bonven B, Gullov K. Mol Gen Genet. 1979;170:225–230. doi: 10.1007/BF00337800. [DOI] [PubMed] [Google Scholar]
- 11.Gromadski KB, Wieden HJ, Rodnina MV. Biochemistry. 2002;41:162–169. doi: 10.1021/bi015712w. [DOI] [PubMed] [Google Scholar]
- 12.Wagner A, Simon I, Sprinzl M, Goody RS. Biochemistry. 1995;34:12535–12542. doi: 10.1021/bi00039a007. [DOI] [PubMed] [Google Scholar]
- 13.Kinzy TG, Woolford JL., Jr Genetics. 1995;141:481–489. doi: 10.1093/genetics/141.2.481. [DOI] [PMC free article] [PubMed] [Google Scholar]
- 14.Janssen GM, Möller W. J Biol Chem. 1988;263:1773–1778. [PubMed] [Google Scholar]
- 15.Richter D. Biochem Biophys Res Commun. 1970;38:864–870. doi: 10.1016/0006-291x(70)90800-4. [DOI] [PubMed] [Google Scholar]
- 16.Dell VA, Miller DL, Johnson AE. Biochemistry. 1990;29:1757–1763. doi: 10.1021/bi00459a014. [DOI] [PubMed] [Google Scholar]
- 17.Clark BF, Nyborg J. Curr Opin Struct Biol. 1997;7:110–116. doi: 10.1016/s0959-440x(97)80014-0. [DOI] [PubMed] [Google Scholar]
- 18.Dale T, Sanderson LE, Uhlenbeck OC. Biochemistry. 2004;43:6159–6166. doi: 10.1021/bi036290o. [DOI] [PubMed] [Google Scholar]
- 19.Nissen P, Kjeldgaard M, Thirup S, Polekhina G, Reshetnikova L, Clark BF, Nyborg J. Science. 1995;270:1464–1472. doi: 10.1126/science.270.5241.1464. [DOI] [PubMed] [Google Scholar]
- 20.Nissen P, Thirup S, Kjeldgaard M, Nyborg J. Structure. 1999;7:143–156. doi: 10.1016/s0969-2126(99)80021-5. [DOI] [PubMed] [Google Scholar]
- 21.Petrushenko ZM, Budkevich TV, Shalak VF, Negrutskii BS, El’skaya AV. Eur J Biochem. 2002;269:4811–4818. doi: 10.1046/j.1432-1033.2002.03178.x. [DOI] [PubMed] [Google Scholar]
- 22.Pedersen L, Andersen GR, Knudsen CR, Kinzy TG, Nyborg J. Acta Crystallogr D Biol Crystallogr. 2001;57:159–161. doi: 10.1107/s0907444900015559. [DOI] [PubMed] [Google Scholar]
- 23.Gasteiger E, Gattiker A, Hoogland C, Ivanyi I, Appel RD, Bairoch A. Nucleic Acids Res. 2003;31:3784–3788. doi: 10.1093/nar/gkg563. [DOI] [PMC free article] [PubMed] [Google Scholar]
- 24.Tombs MP, Souter F, Maclagan NF. Biochem J. 1959;73:167–171. doi: 10.1042/bj0730167. [DOI] [PMC free article] [PubMed] [Google Scholar]
- 25.Scopes RK. Anal Biochem. 1974;59:277–282. doi: 10.1016/0003-2697(74)90034-7. [DOI] [PubMed] [Google Scholar]
- 26.Hemsath L, Ahmadian MR. Methods. 2005;37:173–182. doi: 10.1016/j.ymeth.2005.05.014. [DOI] [PubMed] [Google Scholar]
- 27.Wintermeyer W, Zachau HG. Methods Enzymol. 1974;29:667–673. doi: 10.1016/0076-6879(74)29058-x. [DOI] [PubMed] [Google Scholar]
- 28.Rodnina MV, Fricke R, Wintermeyer W. Biochemistry. 1994;33:12267–12275. doi: 10.1021/bi00206a033. [DOI] [PubMed] [Google Scholar]
- 29.Jameson DM, Gratton E, Eccleston JF. Biochemistry. 1987;26:3894–3901. doi: 10.1021/bi00387a023. [DOI] [PubMed] [Google Scholar]
- 30.Rodnina MV, Pape T, Fricke R, Kuhn L, Wintermeyer W. J Biol Chem. 1996;271:646–652. doi: 10.1074/jbc.271.2.646. [DOI] [PubMed] [Google Scholar]
- 31.Fersht A. Structure and Mechanism in Protein Science. W. H. Freeman and Company; New York: 1999. [Google Scholar]
- 32.Crechet JB, Parmeggiani A. Eur J Biochem. 1986;161:647–653. doi: 10.1111/j.1432-1033.1986.tb10489.x. [DOI] [PubMed] [Google Scholar]
- 33.Wilden B, Savelsbergh A, Rodnina MV, Wintermeyer W. Proc Natl Acad Sci U S A. 2006;103:13670–13675. doi: 10.1073/pnas.0606099103. [DOI] [PMC free article] [PubMed] [Google Scholar]
- 34.Kapp LD, Lorsch JR. J Mol Biol. 2004;335:923–936. doi: 10.1016/j.jmb.2003.11.025. [DOI] [PubMed] [Google Scholar]
- 35.Gao H, Zhou Z, Rawat U, Huang C, Bouakaz L, Wang C, Cheng Z, Liu Y, Zavialov A, Gursky R, Sanyal S, Ehrenberg M, Frank J, Song H. Cell. 2007;129:929–941. doi: 10.1016/j.cell.2007.03.050. [DOI] [PubMed] [Google Scholar]
- 36.Pisareva VP, Pisarev AV, Hellen CU, Rodnina MV, Pestova TV. J Biol Chem. 2006;281:40224–40235. doi: 10.1074/jbc.M607461200. [DOI] [PubMed] [Google Scholar]
- 37.Rensland H, John J, Linke R, Simon I, Schlichting I, Wittinghofer A, Goody RS. Biochemistry. 1995;34:593–599. doi: 10.1021/bi00002a026. [DOI] [PubMed] [Google Scholar]
- 38.Zavialov AV, Buckingham RH, Ehrenberg M. Cell. 2001;107:115–124. doi: 10.1016/s0092-8674(01)00508-6. [DOI] [PubMed] [Google Scholar]
- 39.Milon P, Tischenko E, Tomsic J, Caserta E, Folkers G, La Teana A, Rodnina MV, Pon CL, Boelens R, Gualerzi CO. Proc Natl Acad Sci U S A. 2006;103:13962–13967. doi: 10.1073/pnas.0606384103. [DOI] [PMC free article] [PubMed] [Google Scholar]
- 40.Pisareva VP, Hellen CU, Pestova TV. Biochemistry. 2007;46:2622–2629. doi: 10.1021/bi062134g. [DOI] [PubMed] [Google Scholar]
- 41.Thanbichler M, Böck A, Goody RS. J Biol Chem. 2000;275:20458–20466. doi: 10.1074/jbc.M002496200. [DOI] [PubMed] [Google Scholar]
- 42.Jagath JR, Rodnina MV, Lentzen G, Wintermeyer W. Biochemistry. 1998;37:15408–15413. doi: 10.1021/bi981523a. [DOI] [PubMed] [Google Scholar]
- 43.Moser C, Mol O, Goody RS, Sinning I. Proc Natl Acad Sci U S A. 1997;94:11339–11344. doi: 10.1073/pnas.94.21.11339. [DOI] [PMC free article] [PubMed] [Google Scholar]
- 44.Leibundgut M, Frick C, Thanbichler M, Bock A, Ban N. EMBO J. 2005;24:11–22. doi: 10.1038/sj.emboj.7600505. [DOI] [PMC free article] [PubMed] [Google Scholar]
- 45.Hansson S, Singh R, Gudkov AT, Liljas A, Logan DT. FEBS Lett. 2005;579:4492–4497. doi: 10.1016/j.febslet.2005.07.016. [DOI] [PubMed] [Google Scholar]
- 46.al-Karadaghi S, Aevarsson A, Garber M, Zheltonosova J, Liljas A. Structure. 1996;4:555–565. doi: 10.1016/s0969-2126(96)00061-5. [DOI] [PubMed] [Google Scholar]
- 47.Laurberg M, Kristensen O, Martemyanov K, Gudkov AT, Nagaev I, Hughes D, Liljas A. J Mol Biol. 2000;303:593–603. doi: 10.1006/jmbi.2000.4168. [DOI] [PubMed] [Google Scholar]
- 48.Czworkowski J, Wang J, Steitz TA, Moore PB. EMBO J. 1994;13:3661–3668. doi: 10.1002/j.1460-2075.1994.tb06675.x. [DOI] [PMC free article] [PubMed] [Google Scholar]
- 49.Czworkowski J, Moore PB. Biochemistry. 1997;36:10327–10334. doi: 10.1021/bi970610k. [DOI] [PubMed] [Google Scholar]
- 50.Vetter IR, Wittinghofer A. Science. 2001;294:1299–1304. doi: 10.1126/science.1062023. [DOI] [PubMed] [Google Scholar]
- 51.John J, Sohmen R, Feuerstein J, Linke R, Wittinghofer A, Goody RS. Biochemistry. 1990;29:6058–6065. doi: 10.1021/bi00477a025. [DOI] [PubMed] [Google Scholar]
- 52.Berchtold H, Reshetnikova L, Reiser CO, Schirmer NK, Sprinzl M, Hilgenfeld R. Nature. 1993;365:126–132. doi: 10.1038/365126a0. [DOI] [PubMed] [Google Scholar]
- 53.Abel K, Yoder MD, Hilgenfeld R, Jurnak F. Structure. 1996;4:1153–1159. doi: 10.1016/s0969-2126(96)00123-2. [DOI] [PubMed] [Google Scholar]
- 54.Polekhina G, Thirup S, Kjeldgaard M, Nissen P, Lippmann C, Nyborg J. Structure. 1996;4:1141–1151. doi: 10.1016/s0969-2126(96)00122-0. [DOI] [PubMed] [Google Scholar]
- 55.Klebe C, Prinz H, Wittinghofer A, Goody RS. Biochemistry. 1995;34:12543–12552. doi: 10.1021/bi00039a008. [DOI] [PubMed] [Google Scholar]
- 56.Ikemura T. J Mol Biol. 1982;158:573–597. doi: 10.1016/0022-2836(82)90250-9. [DOI] [PubMed] [Google Scholar]
- 57.Liu G, Tang J, Edmonds BT, Murray J, Levin S, Condeelis J. J Cell Biol. 1996;135:953–963. doi: 10.1083/jcb.135.4.953. [DOI] [PMC free article] [PubMed] [Google Scholar]
- 58.Waldron C, Lacroute F. J Bacteriol. 1975;122:855–865. doi: 10.1128/jb.122.3.855-865.1975. [DOI] [PMC free article] [PubMed] [Google Scholar]
- 59.Jagadish MN, Carter BL. J Cell Sci. 1978;31:71–78. doi: 10.1242/jcs.31.1.71. [DOI] [PubMed] [Google Scholar]
- 60.Schümmer T, Gromadski KB, Rodnina MV. Biochemistry. 2007;46:4977–4984. doi: 10.1021/bi602486c. [DOI] [PubMed] [Google Scholar]
- 61.Dahl LD, Wieden HJ, Rodnina MV, Knudsen CR. J Biol Chem. 2006;281:21139–21146. doi: 10.1074/jbc.M602068200. [DOI] [PubMed] [Google Scholar]
- 62.Zhang Y, Li X, Spremulli LL. FEBS Lett. 1996;391:330–332. doi: 10.1016/0014-5793(96)00789-2. [DOI] [PubMed] [Google Scholar]
- 63.Zhang Y, Yu NJ, Spremulli LL. J Biol Chem. 1998;273:4556–4562. doi: 10.1074/jbc.273.8.4556. [DOI] [PubMed] [Google Scholar]
- 64.Wieden HJ, Gromadski K, Rodnin D, Rodnina MV. J Biol Chem. 2002;277:6032–6036. doi: 10.1074/jbc.M110888200. [DOI] [PubMed] [Google Scholar]
- 65.Janssen GM, Moller W. Eur J Biochem. 1988;171:119–129. doi: 10.1111/j.1432-1033.1988.tb13766.x. [DOI] [PubMed] [Google Scholar]
- 66.Al-Maghrebi M, Brule H, Padkina M, Allen C, Holmes WM, Zehner ZE. Nucleic Acids Res. 2002;30:5017–5028. doi: 10.1093/nar/gkf656. [DOI] [PMC free article] [PubMed] [Google Scholar]
- 67.Sanders J, Brandsma M, Janssen GM, Dijk J, Moller W. J Cell Sci. 1996;109:1113–1117. doi: 10.1242/jcs.109.5.1113. [DOI] [PubMed] [Google Scholar]
- 68.Olarewaju O, Ortiz PA, Chowdhury WQ, Chatterjee I, Kinzy TG. RNA Biol. 2004;1:89–94. doi: 10.4161/rna.1.2.1033. [DOI] [PubMed] [Google Scholar]