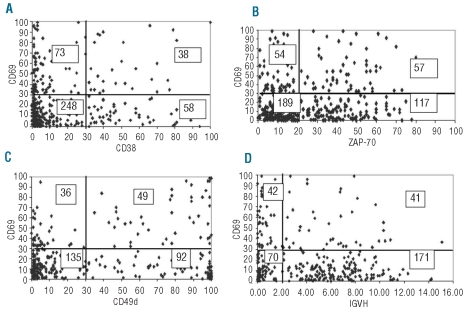
Figure 2.
Bi-variant plots for CD69 and CD38 or ZAP-70 or CD49d or IGHV. y axis reports values for CD69 and x axis values for (A) CD38, (B) ZAP-70, (C) CD49d and (D) IGHV mutations, measured as percentage of positive cells (CD69, CD38, ZAP-70, CD49d) or percentage mutations (IGHV). Number of cases expressing concordant and discordant profiles are reported within each quadrant of the plots.

