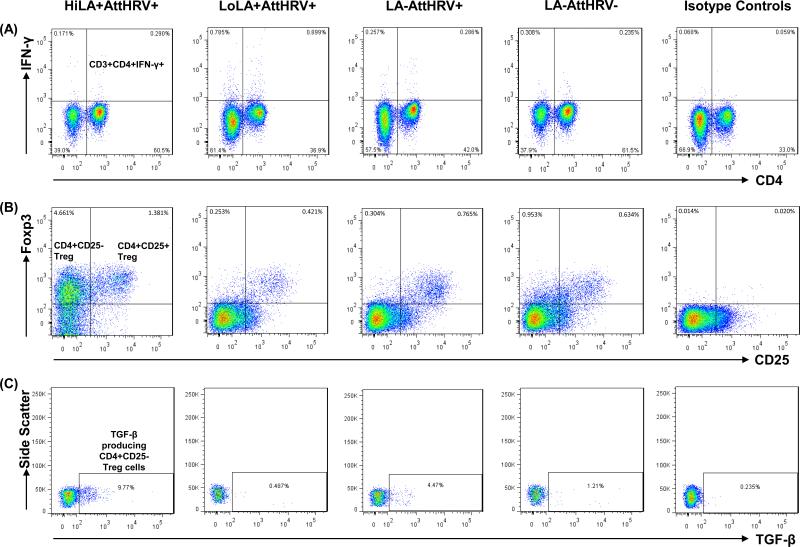
Fig. 1. Representatives of IFN-γ producing CD3+CD4+ T cells, CD4+CD25+ and CD4+CD25- Treg cells and TGF-β producing CD4+CD25- Treg cells in spleen of Gn pigs fed high or low dose LA, vaccinated with AttHRV and challenged with VirHRV at PID35/PCD7.
MNCs were isolated from pigs infected with high dose LA plus AttHRV (HiLA+AttHRV+), low dose LA plus AttHRV (LoLA+AttHRV+), AttHRV only (LA-AttHRV+), or mock-inoculated controls (LA-AttHRV-). A representative dot plot was shown for each inoculation group and isotype control staining. The numbers at the upper right corners of dot plots of panel (A) are the frequencies of HRV-specific IFN-γ+CD4+ T cells among CD3+ T cells. The numbers at the upper left and right corners of dot plots of panel (B) are the frequencies of CD4+CD25-FoxP3+ Treg cells and CD4+CD25+FoxP3+ Treg cells among MNCs, respectively. The numbers in the rectangles in dot plots of panel (C) are the frequencies of TGF-β+ cells among CD4+CD25-FoxP3+ Treg cells. The data were summarized by subtracting the frequencies of non-specific cross-reaction shown in the isotype control staining from the frequencies of samples.

