

Abstract
AIMS
The purpose of this work was to support the prediction of a potentially effective dose for the CETP-inhibitor, BAY 60–5521, in humans.
METHODS
A combination of allometric scaling of the pharmacokinetics of the CETP-inhibitor BAY 60–5521 with pharmacodynamic studies in CETP-transgenic mice and in human plasma with physiologically-based pharmacokinetic (PBPK) modelling was used to support the selection of the first-in-man dose.
RESULTS
The PBPK approach predicts a greater extent of distribution for BAY 60–5521 in humans compared with the allometric scaling method as reflected by a larger predicted volume of distribution and longer elimination half-life. The combined approach led to an estimate of a potentially effective dose for BAY 60–5521 of 51 mg in humans.
CONCLUSION
The approach described in this paper supported the prediction of a potentially effective dose for the CETP-inhibitor BAY 60–5521 in humans. Confirmation of the dose estimate was obtained in a first-in-man study.
Keywords: cholesteryl ester transfer protein, inhibition, modelling, pharmacodynamics, pharmacokinetics, scaling
WHAT IS ALREADY KNOWN ABOUT THIS SUBJECT
Cholesteryl ester transfer protein (CETP) is a plasma glycoprotein that facilitates the transfer of cholesteryl esters from the atheroprotective high density lipoprotein (HDL) to the proatherogenic low density lipoprotein cholesterol (LDL) and very low density lipoprotein cholesterol (VLDL) leading to lower concentrations of HDL but raising the concentrations of proatherogenic LDL and VLDL. Inhibition of CETP is considered a potential approach to treat dyslipidaemia.
WHAT THIS STUDY ADDS
The study provides information on preclinical pharmacokinetics (PK) and pharmacodynamics (PD) as well as information on physiologically-based pharmacokinetic modelling of a novel inhibitor of CETP, BAY 60–5521, as an approach to support the prediction of a potentially effective dose in humans.
Introduction
Preclinical pharmacokinetic (PK) studies aim to characterize the absorption and disposition of a new chemical entity in animals. In addition, these preclinical studies should also be helpful to estimate its likely pharmacokinetic behaviour in man. Such understanding is a prerequisite for the successful conduction of the first clinical study. However, extrapolations from animal pharmacokinetic data to man often remain speculative. Therefore, consideration of physiological or pathophysiological processes that may impact on the pharmacokinetic profile is important to add rationale to the extrapolation of the pharmacokinetic profile in humans. Various methods and approaches address the prediction of human pharmacokinetics from preclinical data in animals such as allometric scaling, species scaling by adjusting for maximum life span potential, incorporating differences in metabolic clearance or clearance by hepatic uptake as reviewed elsewhere [1–5]. PK/pharmacodynamic (PD) modelling and simulation has been increasingly used recently at various stages of drug development [6–8].
In this paper, we describe the use of a combination of allometric dose-scaling of BAY 60–5521, a potent inhibitor of cholesteryl ester transfer protein (CETP) with pharmacodynamic studies in CETP-transgenic mice and in human plasma with physiologically-based pharmacokinetic (PBPK) modelling to predict an effective dose in terms of HDL increase in humans.
CETP is a plasma glycoprotein that mediates the transfer of cholesterol esters from the cardioprotective HDL to the proatherogenic low density lipoprotein cholesterol (LDL) and very low density lipoprotein cholesterol (VLDL) leading to lower concentrations of HDL while raising the concentrations of proatherogenic LDL and VLDL. On the other hand, CETP transfers triglycerides (TG) from VLDL or LDL to HDL leading to TG-enriched HDL which is more readily hydrolyzed by hepatic lipase resulting in smaller-sized HDL particles that more effectively promote reverse cholesterol transport [9]. Thus, CETP inhibitors might be a powerful tool for increasing HDL, decreasing LDL and reducing the development of atherosclerosis [10].
Currently there are several compounds under investigation in preclinical or clinical studies [11–14]. The synthesis of novel tetrahydrochinoline derived CETP-inhibitors has been described recently [15]. BAY 60–5521 was tested in an early clinical study in humans and proved to be clinically safe and well tolerated in this first-in man study demonstrating clear pharmacodynamic effects on CETP-inhibition and HDL [16].
Methods
Pharmacokinetic studies in vivo
All animal studies were approved by the competent authority for labour protection, occupational health and technical safety and were performed in accordance with the ethical guidelines of Bayer Schering Pharma AG.
Pharmacokinetic studies were performed in male NMRI mice, male CETP transgenic mice [17] (weight, 18 to 25 g, n = 2–3 per time point), male Wistar rats (weight, 175 to 225 g, n = 3), and female beagle dogs (weight, 9 to 11 kg, n = 3). For the studies in mice and rats, the compound was dissolved in 10% ethanol, 10% Solutol HS15, and 80% water (v/v/v). The concentration of the solution was between 0.5 and 1 mg ml−1. A volume of 2 ml kg−1 was administered to the mice and the rats. For the dogs, the volume was 0.5 ml kg−1. The formulation of the test compound was given as a single i.v. administration via a caudal vein (mice and rats) or a cephalic vein (dog). The i.v. doses were given either as a bolus injection (mice and rats) or as a short infusion over 5 min (dogs). For oral administration, a stomach tube system was used. The compound was dissolved in 10% ethanol, 10% Solutol HS15 and 80% water (v/v/v). The application volume was 2.5 ml kg−1.
Sampling schemes were as follows: mouse i.v. studies: 0.033, 0.083, 0.167, 0.5, 1, 2, 4, 7, 16 and 24 h. For i.v. studies in rats, the sampling scheme was 0.033, 0.083, 0.167, 0.5, 1, 2, 4, 7 and 24 h. In dogs, the i.v. sampling scheme was 0.083, 0.167, 0.25, 0.333, 0.5, 0.667, 1, 2, 3, 4, 7 and 24 h. The sampling scheme for p.o. studies in rats was 0.167, 0.333, 0.667, 1, 2, 4, 7 and 24 h and for dogs 0.167, 0.333, 0.667, 1, 2, 4, 7, 24 and 30 h.
For the rats, blood samples were drawn from the right jugular vein through an implanted cannula over the observational period while the rats were conscious. For the mice, blood was obtained by exsanguination while the mice were under anaesthesia. For the dogs, blood samples were obtained from a punctured jugular vein while the dogs were conscious. The blood was collected and placed into heparinized syringes or vials. Plasma was obtained by centrifugation of blood samples.
Bioanalysis and pharmacokinetic data analysis
The plasma was stored below −15°C before further analysis. BAY 60–5521 plasma concentrations were determined after protein precipitation by a fully validated assay using liquid chromatography coupled with a tandem mass spectrometer (HPLC-MS/MS). A structural analogue of BAY 60–5521 was used as internal standard. The validated working range was from 0.500 µg l−1 (the lower limit of quantification, LLOQ) to 500 µg l−1. Inter-day accuracy and precision of the assay were equal to 97.5–103.9% and 1.20–10.1%, respectively. BAY 60–5521 concentrations in plasma were unchanged after three freeze-thaw cycles and stability after storage at −15°C could be demonstrated for at least 2 months. Quality control (QC) samples (0.500 to 4000 µg l−1) were analyzed together with study samples.
Chromatograms of lithium heparin blank plasma samples did not reveal any relevant peak interfering with the peak of BAY 60–5521.
Plasma concentration vs. time data were evaluated using non-compartmental techniques (Kincalc software for PC, Bayer AG). Maximum plasma concentrations (Cmax) and the time needed to reach these concentrations (tmax) were assessed by inspection of the concentration vs. time plots. Area under the concentration vs. time curve (AUC) was calculated using the log-linear trapezoidal rule up to the last time point with a concentration above LLOQ (tlast) plus the extrapolated portion (AUC(tlast,∞)). Whenever a reasonable estimation of the terminal half-life was not possible, the AUC(0,tlast) was used instead. Apparent oral clearance (CL/F) was obtained by dividing dose by AUC. Exposure parameters were normalized to dose (Cmax/D and AUC/D) and dose per body weight (Cmax,norm and AUCnorm).
Allometric scaling
The allometric scaling (correlation with body weight) of the pharmacokinetic parameters was performed as described by Boxenbaum [2]. After logarithmic/logarithmic transformation, the parameters were fitted to the equation y = a × BWb, where BW is body weight and a and b are the allometric coefficient and the allometric exponent, respectively.
Protein binding assays
The level of protein binding of BAY 60–5521 to plasma proteins was determined by the erythrocyte partitioning method described by Schuhmacher et al. [18].
In vitro clearance determinations with hepatocytes
Incubations with hepatocytes were performed at 37°C in a total volume of 1.5 ml using a modified Janus® robotic system (Perkin Elmer). The incubation mixtures contained 1mio viable cells ml−1, ∼1 µm substrate and 0.05 m potassium phosphate buffer (pH = 7.4). The final CAN concentration was ≤1%.
Aliquots of 125 µl were withdrawn from the incubation mixture after 2, 10, 20, 30, 50, 70 and 90 min and typically dispensed in a 96 well filter plate (0.45 µm Low-Binding Hydrophilic PTFE; Millipore: MultiScreen Solvinert), containing 250 µl ACN to stop the reaction. After centrifugation filtrates were analyzed by MSMS (typically API 2000 or API 3000).
Calculation of in vitro clearance values from half-life data using hepatocytes, reflecting substrate depletion, was performed using the following equations [19, 20]:
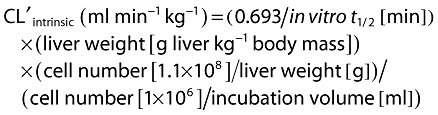 |
The CLblood was estimated using the nonrestricted well stirred model [21]:
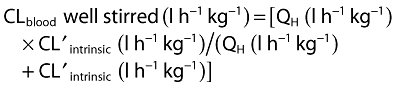 |
Specific liver weights and hepatic blood flows were 32 g kg−1 body mass and 4.2 l h−1 kg−1) for rats, 40 g kg−1 body mass and 2.1 l h−1 kg−1 for dogs and 21 g kg−1 body mass and 1.32 l h−1 kg−1 for man. The cell number in the liver was supposed to be 110 mio cells g−1 liver for all species used.
CETP transgenic mice
CETP transgenic mice (FVB/NBAYTgN(CETP)) [17] were bred in-house. To test for CETP inhibitory activity, BAY 60–5521 was administered orally by gavage. Male animals were randomly assigned to groups of n = 4 1 day before the start of the experiment. Before administration of the substance, blood was taken from each mouse by puncture of the retro-orbital venous plexus for the determination of its basal CETP activity in serum. BAY 60–5521 was formulated in 10% ethanol/10% Solutol/80% 0.9% NaCl (v/v/v). BAY 60–5521 was administered at various doses using a dosing volume of 10 ml kg−1 orally by gavage. At specific times after administration of the test substance, blood samples were collected, in general 16 or 24 h after substance administration. A control group of animals received the formulation vehicle only. After clotting, the blood samples were centrifuged and the serum was removed.
Effects of BAY 60–5521 on lipoproteins were determined against baseline at day 3 after treatment initiation. Briefly, before the start of the experiment, blood was withdrawn from the mice retro-orbitally in order to determine cholesterol in the serum. The serum was obtained as described above by incubation at 4°C overnight and subsequent centrifugation at 6000 g. After 3 days of daily administration of either BAY 60–5521 or torcetrapib at the indicated dosages blood was again withdrawn from the mice for lipoprotein analyses.
In vitro CETP inhibition assay
To assess CETP activity a micro-emulsion based assay according to Bisgaier et al. [22] was used with the following modification: (i) donor liposomes were prepared applying 1 mg cholesteryl 4,4-difluoro-5,7-dimethyl-4-bora-3a,4a-diaza-s-indacene-3-dodecanoate (cholesteryl BODIPY® FL C12, from Molecular Probes), 5.35 mg triolein (Sigma-Aldrich) and 6.67 mg POPC (Sigma-Aldrich) respectively, dissolved in a total volume of 600 µl dioxane and were slowly injected into 63 ml buffer (50 mm Tris/HCl pH 7.3, 150 mm NaCl, 2 mm EDTA) in a water bath sonicator. This suspension was then sonicated with 50 watt (Branson Sonifier 450 with a cup-horn resonator) for 30 min under a nitrogen atmosphere at room temperature, (ii) acceptor liposomes were prepared in the same manner as donor liposomes using 86 mg cholesteryl oleate, 20 mg triolein und 100 mg POPC dissolved in 1.2 ml dioxane and injected into 114 ml buffer and (iii) in a total test volume of 100 µl test compounds dissolved in DMSO (2 µl) were incubated at 37°C for 4 h with 50 µl of a CETP containing sample (1–3 µg CETP, enriched from human plasma) and 48 µl of a liposome emulsion (1 volume donor, 1 volume buffer and 2 volumes acceptor, respectively). The increase of the fluorescence intensity (excitation 485 nm, emission 535 nm) is proportional to the cholesterol ester transfer. The inhibition of the transfer was followed in comparison with a DMSO control.
To assess CETP activity in the presence of human plasma 6 µl (12% v/v) of donor liposomes and 1 µl (2% v/v) of a solution of the substance to be tested in DMSO were added to 42 µl (86% v/v) of human plasma (Sigma P 9523). The mixture was incubated at 37°C for 24 h. The change in the fluorescence at 510/529 nm is a measure of the cholesterol ester transfer. The inhibition of the transfer was followed in comparison with a DMSO control.
To assess CETP activity in a scintillation proximity assay the transfer of 3H-cholesterol ester from human HD lipoproteins to biotinylated LD lipoproteins was measured. In the test batch, 10 µl of HDL-3H-cholesterol ester (∼50 000 counts min−1) were incubated at 37°C for 18 h with 10 µl of biotin-LDL (Amersham) in 50 nm Hepes/0.15 m NaCl/ 0.1% bovine serum albumin/ 0.05% NaN3 pH 7.4 containing 10 µl of CETP (1 mg ml−1) and 3 µl of a solution of the substance to be tested (dissolved in 10% DMSO/ 1% BSA). SPA-streptavidin bead solution (TRKQ 7005, 200 µl) was then added, incubated further with shaking for 1 h and then measured in a scintillation counter. Corresponding incubations with 10 µl of buffer, 10 µl of CETP at 4°C and 10 µl of CETP at 37°C served as controls.
Physiologically-based pharmacokinetic (PBPK) modelling
PBPK simulations were carried out using the generic PBPK software PK-Sim® (Version 3.0, Bayer Technology Services GmbH, Leverkusen, Germany). PK-Sim® is part of a larger SystemsBiology software platform. PK-Sim® has been able to predict and simulate the pharmacokinetic behaviour of a variety of structurally different drugs [23–32]. A description of the PBPK model structure implemented in PK-Sim® has been described elsewhere [33]. The software contains databases with physiological parameters relevant for PBPK simulations for various laboratory animals including mice, rats and dogs as well as humans [34]. Based on this physiological information, the software uses validated mechanistic models to calculate gastro-intestinal transit and absorption as well as organ permeability and partition coefficients that determine the rate and extent of distribution of the compound into each organ based on its physicochemical properties [35–38]. For BAY 60–5521, the experimentally obtained membrane affinity (log MA = 5.10), binding constant to serum albumin (log KdHSA = −5.20) and molecular weight (MW = 504 g mol−1) were used as physicochemical input parameters. Another input parameter was the clearance of BAY 60–5521 as determined in hepatocytes (well stirred method).
PK predictions with PK-Sim® were performed for a male virtual individual with a body weight of 73 or 100 kg and body height of 176 cm following oral administration of 5, 12.5, 25 or 50 mg BAY 60–5521.
Results
Pharmacokinetics
The pharmacokinetics of BAY 60–5521 were investigated in mice, rats and dogs. Pharmacokinetics after oral administration were linear in rats (3 to 30 mg) and dogs (1 to 10 mg). The compound showed low blood clearance in all species. The apparent volume of distribution at steady state (Vss) for BAY 60–5521 was moderate in mice, rats and dogs (Table 1).
Table 1.
Pharmacokinetic profile of BAY 60–5521 in various animal species as determined by PK or PBPK modelling
| PK parameters for CETP-transgenic mice, rats and dogs after oral administration (CLB, Vss and t1/2 from i.v. administration; mouse data from i.v. study only) | PK parameters for rats (oral administration of 2 mg kg-1) and dogs (oral administration of 3 mg kg-1) estimated by PBPK | |||||
|---|---|---|---|---|---|---|
| Mouse | Rat | Dog | CETP transgenic mouse (FVB/NBAYTgN(CETP)) | Rat | Dog | |
| AUCnorm (kg l−1 h) | – | 1.71 | 12.90 | 3.15 | 1.68 | 9.56 |
| Cmax, norm (kg l−1) | – | 0.35 | 0.84 | 0.70 | 0.55 | 1.78 |
| AUCnormi.v. (kg l−1 h) | 4.90 | – | – | – | – | – |
| Cmax, norm i.v. (kg l−1) | 14.00 | – | – | – | – | – |
| t1/2 (h) | 5.00 | 7.20 | 8.60 | 4.00 | 16.70 | 10.90 |
| Vss (l kg−1) | 0.40 | 1.34 | 0.56 | – | 1.28 | 0.73 |
| CLb (l h−1 kg−1) | 0.40 | 0.50 | 0.09 | – | 0.40 | 0.07 |
| CLplasma (l h−1 kg−1) | – | – | – | – | 0.60 | 0.10 |
| F | – | 44% | 74% | – | 38% | 72% |
The absolute bioavailability of BAY 60–5521 after administration of drug in solution was 44% in rats and 74% in dogs. The incomplete bioavailability in rats is regarded as a result of incomplete absorption rather than first-pass metabolism as implicated by a variety of factors including the low blood clearance and by pharmacokinetic behaviour of BAY 60–5521 after administration of very high dosages. Although oral administration of high doses of up to 150 mg kg−1 in rats and up to 200 mg kg−1 in dogs indicated dose-dependent increases in plasma concentrations and AUC in both species the increase appeared less than dose-proportional (data not shown). However, due to variability and the shape of the plasma exposure curve over the time investigated definite conclusions about dose-proportionality can not be drawn from the data. Pharmacokinetics in non-transgenic mice were only investigated after i.v. application.
CETP inhibition of BAY 60–5521 in vitro
Results of CETP inhibition measurements in vitro are summarized in Table 2.
Table 2.
CETP inhibition of BAY 60–5521 in vitro in various assay formats and substrates (mean and SD)
| IC50 (nm) | ||||
|---|---|---|---|---|
| Fluoassay; artificial liposomes | SPA assay | Fluoassay; human plasma | Fluoassay; murine plasma | |
| BAY 60–5521 | 25 ± 5 | 7 ± 3 | 50 ± 22 | 25 ± 5 |
BAY 60–5521 inhibited CETP activity in a fluorescence assay using artificial liposomes with an IC50 of 25 nm. In a second assay (scintillation proximity assay, SPA) BAY 60–5521 showed an IC50 of 7 nm. Figure 1 shows the in vitro activity of BAY 60–5521 in the two different assay formats. In human plasma, BAY 60–5521 showed an IC50 of 50 nm whereas the IC50 of BAY 60–5521 in plasma from CETP transgenic mice was 25 nm (Figure 2).
Figure 1.
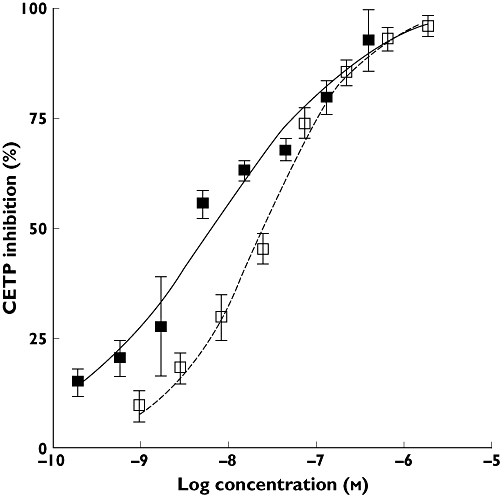
CETP inhibition of BAY 60–5521 in vitro in two different assay formats: scintillation proximity assay, SPA ( ) or fluoassay (
 )
)
Figure 2.
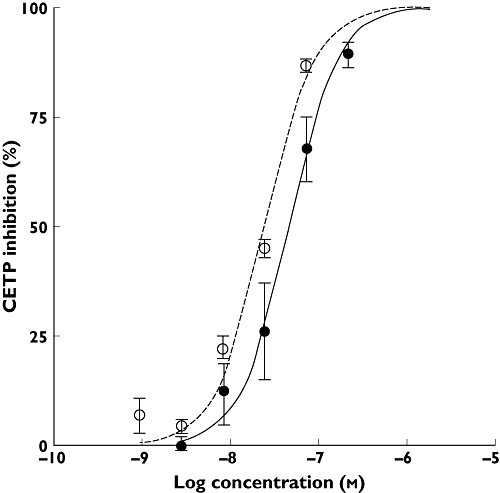
CETP inhibition of BAY 60–5521 in vitro in human plasma ( ) and murine plasma (○) using a fluoassay
Protein binding of BAY 60–5521 was high and species dependent. The fraction unbound, fu, for humans is fu,human 0.0244% and in CETP transgenic mice fu,CETPmouse 0.0140%.
Pharmacodynamics in the CETP transgenic mouse model
CETP activity varies markedly in different species, and some species, such as mice, lack CETP activity. Because ‘normal’ mice do not express CETP, transgenic mice carrying the human CETP-gene are characterized by an altered lipoprotein pattern compared with non-transgenic mice [17]. In (FVB/NBAYTgN(CETP)) – (CETP) transgenic mice, HDL is reduced and the Apo-B containing fractions (VLDL, LDL) are significantly increased. Thus, these animals have, due to the expression of CETP, a more human like lipoprotein profile compared with regular mice.
To test the activity of BAY 60–5521 in this model, CETP-inhibition was determined ex vivo 16 and 24 h after administration of the respective compound. BAY 60–5521 showed a trend for dose-dependency at lower doses and significantly inhibited the CETP activity at 16 and 24 h after a single oral administration of 2 mg kg−1 (Figure 3). Administration of 2 mg kg−1 BAY 60–5521 increased HDL by 53.7 ± 7.4% (mean/SD from n = 8 mice) in these mice statistically significantly (P < 0.001) vs. baseline at day 0.
Figure 3.
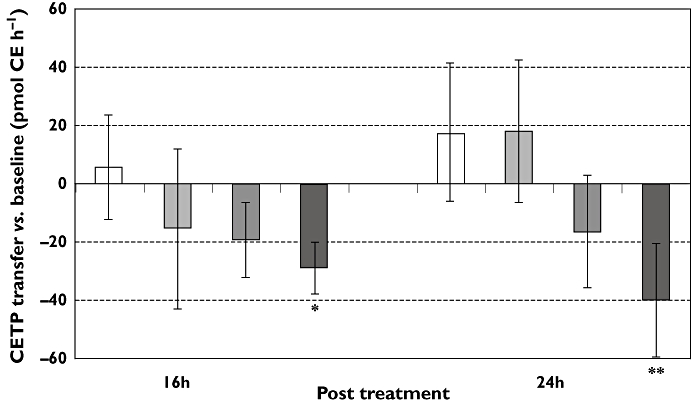
Change in CETP transfer vs. baseline (at time ‘0’) (in pmol CE h−1), mean and SD) 16 and 24 h after administration of vehicle control (mean ± SD) (□); BAY 60-5521 ( 0.5 mg kg−1,
  1 mg kg−1;
  2 mg kg−1); *P < 0.05; **P < 0.01
Robust and reproducible effects on HDL concentrations can be found starting at day 3 after daily administrations of ‘effective’ doses of CETP inhibitors in CETP transgenic mice. Therefore, the ‘effective’ dose was defined as the dose sufficient to increase robustly HDL-concentrations in a 3 day experiment vs. baseline at day 0.
The area under the plasma concentration curve after a single administration of the ‘effective dose’ of 2 mg kg−1 BAY 60–5521 was 6.202 mg l−1 h.
Human dose prediction on the basis of allometric scaling and the effective AUC in CETP transgenic mice
The calculation of clearances and Vss in humans by allometric species scaling of in vivo clearances under consideration of fu is depicted in Figures 4 and 5 and the parameters are listed in Table 3. The inhibition of CETP activity in CETP transgenic mice correlated with the plasma concentrations of BAY 60–5521 as shown in Figure 6.
Figure 4.
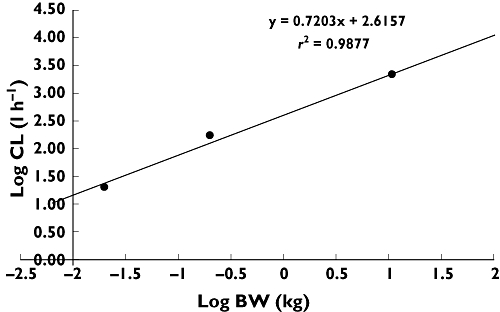
The calculation of clearance in humans by allometric species scaling of in vivo clearances under consideration of fu
Figure 5.
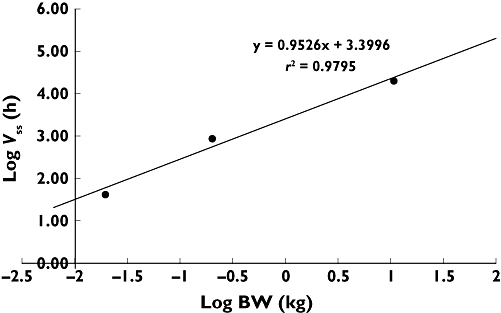
The calculation of Vss in humans by allometric species scaling of in vivo clearances under consideration of fu
Table 3.
Calculation of Vss or CL in humans by allometric species scaling of in vivo clearances under consideration of fu
| Species | BW (kg) | log (BW) | fu (%) | Vss (l kg-1) | Vss,unbound (l) | log (Vss,u) | CL (l h-1 kg-1) | CLunbound (l h-1) | log (CLu) |
|---|---|---|---|---|---|---|---|---|---|
| Mouse (observed) | 0.0200 | −1.70 | 0.02 | 0.44 | 44 | 1.64 | 0.21 | 20.5 | 1,31 |
| Rat (observed) | 0.200 | −0.699 | 0.03 | 1.34 | 893 | 2.95 | 0.26 | 173.3 | 2,239 |
| Dog (observed) | 10.8 | 1.03 | 0.03 | 0.56 | 20 160 | 4.30 | 0.06 | 2059.2 | 3.31 |
| Human (predicted) | 70.0 | 1.85 | 0.02 | 0.41 | 14 3608 | 5.16 | 0.03 | 8803.2 | 3.94 |
Figure 6.
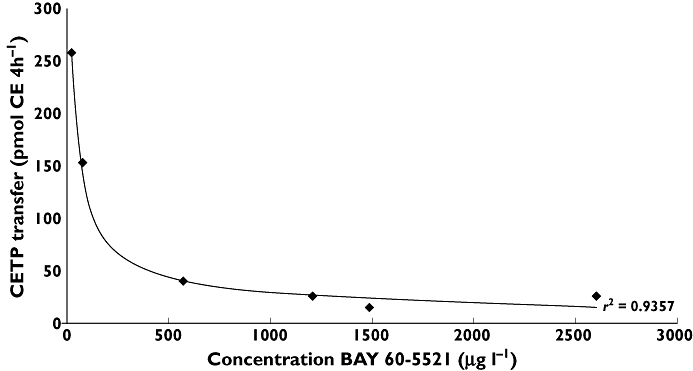
Correlation of CETP inhibition in CETP transgenic mice (n = 4/point) and plasma concentrations of BAY 60–5521
Pharmacodynamic investigations of CETP inhibition in mouse (CETP-mouse) vs. human plasma revealed differences in CETP-inhibitory activity. Therefore these species differences in IC50 need to be taken into account for the estimation of the effective AUC in humans. As the binding of BAY 60–5521 to plasma proteins is different in human and mouse plasma, the respective IC50 values need to be corrected for protein binding, yielding an IC50,unbound in the CETP transgenic mouse plasma of 0.0035 nm and in human plasma of 0.012 nm.
An effective human plasma AUC for BAY 60–5521 can then be derived using the formula:
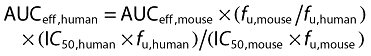 |
(1) |
The terms for the fu in mouse and human cancel out in this equation, leading to:
| (2) |
An effective human dose for BAY 60–5521 can then be calculated using the formula:
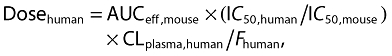 |
(3) |
Based on the scaled parameters and the assumptions as outlined above the estimated human dose for BAY 60–5521 is 51 mg man−1 day−1.
The Cmax was calculated using the formula
| (4) |
Based on the scaled parameters the estimated Cmax value for a human dose of 51 mg is approximately 700 µg l−1.
The elimination half-life, t1/2, in humans was calculated using the formula
| (5) |
Based on the scaled parameters the estimated t1/2 value was approximately 9 h.
Bioavailability was assumed to be 50% taking incomplete absorption observed in animals into account.
We applied a similar approach for an effective dose-prediction in humans to torcetrapib. Pharmacokinetic parameters were determined and allometric scaling was performed as described in the Methods section. The ‘effective’ torcetrapib dose in the CETP-transgenic mouse model was determined to be 20 mg kg−1 once a day as this dose led to an increase of HDL in these mice of 27.2 ± 8.3% (mean/SD from n = 8 mice) that was statistically significant (P < 0.001) vs. baseline at day 0. However, after administration of 20 mg kg−1 torcetrapib to CETP transgenic mice ex vivo inhibition of CETP activity at 16 h after administration was not detectable and, after 24 h, CETP activity was inhibited by 12.4 ± 20.8% (mean/SD from n = 4 mice) which was not statistically significant vs. baseline.
In this model, single administration of the ‘effective’ dose resulted in an AUC of 19.342 mg l−1 h. Additional input parameters used for the dose prediction included fraction unbound fu,human of 0.033% and for CETP transgenic mice fu,CETPmouse 0.0124%, CLplasma of 0.060 l h−1 kg−1 and assumed F of 30%.
Based on the above mentioned assumptions the estimated effective human dose for torcetrapib is 105 mg man−1 day−1 for a person of 70 kg body weight.
Physiologically-based pharmacokinetic (PBPK) modelling
After confirming that PK-Sim® is able to describe the plasma pharmacokinetics in rats and dogs (Table 1), plasma concentration–time profiles after oral administration of various doses of BAY 60–5521 were predicted in humans.
PK parameters estimated by PBPK for humans after a single administration of 5, 12.5, 25 or 50 mg to a human with 73 kg or 100 kg body weight are depicted in Table 4. For modelling purposes we chose a single administration of the CETP inhibitor and predicted PK over a 24 h time frame. According to the PBPK model, doses above 12.5 mg in humans resulted in plasma concentrations above the IC50 in human plasma for 24 h and could, thus, be considered effective. Furthermore, the predicted Cmax for the 50 mg dose was in very good agreement with the aforementioned estimated value of approximately 700 µg l−1. It should be noted that we have used a body weight assumption of 70 kg as the basis for the calculated dose estimate. Body weights of patients suffering from dyslipidaemia may differ from this modelling assumption. Using the PBPK approach, we, therefore, modelled plasma concentrations after administration of either 12.5, 25, 50 or 100 mg BAY 60–5521 in a human individual of approximately 70 kg body weight and, in addition, of 100 kg body weight. In both scenarios, the doses above 12.5 mg exceeded the IC50 of BAY 60–5521 vs. CETP as determined in in vitro experiments (Figure 7). Based on an IC50 value of 50 nm, the PBPK model predicts a mean CETP inhibition over 24 h of >68% for doses of 12.5 mg and above, while the mean CETP inhibition is below 55% for the lowest investigated dose.
Table 4.
PK parameters for humans after a single administration of 5, 12.5, 25 or 50 mg to a human with 73 kg (A) or 100 kg (B) body weight estimated by PBPK or (C) in a first-in man clinical study [16]
| A | ||||
|---|---|---|---|---|
| PBPK predictions (70 kg) | 5 mg | 12.5 mg | 25 mg | 50 mg |
| AUC (µg l−1 h) | 2220 | 5550 | 11100 | 22200 |
| AUCnorm (kg l−1 h) | 31.1 | 31.1 | 31.1 | 31.1 |
| Cmax (µg l−1) | 87.6 | 219 | 439 | 877 |
| Cmax,norm (kg l−1) | 3.0 | 3.0 | 3.0 | 3.0 |
| tmax (h) | 1.3 | 1.3 | 1.3 | 1.3 |
| t1/2 (h) | 34.1 | 34.1 | 34.1 | 34.1 |
| Vss (l kg−1) | 1.4 | 1.4 | 1.4 | 1.4 |
| Vss/F (l) | 102 | 102 | 102 | 102 |
| CLplasma (l h−1 kg−1) | 0.030 | 0.030 | 0.030 | 0.030 |
| CL/F (l h−1) | 2.19 | 2.19 | 2.19 | 2.19 |
| Bioavailability | 96% | 96% | 96% | 96% |
| B | ||||
|---|---|---|---|---|
| PBPK predictions (100 kg) | 5 mg | 12.5 mg | 25 mg | 50 mg |
| AUC (µg l−1 h) | 1570 | 3925 | 7850 | 15700 |
| AUCnorm (kg l−1 h) | 31.4 | 31.4 | 31.4 | 31.4 |
| Cmax (µg l−1) | 62.0 | 155 | 309 | 619 |
| Cmax,norm (kg l−1) | 1.2 | 1.2 | 1.2 | 1.2 |
| tmax (h) | 1.1 | 1.1 | 1.1 | 1.1 |
| t1/2 (h) | 51.4 | 51.4 | 51.4 | 51.4 |
| Vss (l kg−1) | 2.0 | 2.0 | 2.0 | 2.0 |
| Vss/F (l) | 208 | 208 | 208 | 208 |
| CLplasma (l h−1 kg−1)) | 0.030 | 0.030 | 0.030 | 0.030 |
| CL/F (l h−1) | 3.13 | 3.13 | 3.13 | 3.13 |
| Bioavailability | 96% | 96% | 96% | 96% |
| C | ||||
|---|---|---|---|---|
| Clinical data | 5 mg | 12.5 mg | 25 mg | 50 mg |
| AUC (µg l−1 h) | 905.5 | 1737 | 4012 | 10960 |
| AUCnorm (kg l−1 h) | 15.46 | 10.87 | 12.62 | 18.06 |
| Cmax (µg l−1) | 56.32 | 88.03 | 217.5 | 568.1 |
| Cmax,norm (kg l−1) | 0.9616 | 0.5733 | 0.6925 | 0.9358 |
| tmax (h) | 6.0 | 4.0 | 6.0 | 6.0 |
| t1/2 (h) | 76.42 | 143.4 | 144.1 | 117.4 |
| Vss (l kg−1) | n.d. | n.d. | n.d. | n.d. |
| Vz/F (l) | 610.6 | 1495 | 1298 | 773.4 |
| CLplasma (l h−1 kg−1)) | n.d. | n.d. | n.d. | n.d. |
| CL/F (l h−1) | 5.538 | 7.226 | 6.224 | 4.567 |
| Bioavailability | n.d. | n.d. | n.d. | n.d. |
n.d. not determined
Figure 7.
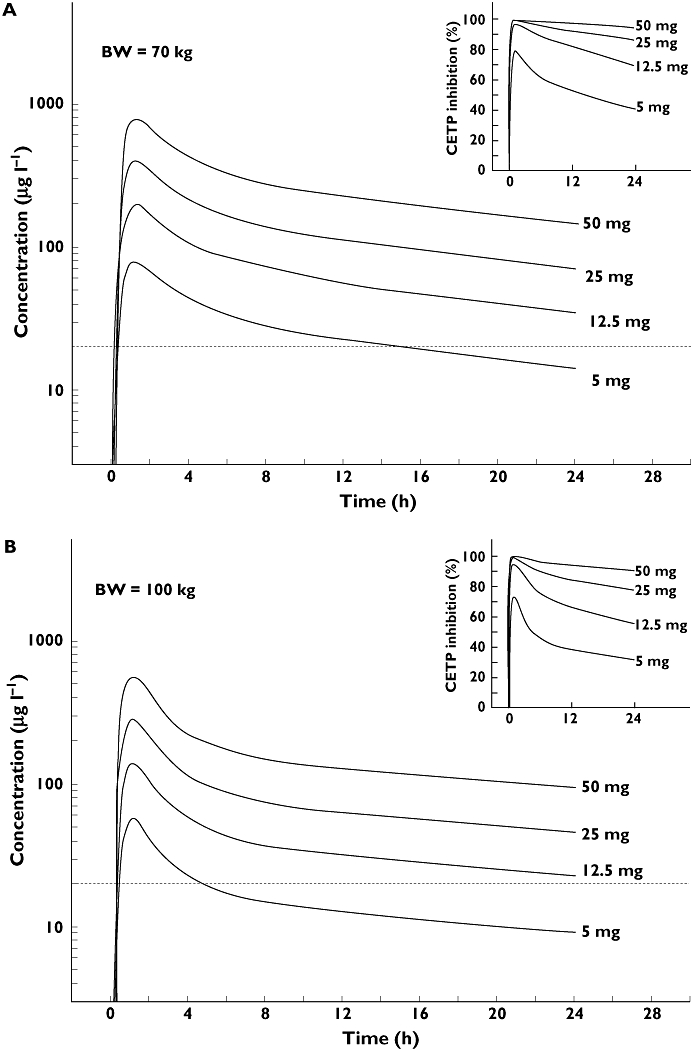
Simulation of a plasma concentration profile in humans after oral administration of 5, 12.5, 25 and 50 mg BAY 60–5521 to a human of approximately 70 kg body weight (A) or 100 kg body weight (B). An IC50 of 50 nm in human plasma (dotted line) was used for this calculation. The right upper graph shows a prediction of the CETP inhibition assuming an IC50 of 50 nm
Therefore, the aforementioned 51 mg dose of BAY 60–5521 would comfortably meet the criterion as an ‘effective dose’ that is able to increase concentrations of HDL.
Based on the preclinical data and the results of the PBPK modelling approach, 50 mg was recommended as the potentially effective dose in humans.
Discussion
The approach used for assisting the dose finding for a first-in-man dose used allometric scaling and pharmacokinetic−pharmacodynamic (PK–PD) relationship modelling with the help of PBPK modelling in humans.
We assumed that an ‘effective’ (with respect to HDL increase) AUC in CETP transgenic mice would translate into an ‘effective’ AUC in humans.
Estimated human pharmacokinetic parameters from allometric species scaling were used in combination with information on CETP inhibition in transgenic mice and human plasma. This approach resulted in a dose recommendation of 51 mg when the pharmacodynamics of BAY 60–5521 in a transgenic CETP mouse model were considered in perspective to the pharmacodynamic profile of BAY 60–5521 in human plasma. We furthermore tested our hypothesis using the CETP inhibitor, torcetrapib, in preclinical models and applied a similar dose-prediction approach to the CETP inhibitor, torcetrapib. Data in the above-described CETP transgenic mouse model have, to our knowledge, not been published for torcetrapib.
Based on the dose-prediction approach described above our in-house calculated prediction of a potential human dose of torcetrapib that would be sufficient to elevate HDL was 105 mg man−1 day−1, which is very close to the clinical dose reported for torcetrapib. Results from the clinical phase I and II studies with torcetrapib showed that this assumption might be true as torcetrapib showed a 46% or a 73% increase in HDL cholesterol at a daily dose of 120 mg [39, 40]. However, the late stage clinical development of torcetrapib was discontinued after negative results on clinical end points were obtained in phase III studies [41–44]. Potential off-target effects have been discussed in the literature such as an increase in blood pressure that may have contributed to the failure of this CETP inhibitor [11, 45, 46].
We have viewed our dose estimation approach as conservative leading possibly to high doses as the elimination half-life of BAY 60–5521 is shorter in mouse than in man.
Another point of consideration relates to the CETP inhibition profile of BAY 60–5521 which differs between the transgenic mouse and human plasma.
In CETP transgenic mice, inhibition of CETP activity correlated with the concentration of BAY 60–5521. On the other hand, in the transgenic mouse model CETP inhibition did not exceed 50% over the time course of 24 h after administration of a single dose of 2 mg kg−1 BAY 60–5521. The target enzyme for inhibition, CETP, is (over)-expressed in the CETP transgenic mouse. This may not only impact on the dynamics with respect to the desired effects on HDL which are robustly detectable only after 3 days of CETP inhibitor administration in this model but may also affect the PK/PD relationship compared with the situation in humans.
Therefore, we asked the question how the dose estimates obtained on the back of data from CETP transgenic mice might compare with estimates using a second model. For modelling purposes we have assumed that the plasma exposure of CETP inhibitors should exceed the IC50 for the respective inhibitor over a dosing interval in order to result in sufficient clinical efficacy as defined by elevation of HDL. Particularly, a single administration of an ‘effective dose’ should result in plasma exposure sufficient to inhibit CETP activity ≥50% over a 24 h period. For torcetrapib, a robust increase of HDL was observed in an early clinical study after treatment with 120 mg of torcetrapib [39], a dose that has been shown to inhibit CETP activity by more than 50% 24 h after administration of a single dose [40].
We modelled human PK vs. CETP inhibition using PBPK with PK-Sim® in order to confirm or challenge our estimates.
It is well documented that PK-Sim® is able to predict and simulate the pharmacokinetic behaviour of a variety of structurally different drugs [28–37]. The PBPK model behind PK-Sim® describes 17 organs plus several other containers (arterial and venous blood pool, portal vein, bile, urine, etc), each organ consisting of three to four subcompartments, leading to a total number of >70 compartments that are pre-parameterized according to their physiology [38, 39]. According to our PBPK-modelling approach, the human dose could be even lower than 50 mg and as small as approximately 12.5 mg man−1 day−1 to allow plasma concentrations of BAY 60–5521 to be above the plasma IC50 of 50 nm for 24 h.
However, as pointed out above, plasma IC50 in mouse and man as determined have shown discrepancy mainly depending on assay format of the in vitro assay used and the respective donor. For BAY 60–5521, highest IC50 in human plasma was determined to around 200 nm. Body weight, as another variable, was addressed as well in the modelling approach.
As determined in the PBPK approach, a 50 mg dose would cover plasma concentrations even above an IC50 of 50 nm in human plasma up to 200 nm for about 24 h in humans up to 100 kg body weight.
The comparison between the pharmacokinetic parameters predicted by the allometric method and using the PBPK approach shows that the PBPK model predicts a greater extent of distribution for BAY 60–5521 in humans, as is evident from a larger predicted volume of distribution and longer elimination half-life. This is a consequence of differences in the body composition (e.g. the fat content) between humans and the laboratory animals, that are considered in the physiological model but not reflected by the allometric scaling equation. The influence of the fat content is also reflected by the difference of the predicted volume of distribution in the virtual individual with a body weight of 100 kg (2.0 l kg−1) in comparison with a normal weight individual (1.4 l kg−1). Furthermore, the PBPK model predicts on the basis of the underlying species specific physiological differences of the gastro-intestinal tract that the bioavailability, that is limited by the poor solubility of BAY 60–5521 in rats (38%) and dogs (72%), is 96% in humans in the dose range between 5 and 50 mg.
The dose estimate was confirmed in an early single dose escalation study in humans covering doses of 5, 12.5, 25, or 50 mg BAY 60–5521 [16]. Starting at a single dose of 25 mg, a mean CETP inhibition >40% over 24 h was observed. However, a mean 50% inhibition of CETP activity over the course of 24 h was not achieved with that dose. After a single administration of 50 mg, the mean CETP inhibition was above >50% for at least 24 h. For lower doses than 50 mg, the increase of HDL was not statistically significant, in line with our assumption that the CETP activity should be inhibited by more than 50% over time in order to result in sufficient clinical efficacy [16].
The predictions using the PBPK model agreed reasonably well (i.e. mean observed AUC and Cmax within 1.5 to 3.2-fold and 1.1 to 2.3-fold of the prediction for a 70 kg and 100 kg subject, respectively) with the data observed in the clinical study [16]. The slight overestimation of AUC and Cmax is accompanied by an underprediction of the volume of distribution and terminal half-life. The latter was underpredicted by a factor of between 1.5 and 4.2 by the PBPK model, but it should be mentioned, that the experimental values for t1/2 were observed up to 336 h after administration of BAY 60–5521, while the simulation only captured the first 24 h after administration. The terminal half-life predicted by allometric scaling was only 9 h and, thus, far shorter than the observed values.
In summary, we have used a combined approach including allometric species scaling of clearance and distribution together with experimental pharmacodynamic parameters obtained in vitro in human plasma and in a transgenic mouse model to estimate an effective dose for BAY 60–5521. The estimated dose of 51 mg was furthermore supported by PBPK using PK-Sim®. The combined approach allowed the prediction of an effective human dose under consideration of variability in parameters like, for instance, weight or even pharmacodynamic parameters like the in vivo IC50 that may be influenced by protein binding. Confirmation of the above mentioned dose estimate was obtained in a first-in-man study [16].
Competing Interests
All authors are employees of Bayer and have worked on the project described in this paper.
REFERENCES
- 1.Smith DA, van de Waterbeemd H, Walker DK. Inter-species scaling. In: Smith DA, van de Waterbeemd H, Walker DK, Mannhold R, Kubinyi H, Timmerman H, editors. Pharmacokinetics and Metabolism in Drug Design. Weinheim, New York, Chichester, Brisbane, Singapore, Toronto: Wyley VCH publishers; 2001. pp. 123–32. [Google Scholar]
- 2.Boxenbaum H. Interspecies scaling, allometry, physiological time, and the ground plan of pharmacokinetics. Pharmacokinet Biopharm. 1982;10:201–27. doi: 10.1007/BF01062336. [DOI] [PubMed] [Google Scholar]
- 3.Ings RM. Interspecies scaling and comparisons in drug development and toxicokinetics. Xenobiotica. 1990;20:1201–31. doi: 10.3109/00498259009046839. [DOI] [PubMed] [Google Scholar]
- 4.Lave T, Coassolo P, Reigner B. Prediction of hepatic metabolic clearance based on interspecies allometric scaling techniques and in vitroin vivo correlations. Clin Pharmacokinetet. 1999;36:211–31. doi: 10.2165/00003088-199936030-00003. [DOI] [PubMed] [Google Scholar]
- 5.Gardner IB, Walker DK, Lennard MS, Smith DA, Tucker GT. Comparison of the disposition of two novel combined thromboxane synthase inhibitors/thromboxane A2 receptor antagonists in the isolated perfused rat liver. Xenobiotica. 1995;25:185–97. doi: 10.3109/00498259509061844. [DOI] [PubMed] [Google Scholar]
- 6.Rajman I. PK/PD modelling and simulations: utility in drug development. Drug Discov Today. 2008;13:341–6. doi: 10.1016/j.drudis.2008.01.003. [DOI] [PubMed] [Google Scholar]
- 7.Thygesen P, Macheras P, van Peer A. Physiologically-based PK/PD modelling of therapeutic macromolecules. Pharm Res. 2009;12:2543–50. doi: 10.1007/s11095-009-9990-3. [DOI] [PubMed] [Google Scholar]
- 8.Schmidt S, Barbour A, Sahre M, Rand KH, Derendorf H. PK/PD: new insights for antibacterial and antiviral applications. Curr Opin Pharmacol. 2008;5:549–56. doi: 10.1016/j.coph.2008.06.010. [DOI] [PubMed] [Google Scholar]
- 9.Hunt JA. Cholesteryl ester transfer protein (CETP) inhibitors. Curr Top Med Chem. 2009;9:419–27. doi: 10.2174/156802609788340823. [DOI] [PubMed] [Google Scholar]
- 10.Parini P, Rudel LL. Is there a need for cholesteryl ester transfer protein inhibition? Arterioscler Thromb Vasc Biol. 2003;23:374–5. doi: 10.1161/01.ATV.0000060447.25136.1C. [DOI] [PubMed] [Google Scholar]
- 11.Stein EA, Roth EM, Rhyne JM, Burgess T, Kallend D, Robinson JG. Safety and tolerability of dalcetrapib (RO4607381/JTT-705): results from a 48-week trial. Eur Heart J. 2010;31:480–8. doi: 10.1093/eurheartj/ehp601. [DOI] [PMC free article] [PubMed] [Google Scholar]
- 12.Kumar S, Tan EY, Hartmann G, Biddle Z, Bergman AJ, Dru J, Ho JZ, Jones AN, Staskiewicz SJ, Braun MP, Karanam B, Dean DC, Gendrano IN, Graves MW, Wagner JA, Krishna R. Metabolism and excretion of anacetrapib, a novel inhibitor of the cholesteryl ester transfer protein, in humans. Drug Metab Dispos. 2010;38:474–83. doi: 10.1124/dmd.109.028704. [DOI] [PubMed] [Google Scholar]
- 13.Kuo GH, Rano T, Pelton P, Demarest KT, Gibbs AC, Murray WV, Damiano BP, Connelly MA. Design, synthesis, and biological evaluation of (2R,alphaS)-3,4-dihydro-2-[3-(1,1,2,2-tetrafluoroethoxy)phenyl]-5-[3-(trifluoromethoxy)-phenyl]-alpha-(trifluoromethyl)-1(2H)-quinolineethanol as potent and orally active cholesteryl ester transfer protein inhibitor. J Med Chem. 2009;52:1768–72. doi: 10.1021/jm801319d. [DOI] [PubMed] [Google Scholar]
- 14.Weber O, Bischoff H, Schmeck C, Boettcher MF. Cholesteryl ester transfer protein and its inhibition. Cell Mol Life Sci. 2010;67:3139–49. doi: 10.1007/s00018-010-0418-3. [DOI] [PMC free article] [PubMed] [Google Scholar]
- 15.Schmeck C, Gielen-Haertwig H, Vakalopoulos A, Bischoff H, Li V, Wirtz G, Weber O. Novel tetrahydrochinoline derived CETP-inhibitors. Bioorg Med Chem Lett. 2010;20:1740–3. doi: 10.1016/j.bmcl.2010.01.071. [DOI] [PubMed] [Google Scholar]
- 16.Boettcher FM, Heinig R, Schmeck C, Ludwig M, Schaefer A, Gelfert-Peukert S, Wensing G, Weber O. Single dose pharmacokinetics, pharmacodynamics, tolerability, and safety of BAY 60-5521, a potent inhibitor of cholesteryl ester transfer protein (CETP) Br J Clin Pharmacol. 2011 doi: 10.1111/j.1365-2125.2011.04083.x. this issue. [DOI] [PMC free article] [PubMed] [Google Scholar]
- 17.Dinchuk J, Hart J, Gonzalez G, Karmann G, Schmidt D, Wirak DO. Remodelling of lipoproteins in transgenic mice expressing human cholesteryl ester transfer protein. Biochim Biophys Acta. 1995;1255:301–10. doi: 10.1016/0005-2760(94)00246-u. [DOI] [PubMed] [Google Scholar]
- 18.Schuhmacher J, Buehner K, Witt-Laido A. Determination of the free fraction and relative free fraction of drugs strongly bound to plasma proteins. J Pharm Sci. 2000;89:1008–21. doi: 10.1002/1520-6017(200008)89:8<1008::aid-jps5>3.0.co;2-b. [DOI] [PubMed] [Google Scholar]
- 19.Houston JB. Utility of in vitro drug metabolism data in predicting in vivo metabolic clearance. Biochem Pharmacol. 1994;47:1469–79. doi: 10.1016/0006-2952(94)90520-7. [DOI] [PubMed] [Google Scholar]
- 20.Obach RS, Baxter JG, Liston TE, Silber BM, Jones BC, MacIntyre F, Rance DJ, Wastall P. The prediction of human pharmacokinetic parameters from preclinical and in vitro metabolism data. J Pharmacol Exp Ther. 1997;283:46–58. [PubMed] [Google Scholar]
- 21.Pang KS, Rowland M. Hepatic clearance of drugs. I. Theoretical considerations of a ‘well-stirred’ model and a ‘parallel tube’ model. Influence of hepatic blood flow, plasma and blood cell binding, and the hepatocellular enzymatic activity on hepatic drug clearance. J Pharmacokinet Biopharm. 1977;5:625–53. doi: 10.1007/BF01059688. [DOI] [PubMed] [Google Scholar]
- 22.Bisgaier CL, Minton LL, Essenburg AD, White A, Homan R. Use of fluorescent cholesteryl ester microemulsions in cholesteryl ester transfer protein assays. J Lipid Res. 1993;34:1625–34. [PubMed] [Google Scholar]
- 23.Edginton AN, Schmitt W, Willmann S. Application of physiology-based pharmacokinetic and pharmacodynamic modeling to individualized target-controlled propofol infusions. Adv Ther. 2006;23:143–58. doi: 10.1007/BF02850355. [DOI] [PubMed] [Google Scholar]
- 24.Edginton AN, Schmitt W, Willmann S. Development and evaluation of a generic physiology-based pharmacokinetic (PBPK) model for children. Clin Pharmacokinet. 2006;45:1013–34. doi: 10.2165/00003088-200645100-00005. [DOI] [PubMed] [Google Scholar]
- 25.Willmann S, Höhn K, Edginton A, Sevestre M, Solodenko J, Weiss W, Lippert J, Schmitt W. Development of a physiology-based population model for assessing the influence of individual variability on the pharmacokinetics of drugs. J Pharmacokinet Pharmacodyn. 2007;34:401–31. doi: 10.1007/s10928-007-9053-5. [DOI] [PubMed] [Google Scholar]
- 26.Willmann S, Edginton AN, Dressman JB. Development and validation of a physiology-based model for the prediction of oral absorption in monkeys. Pharm Res. 2007;24:1275–82. doi: 10.1007/s11095-007-9247-y. [DOI] [PubMed] [Google Scholar]
- 27.Vossen M, Sevestre M, Niederalt C, Jang I-J, Willmann S, Edginton AN. Dynamically simulating the interaction of midazolam and the CYP3A4 inhibitor itraconazole using individual coupled whole-body physiologically-based pharmacokinetic (WB-PBPK) models. Theor Biol Med Model. 2007;26:4–13. doi: 10.1186/1742-4682-4-13. [DOI] [PMC free article] [PubMed] [Google Scholar]
- 28.Edginton AN, Theil P, Schmitt W, Willmann S. Whole body physiologically-based pharmacokinetic models: their use in clinical drug development. Expert Opin Drug Metab Toxicol. 2008;4:1143–52. doi: 10.1517/17425255.4.9.1143. [DOI] [PubMed] [Google Scholar]
- 29.Edginton AN, Willmann S. Physiology-based simulations of pathological conditions: pharmacokinetic variability associated with liver cirrhosis. Clin Pharmacokinet. 2008;47:743–52. doi: 10.2165/00003088-200847110-00005. [DOI] [PubMed] [Google Scholar]
- 30.Edginton AN, Ahr G, Willmann S, Stass S. Defining the role of macrophages in local moxifloxacin tissue concentrations using biopsy data and whole-body physiologically based pharmacokinetic modeling. Clin Pharmacokinet. 2009;48:181–7. doi: 10.2165/00003088-200948030-00004. [DOI] [PubMed] [Google Scholar]
- 31.Willmann S, Edginton AN, Kleine-Besten M, Jantratid E, Thelen K, Dressman JB. Whole-body physiologically-based pharmacokinetic population modelling of oral drug administration: inter-individual variability of cimetidine absorption. J Pharm Pharmacol. 2009;61:891–9. doi: 10.1211/jpp/61.07.0008. [DOI] [PubMed] [Google Scholar]
- 32.Willmann S, Edginton AN, Coboeken K, Ahr G, Lippert J. Risk to the breast-fed neonate from codeine treatment to the mother: a quantitative mechanistic modeling study. Clin Pharmacol Ther. 2009;68:634–43. doi: 10.1038/clpt.2009.151. [DOI] [PubMed] [Google Scholar]
- 33.Willmann S, Lippert J, Sevestre M, Solodenko J. Fois F, Schmitt W. PK-Sim®: a physiologically based pharmacokinetic ‘whole-body’ model. Biosilico. 2003;1:121–4. [Google Scholar]
- 34.Willmann S, Lippert J, Schmitt W. From physicochemistry to absorption and distribution: predictive mechanistic modelling and computational tools. Expert Opin Drug Metab Toxicol. 2005;1:159–68. doi: 10.1517/17425255.1.1.159. [DOI] [PubMed] [Google Scholar]
- 35.Willmann S, Thelen K, Becker C, Dressman JB, Lippert J. Mechanism-based prediction of particle size-dependent dissolution and absorption: cilostazol pharmacokinetics in dogs. Eur J Pharm Biopharm. 2010;76:83–94. doi: 10.1016/j.ejpb.2010.06.003. [DOI] [PubMed] [Google Scholar]
- 36.Thelen K, Jantratid E, Dressman JB, Willmann S. Analysis of nifedipine absorption from soft gelatin capsules using PBPK modeling and biorelevant dissolution testing. J Pharm Sci. 2010;99:2899–904. doi: 10.1002/jps.22026. [DOI] [PubMed] [Google Scholar]
- 37.Willmann S, Schmitt W, Keldenich J, Lippert J, Dressman JB. A physiological model for the estimation of fraction of dose absorbed in humans. J Med Chem. 2004;47:4022–31. doi: 10.1021/jm030999b. [DOI] [PubMed] [Google Scholar]
- 38.Willmann S, Schmitt W, Keldenich J, Dressman JB. A physiologic model for simulating gastro-intestinal flow and drug absorption in rats. Pharm Res. 2003;20:1766–71. doi: 10.1023/b:pham.0000003373.72652.c0. [DOI] [PubMed] [Google Scholar]
- 39.Clark RW, Sutfin TA, Ruggeri RB, Willauer AT, Sugarman ED, Magnus-Aryitey G, Cosgrove PG, Sand TM, Wester RT, Williams JA, Perlman ME, Bamberger MJ. Raising high-density lipoprotein in humans through inhibition of cholesteryl ester transfer protein: an initial multidose study of torcetrapib. Arterioscler Thromb Vasc Biol. 2004;24:490–7. doi: 10.1161/01.ATV.0000118278.21719.17. [DOI] [PubMed] [Google Scholar]
- 40.Brousseau ME, Schaefer EJ, Wolfe ML, Bloedon LT, Digenio AG, Clark RW, Mancuso JP, Rader DJ. Effects of an inhibitor of cholesteryl ester transfer protein on HDL cholesterol. N Engl J Med. 2004;350:1505–15. doi: 10.1056/NEJMoa031766. [DOI] [PubMed] [Google Scholar]
- 41.Kastelein JJ, van Leuven SI, Burgess L, Evans GW, Kuivenhoven JA, Barter PJ, Revkin JH, Grobbee DE, Riley WA, Shear CL, Duggan WT, Bots ML RADIANCE 1 Investigators. Effect of torcetrapib on carotid atherosclerosis in familial hypercholesterolemia. N Engl J Med. 2007;356:1620–30. doi: 10.1056/NEJMoa071359. [DOI] [PubMed] [Google Scholar]
- 42.Nissen SE, Tardif JC, Nicholls SJ, Revkin JH, Shear CL, Duggan WT, Ruzyllo W, Bachinsky WB, Lasala GP, Tuzcu EM ILLUSTRATE Investigators. Effect of torcetrapib on the progression of coronary atherosclerosis. N Engl J Med. 2007;356:1304–16. doi: 10.1056/NEJMoa070635. [DOI] [PubMed] [Google Scholar]
- 43.Barter PJ, Caulfield M, Eriksson M, Grundy SM, Kastelein JJ, Komajda M, Lopez-Sendon J, Mosca L, Tardif JC, Waters DD, Shear CL, Revkin JH, Buhr KA, Fisher MR, Tall AR, Brewer B ILLUMINATE Investigators. Effects of torcetrapib in patients at high risk for coronary events. N Engl J Med. 2007;357:2109–22. doi: 10.1056/NEJMoa0706628. [DOI] [PubMed] [Google Scholar]
- 44.Bots ML, Visseren FL, Evans GW, Riley WA, Revkin JH, Tegeler CH, Shear CL, Duggan WT, Vicari RM, Grobbee DE, Kastelein JJ RADIANCE 2 Investigators. Torcetrapib and carotid intima-media thickness in mixed dyslipidaemia (RADIANCE 2 study): a randomised, double-blind trial. Lancet. 2007;370:153–60. doi: 10.1016/S0140-6736(07)61088-5. [DOI] [PubMed] [Google Scholar]
- 45.Joy T, Hegele RA. The end of the road for CETP inhibitors after torcetrapib? Curr Opin Cardiol. 2009;24:364–71. doi: 10.1097/hco.0b013e32832ac166. [DOI] [PubMed] [Google Scholar]
- 46.Neeli H, Rader DJ. Cholesteryl ester transfer protein (CETP) inhibitors: is there life after torcetrapib? Cardiol Clin. 2008;26:537–46. doi: 10.1016/j.ccl.2008.06.005. [DOI] [PubMed] [Google Scholar]