

Abstract
In the barn owl, maps of interaural time difference (ITD) are created in the nucleus laminaris (NL) by interdigitating axons that act as delay lines. Adult delay line axons are myelinated, and this myelination is timely, coinciding with the attainment of adult head size, and stable ITD cues. The proximal portions of the axons become myelinated in late embryonic life, but the delay line portions of the axon in NL remain unmyelinated until the first postnatal week. Myelination of the delay lines peaks at the third week posthatch, and myelinating oligodendrocyte density approaches adult levels by one month, when the head reaches its adult width. Migration of oligodendrocyte progenitors into NL and the subsequent onset of myelination may be restricted by a glial barrier in late embryonic stages and the first posthatch week, since the loss of tenascin-C immunoreactivity in NL is correlated with oligodendrocyte progenitor migration into NL.
Keywords: auditory delay lines, nucleus laminaris, myelination, oligodendrocyte progenitor migration, tenascin-C
INTRODUCTION
In the auditory system, phase-locked spikes preserve the temporal information needed to compute interaural time differences (ITDs) (Carr and Boudreau, 1993; Konishi, 2003). Sensitivity to ITDs in barn owls first appears in the auditory brainstem nucleus laminaris (NL) (Carr and Konishi, 1990), which receives a bilateral ascending projection from the cochlear nucleus magnocellularis [NM, Fig. 1; also see Fig. 12(H) for the illustrated delay line circuitry]. The NM axons are myelinated axons that act as delay lines to form maps of ITD in dorsoventral dimension of NL (Carr and Boudreau, 1993). Intracellular recordings from these NM axons in NL reveal a conduction delay of about 160 μs over the 700 μm depth of the nucleus. These delays are physiologically appropriate, since they match the ITDs experienced by the barn owl (Moiseff and Konishi, 1981; Poganiatz et al., 2001).
Figure 1.
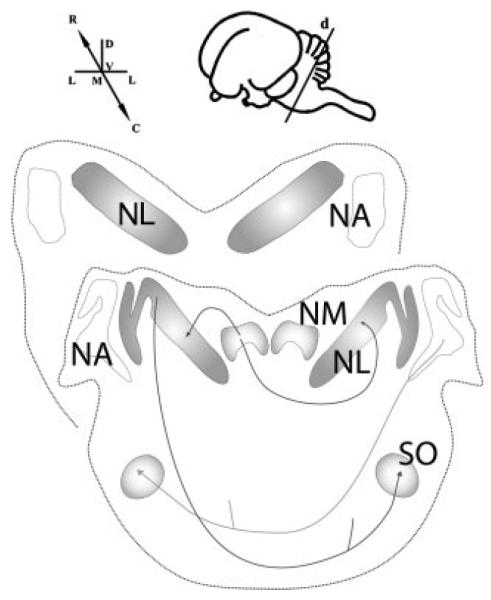
Structure and orientation of the auditory brainstem in the barn owl. Diagrams of transverse sections through the caudal (C) and rostral (R) auditory brainstem nucleus laminaris (NL) and nucleus magnocellularis (NM). The inset shows a schematic lateral view of an owl’s brain with the dissection plane (d) and dorsal-ventral (D-V) and medial-lateral (M-L) axes. Eighth nerve afferents innervate both the level-coding nucleus angularis (NA) and the time-coding NM. NM projects tonotopically to both ipsi- and contralateral NL. NA and NL project to the ventrally located superior olive (SO), and to the lemniscal nuclei and the inferior colliculus in the midbrain (not shown).
Figure 12.

Tenascin-C and a model of the development of the auditory delay line circuit. This model incorporates timelines for the development of myelination and hypothesized function for tenascin-C (TN-C) expression in the auditory brainstem with other developmental events in the nucleus magnocellularis (NM) and nucleus Laminaris (NL) between embryonic stages (E) and one week post-hatch (P7). Cited references refer to developmental events in the auditory brainstem. (A–C, E8-E18): A and B, TN-C (even grey or green fill) guides the migrating neuronal precursors to form dorsal cell mass and subsequent separation of NM and NL (Kubke et al., 2004, Kubke et al, 2002). C: NM axons then extend through TN-C to reach NL (Kubke et al, 2002). (D and E, E18-E24): D, Axonal innervation upregulates TN-C in NL, while TN-C declines outside NL (Kubke et al., 2002). Myelination of NM axons starts at the proximal ends. E, TN-C detaches NL neurons and synaptogenesis in NL begins (Kubke et al., 2002). (F and G, E24-E28): F, TN-C has disappeared from outside NL, NL neurons have expanded into a multi-layer structure, and myelination of NM axons proceeds toward NL (Kubke and Carr, 2000; Kubke et al., 2002). G: Myelination of NM axons outside NL and synaptogenesis in NL is largely complete and the delay line circuitry is established (Kubke and Carr, 2000; Kubke et al., 2002). (H, E28-P7): TN-C is downregulated in NL, permitting dendritic reorganization and initiation of myelination of the delay line axons in NL (Kubke and Carr, 2000).
Since there is an optimal ratio between internodal distance and fiber diameter (about 100–200) to maximize conduction velocity (Brill et al., 1977), NM axons with fiber diameters around 3 μm and internodal distances of 300 μm outside NL are capable of optimal conduction velocity. The parts of the axon that act as delay lines within NL, however, have shorter internodes (about 60 μm) and slower conduction velocity, measured at about 3–5 m/s (Carr and Konishi, 1990). The shorter internodal distance and the slower conduction velocity of the delay line portion of the axon enable the owl to map the biological range of ITDs within the dorsoventral dimension of NL (Carr and Konishi, 1990). A shorter internodal distance may be due to changes in the axon diameter or changes in the myelination process. Since the diameter of NM axons is consistent across the NL border (Carr and Konishi, 1990; Carr and Boudreau, 1993), we used immunohistochemistry and in situ hybridization to study the myelination of auditory delay lines during development. The different stages of myelination are linked to increased expression of various myelin-specific genes (Shiota et al., 1989; Grinspan et al., 1993), allowing the use of immunohistochemistry with myelin associated glycoprotein (MAG) to mark the onset of myelination (Martini and Schachner, 1986; Keita et al., 2002; Nakahara et al., 2003) and in situ hybridization with proteolipid protein (PLP) to mark myelinating oligodendrocytes (Nave et al., 1987; Nave and Milner, 1989).
Here we demonstrate that myelination of the delay line portion of the NM axons is retarded with respect to myelination of the proximal portion of the axon and the surrounding brainstem. This late onset of myelination may underlie the shortened internodal distance of delay line axons. Furthermore, the late myelination of the delay line portion of the axons coincides with the attainment of stable auditory cues and adult head size (Haresign and Moiseff, 1988; Carr, 1995; Carr et al., 1998). We hypothesize that myelination of delay line axons is regulated by a glial barrier in NL composed of tenascin-C (TN-C), since the presence of TN-C in NL during the last two embryonic weeks is correlated with the absence of oligodendrocyte progenitors in NL, while loss of TN-C at the time of hatching is correlated with the appearance of oligodendrocyte progenitors in NL and myelination of the delay line axons.
MATERIALS AND METHODS
This work was based on results from 60 barn owls (Tyto alba) of both sexes with age ranging from embryos to adult. Preliminary data have been presented as abstracts and conference proceedings (Cheng and Carr, 1992; Carr, 1995). Due to limited resources, number of owl embryos and owl chicks for each time point was varied and limited (range from 1 to 5; E17 (2), E18 (1), E19 (3), E21 (2), E22 (1), E23 (2), E24 (1), E26 (2), E27 (2), E28 (1), E29 (1), E31 (2), E32/P0 (5), P2 (3), P5 (2), P6 (1), P7 (3), P8 (1), P9 (1), P10 (1), P12 (2), P14 (3), P15 (1), P20 (2), P21 (1), P24 (1), P25 (2), P30 (4), P42 (1), P60 (2), Adult (4)). Owl eggs were incubated in a Lyon Roll-X incubator (Lyon Electric Co., Chula Vista, CA) at 37°C, and owl chicks were hand-raised in the laboratory (Rich and Carr, 1999). Owl embryos and chicks were staged using the reference data for age determination in Köppl et al. (2005). All protocols conformed to NIH and the University of Maryland Animal Care and Use Committee guidelines. All chemicals, except those specified, were from Sigma (St. Louis, MO).
Anatomy
Owls were anesthetized intramuscularly with Ketamine (15 mg/kg), followed by a lethal dose of Pentobarbital (20 mg/kg i.m., Abbott Laboratories, IL). After intracardiac injection of heparin, animals were perfused transcardially with saline, followed by 4% paraformaldehyde in 0.1 M phosphate buffer (PB) at pH 7.4. Brains were then cryoprotected in 30% sucrose and sectioned coronally at 30 μm using a freezing microtome (Fig. 1). Sections were stored in PB for immunohistochemistry. For in situ hybridization, sections were mounted on silane-prep slides. Embryos that were too small for perfusion were anesthetized by cooling, decapitated and fixed by immersion in 4% paraformaldehyde in PB.
Ultrastructural Analysis
Owls (E23, E31, P8, 12, 20, and 30) were anesthetized as above and perfused transcardially with oxygenated avian Tyrodes solution, followed by 1 L of 3% glutaraldehyde, 1% paraformaldehyde in 0.1 M phosphate buffer at pH 7.4 (Jackson and Parks, 1982; Carr and Boudreau, 1991). The brains were postfixed for 8 h, the brainstem was cut in transverse sections on a vibratome, and selected regions were postfixed with 1.0% osmium tetroxide and embedded in Araldite resin. Thin sections were stained with uranyl acetate and triple lead stain. The ultrastructure of NL was studied by first making a camera lucida drawing of an adjacent semithin section. The entire thin section was then viewed on the electron microscope in order to identify major landmarks and any profiles to be examined in serial section.
BrdU Protocol
Owls (n = 2) were injected subcutaneously with 5 mg of 5-bromo-2′-deoxyuridine (BrdU, 5 mg/mL) per 100 g of body weight, and were sacrificed after 8 h as described above. In addition, sections for immunostaining were pretreated with protease (3 μg/mL) and 1 N HCl to remove nuclear histones.
Immunohistochemistry
Standard immunohistochemical procedures were followed using the avidin-biotin-peroxidase complex (ABC) method with reagents from Vectastain ABC kits (Vector Labs, Burlingame, CA). Sections were pre-incubated for 1 h in 0.1 M phosphate buffered saline with 4% normal horse serum and 0.4% Triton-X, then incubated for 1–3 days in mouse monoclonal antibodies. Because the availability of owl embryo material was limited, we used antibodies that had been shown to recognize chicken protein. These included antibodies against myelin-associated glycoprotein (α-MAG, 1:200 dilution; No. MAB1567, Chemicon International, Temecula, CA), oligodendrocyte marker (O4, 1:100 dilution; No. MAB345, Chemicon) and proteolipid protein (α-PLP, 1:300 dilution; No. MAB388, Chemicon). The anti-tenascin antibody recognized chicken tenascin (1:300 dilution; M1-B4, Developmental Studies Hybridoma Bank, University of Iowa; Chiquet and Fambrough, 1984). Mouse anti-bromo-2′-deoxyuridine, (α-BrdU, 1:120 dilution; No. B-25315, Sigma) was used to identify BrdU-labeled cells. Sections were incubated for 1 h in biotinylated horse anti-mouse IgG secondary diluted at 1:1500, washed and incubated in ABC for 1 h. Sections were then developed in 0.03% diaminobenzidine tetrahydrachloride and 0.003% hydrogen peroxide in acetate-imidazole buffer with nickel sulfate intensification and then washed. They were mounted onto gelatin-subbed slides, counterstained with Neutral Red, dehydrated, cleared, and coverslipped with Permount.
In Situ Hybridization and Autoradiography
The chicken PLP cDNA clone used in this study was provided by Dr. Klaus Nave. In this clone the chicken cDNA fragments corresponding to the PLP coding region (822 bp) were subcloned into the pBluescript KS+ phagemid vector (Nave et al., 1987). The cDNA was linearized using HindIII and 35S-labeled antisense RNA probes were generated by in vitro transcription using T7 polymerase. The antisense riboprobe contain exon 3B of PLP and is specific for PLP-mRNA positive oligodendrocytes. Nonspecific sense riboprobes were also generated for control experiments. For in situ hybridization, sections were mounted on RNAase-free silane-prep slides. After pretreatment with proteinase K (50 μg/mL), and acetic anhydride (10 μg/mL), sections were hybridized with riboprobes in hybridization buffer (Life Technologies, Rockville, MD) at 65°C for overnight. Sections were subsequently washed with SSC buffer (1 mM NaCl, 1% SDS, 10 mM Na Citrate) at 42°C. For emulsion autoradiography, slides were dipped in photographic emulsion (NTB2, Kodak, Rochester, NY) and exposed before being developed and counterstained. The sense control was run in parallel with antisense experiments, and was used to monitor the level of background noise during autoradiography. None of the control experiments showed any labeling in the tissue sections.
Data Analysis
To quantify the progress of myelination, the numbers and hybridization intensity of PLP-mRNA positive oligodendrocytes were measured from both rostro-medial (high frequency coding) NL and caudo-lateral (low frequency coding) NL during postnatal development. The number of oligodendrocytes, represented by the silver grain clusters under darkfield illumination, were counted as follows: An eyepiece grid (10 × 10), which covers an area of 187.5 μm × 187.5 μm under the 40× objective, was placed over NL. For each section, number of oligodendrocytes within NL were counted under both brightfield and darkfield microscopy sequentially, and position of oligodendrocytes related to the grid area are marked and compared. Only those that were identified under both conditions were recorded as positive. Measurements were obtained from each postnatal week up to one month posthatch. Since the dimension of NL also expands during the first month posthatch, we expressed changes in terms of oligodendrocyte cell density, which is determined by the number of oligodendrocytes per grid area, over time.
The hybridization intensity of PLP mRNA was represented by the optical density of silver grain clusters measured with NIH Image (version 1.61, NIH, Bethesda, MD) and a Scion LG-3 frame grabber (Scion Corp., Frederick, MD) connected to an Olympus OLY-750 camera and BX60 microscope (Olympus America, Melville, NY). Images of silver grain clusters were captured under 40× darkfield microscopy and inverted to brightfield images for uncalibrated optical density measurements. All images were taken under same darkfield illumination, with the camera gain control set at 18 dB. Under NIH Image, the boundary of individual silver grain cluster, which corresponds to an oligodendrocyte, was drawn using the freehand selection tool, and optical density of the average gray value (mean) in the selection was analyzed. Optical densities of average background value were sampled across various positions and were consistent along the rostro-caudal NL and across the NL border. The intensity level of each oligodendrocyte was calculated by first subtracting the background from the mean optical density in the selection (background-corrected mean), and then normalized to the cell area.
RESULTS
NM Axons in NL Remain Unmyelinated in Late Embryonic Stages
The eighth nerve innervates NM by embryonic day 17 (E17), and NM axons arrive at NL between E17-21 (Kubke et al., 2002). Myelin-associated glycoprotein (α-MAG) immunohistochemistry showed that myelination of the eighth nerve and NM axons had begun by E18 [Fig. 2(A)]. At this time, the eighth nerve was heavily stained with α-MAG, and NM axons to both ipsi- and contra-lateral NL were also MAG positive. The proximal region of NM axons had more α-MAG staining, although a few labeled oligodendrocytes were also observed at the distal end of NM axons near NL. By E23, shortly after NM axons had arrived at NL, myelination of the NM axons outside the rostral NL border had begun [Fig. 2(B,C)]. NM axons that innervated rostro-medial NL [the future high best frequency region, Fig. 2(B)] were myelinated earlier than those that innervated caudo-lateral NL [the low frequency coding area, Fig. 2(C)]. A similar pattern to that observed with α-MAG antibody was found with immunohistochemical staining against proteolipid protein (PLP) and showed that NM axons outside the NL border of central NL were myelinated by about E26 [Fig. 2(D)]. By E32, the time of hatching, myelination of NM axons up to the caudal NL border had begun [Fig. 2(E,G)]. Some α-MAG labeled oligodendrocytes appeared in rostral NL, where they appeared to be associated with the thick, mediolaterally oriented axons of NL neurons. NM axons within NL remained unmyelinated, although oligodendrocytes were present [Fig. 2(F)]. At this time, there were more oligodendrocytes in high best frequency coding NL [Fig. 2(E)] than in low frequency coding NL [Fig. 2(G)]. Thus myelination of NM axons within NL was delayed with respect to the NM axons outside NL.
Figure 2.

Myelination of NM axons occurs in the embryo. Immunohistochemistry with anti-MAG (A–C, E–G) and anti-PLP (D) antibodies showed that at E18, both ipsi- and contra-lateral NM axons were myelinated at the proximal (P) region (A). At E23, myelination of the distal (D) regions of NM axons has begun (B, C). At E26, myelinated NM axons have approached the NL border (D). At E32, NM axons were myelinated up to the NL border, while the auditory delay lines in NL remained unmyelinated (E, G). One labeled oligodendrocyte in NL from (E) is shown in high magnification in (F). Note the tonotopic difference between the high frequency NL (B, E) and its low frequency counterpart (C, G). All arrows mark the NL border. Scale bar: (A, E, G) 250 μm, (B–D) 50 μm, (F) 5 μm.
Myelination of Delay Line Axons Occurs Postnatally Along a Tonotopic Gradient
To investigate whether the delayed myelination of NM axons in NL was correlated with the shorter internodal distance found in the delay line segment of the axon in the adult NL (Carr and Konishi, 1990), in situ hybridization was used to detect PLP-mRNA positive myelinating oligodendrocytes. Quantitative analysis of myelination was possible with PLP in situ hybridization because its mRNA is located exclusively in the oligodendrocyte cell body during development (Shiota et al., 1989). The significance of the increase in numbers of oligodendrocytes during the first month posthatch was, however, obscured by the expansion of NL itself during the same period. The width of NL, which was parallel to the length of delay lines, increased from about 200 μm at hatching to about 600 μm at one month posthatch to 700 μm in the adult (Carr and Boudreau, 1993). We therefore did not use changes in oligodendrocyte cell number, but oligodendrocyte density (number of oligodendrocytes per area), combined with measures of PLP-mRNA intensity (measured as total optical density) to measure the progress of myelination in NL.
To confirm that PLP expression reflected the progress of myelination, ultrastructural analyses NL were carried out in parallel with the in situ hybridization studies. Embryos (E23, E31) showed no myelination in NL [Fig. 3(A,B)], while at P8, myelination had begun in NL [Fig. 3(C)], and myelinated fibers and glial cells were numerous on the NL border [Fig. 3(F)]. By P12, myelinated axons were distributed throughout rostral and central NL, although most axons have few myelin lamellae [Fig. 3(D)]. By P20 and P30, most axons in NL were myelinated [Fig. 3(E,G,H)]. Thus ultrastructural analyses supported the use of PLP hybridization to quantify the progress of myelination in NL.
Figure 3.

Distribution pattern of myelinated axons in NL during development. A: E23 NL neurons (*) surrounded by unmyelinated profiles. At this age, NL neurons are organized into a compact lamina (note adjacent neuron), and have numerous dendrites that receive synaptic input at their distal ends (Kubke et al., 2002). B: E31 NL neuron (*) surrounded by unmyelinated axons and terminals. C: P8 NL neuron with myelinated axon (arrow), surrounded by unmyelinated axons and terminals. Note that the thick NL axon is myelinated while adjacent axons, assumed to originate from NM, are unmyelinated. Compare with (F) below. D: P12 NL neuron surrounded by unmyelinated axons and a few myelinated profiles. E: P20 NL neuron with large myelinated axon (arrow) and many myelinated axons. Note that although most axons are myelinated, they generally have fewer myelin lamellae than observed in P30 animals (compare with G). F: P8 dorsal NL border (arrows). Note myelinated axons dorsal to the border, glial cells, and unmyelinated axons within NL. G: P30 NL neuron with large myelinated axon (arrow) and myelinated axons. The myelinated axons cut in cross-section may originate from NM, since they are oriented orthogonal to the NL axons. H: P30 myelinated axons in NL (arrow), with an entire internode visible (arrow heads at nodes). Scale bar: 10 μm.
In the first week posthatch, PLP mRNA-labeled oligodendrocytes were present along NM axons projecting to both ipsi- and contra-lateral NL, and a large number of oligodendrocytes accumulated at the NL border (Fig. 4). At this time, there were more oligodendrocytes in the high best frequency coding NL [Fig. 4(A–C)] than in the low best frequency coding NL [Fig. 4(D–F)]. With the increasing presence of myelinating oligodendrocytes in NL, the first week posthatch marked the onset of myelination of the NM axons in NL. This indicated a temporal delay of about a week for the myelination of NM axons across the NL border. Oligodendrocytes in NL could either have been newly generated by oligodendrocyte progenitors, or could have migrated in from the mass of oligodendrocytes accumulated at the NL border (see below).
Figure 4.

Delay lines remain unmyelinated until the first week posthatch. In situ hybridization with anti-sense PLP riboprobes in both high frequency coding NL (A–C) and low frequency NL (D–F) at 5 days posthatch (P5). Large numbers of oligodendrocytes accumulated at the NL border with a small portion of oligodendrocytes within NL. The increasing number of oligodendrocytes in NL marked the onset of myelination of delay lines. (A/B) and (D/E) are same images taken under bright field microscopy (A, D) and dark field microscopy (B, E), respectively. (C, F) are higher magnifications of (B, E). Arrows mark the NL border. Scale bar: (A, B, D, E) 250 μm, (C, F) 50 μm.
The owl entered a period of maximal head growth at the second week posthatch that changed the external auditory cues (Haresign and Moiseff, 1988). During this second week, NL expanded and the numbers of oligodendrocytes increased in NL (Fig. 5). The hybridization intensity in NL remained lower than outside NL (see below). In the third week posthatch, numbers of oligodendrocytes in NL and the levels of PLP mRNA continued to rise (Fig. 6). In addition, the density of oligodendrocytes within NL was greater than outside NL. Thus, the third week posthatch represented the peak of myelination for NM axons in NL. At one month posthatch, the oligodendrocyte density in NL was roughly unchanged, and the PLP mRNA levels of oligodendrocytes remained high (Figs. 7 and 8).
Figure 5.

Numbers of oligodendrocytes in NL increase in the second week posthatch. In situ hybridization using anti-sense PLP riboprobes in both high frequency coding NL (A–C) and low frequency NL (D–F) at P12 showed that numbers of oligodendrocytes at the NL border decreased and numbers of oligodendrocytes in NL increased. Also, oligodendrocytes outside NL have higher PLP mRNA levels than oligodendrocytes within NL. (A/B) and (D/E) are same images taken under bright field microscopy (A, D) and dark field microscopy (B, E), respectively. (C, F) are higher magnifications of (B, E). Arrows mark the NL border. Scale bar: (A, B, D, E) 250 μm, (C, F) 50 μm.
Figure 6.

Myelination of delay lines peaks in the third week posthatch. In situ hybridization with anti-sense PLP riboprobes in both high frequency coding NL (A–C) and low frequency NL (D–F) at 20 days posthatch (P20) showed that both the numbers of oligodendrocytes in NL and their PLP mRNA levels continued to rise between P12 and P20. Notice that the tonotopic difference between the high and low frequency coding NL decreased. (A/B) and (D/E) are same images taken under bright field microscopy (A, D) and dark field microscopy (B, E), respectively. (C, F) are higher magnifications of (B, E). Arrows mark the NL border. Scale bar: (A, B, D, E) 250 μm, (C, F) 50 μm.
Figure 7.

Auditory delay lines are myelinated by the end of one month posthatch. In situ hybridization was carried out with anti-sense PLP riboprobes in both high frequency coding NL (A–C) and low frequency NL (D–F) at 30 days posthatch (P30). Numbers of oligodendrocytes and their PLP mRNA levels remain high. However, the tonotopic difference between the high and low frequency coding NL no longer exists. (A/B) and (D/E) are same images taken under bright field microscopy (A, D) and dark field microscopy (B, E), respectively. (C, F) are higher magnifications of (B, E). Scale bar: (A, B, D, E) 250 μm, (C, F) 50 μm.
Figure 8.

Auditory delay lines are myelinated by the end of one month posthatch. Both oligodendrocyte density (A) and PLP mRNA hybridization intensity (B) were at or close to adult levels at one month posthatch. A: Mean numbers of oligodendrocytes per grid area (187.5 μm × 187.5 μm) were counted both inside and on the borders of both rostral, high best frequency NL and caudal, low best frequency NL. The number of sampled grid areas per time point varied from 7 to 30, with a mean of 16 counts per point. B: Oligodendrocyte hybridization intensity was measured at four ages, P2 (n = 3), P9 (n = 1), P20 (n = 2), and P30 (n = 2), both inside and on the borders of both rostral and caudal NL. The range of oligodendrocytes measured per age and location was 32–122 (mean 74.2 ± 24.3; n = 16). Oligodendrocytes at NL border have significantly greater PLP mRNA levels than those inside NL during the first three weeks posthatch (**Mann-Whitney rank-sum test; p < 0.001, except for the high frequency area at P09 where p = 0.013).
Oligodendrocyte density in NL increased throughout NL in the first month posthatch [Kruskal-Wallis one way ANOVA by ranks; p < 0.001, Fig. 8(A)]. The peak of myelination, indicated by the slope of oligodendrocyte density plot, occurred between the second and the third postnatal week for the high best frequency coding NL, and from the third to the fourth postnatal week for the low frequency coding NL. At the end of first month posthatch, oligodendrocyte density in NL reached adult levels (see next section).
Myelination of the auditory delay lines followed the tonotopic axis. Development of the auditory brainstem moved from rostro-medial NL (for high best frequency coding) to caudo-lateral NL (for low best frequency coding), and NM axons in the high best frequency region of NL matured earlier than those in the low frequency coding region of NL [Fig. 2(B,C)]. The same tonotopic pattern was observed in the production and development of oligodendrocytes in NL (Figs. 2 and 4), the upregulation of myelin-related genes, and the subsequent myelination of delay lines (Figs. 3, 5, and 6). Overall, the high best frequency coding NL developed a few days earlier than the low frequency coding NL, and this tonotopic difference persisted through third week posthatch [Mann-Whitney rank-sum test; p < 0.001, Figs. 6 and 8(B)].
Since the myelination pattern in the high best frequency coding NL did not change substantially between the third week and one month posthatch, we concluded that most if not all of the delay line myelination had occurred by the end of the first month posthatch. Thus, auditory delay lines appeared to be functionally mature towards the end of one month posthatch. This coincides with the time that the head stops growing, and the bird is no longer subject to changing interaural cues.
Oligodendrocytes Are Restricted from NL by a Developmentally Regulated Glial Barrier
We measured hybridization density inside and outside NL to determine whether oligodendrocytes in NL were newly generated from oligodendrocyte progenitors in NL, or whether they had migrated in from the NL border. We assumed that those oligodendrocytes that had migrated from the border into NL would have comparable PLP mRNA levels to oligodendrocytes at the NL border. On the other hand, if oligodendrocytes in NL were newly generated, they should express lower levels of PLP. PLP mRNA level, or hybridization intensity, was analyzed in oligodendrocytes on either side of the NL border [Fig. 8(B)]. In both high and low best frequency regions, the PLP mRNA levels of oligodendrocytes in NL were significantly lower than that of oligodendrocytes at NL border up to P20 (Mann-Whitney rank-sum test; p < 0.001, except for high frequency area at P9 where p = 0.013). By P30, the difference in PLP mRNA levels across NL border had decreased (Mann-Whitney test p = 0.339 for rostral NL, and p = 0.006 for caudal NL). The different PLP mRNA levels across NL border supported the hypothesis that oligodendrocytes in NL were less mature, and possibly newly generated by oligodendrocyte progenitors.
During early embryonic development, the O4 monoclonal antibody, which labels sulfated glycolipids of late stage multi-polar oligodendrocyte progenitors and early stage oligodendrocytes (Bansal et al., 1989), was used to identify oligodendrocyte progenitors. At E21, O4 labeled cells were present along NM axons, mainly in the proximal regions [Fig. 9(A)]. By E32, O4 labeled cells were present at the NL border, and some of them have entered the medial part of NL [Fig. 9(B)]. However, because O4 mainly labeled surface antigens on the processes of oligodendrocytes and their progenitors, it became difficult to identify individual cells. Since proliferation of oligodendrocyte progenitors was a late event compared to that of neurons and astrocytes, only oligodendrocyte progenitors were actively proliferating in the auditory brainstem at the time of hatching (Hardy, 1997; Parnavelas, 1999; Ross et al., 2003). Hence, proliferating oligodendrocyte progenitors after hatching could be identified by their ability to take up BrdU [Fig. 9(C–F)].
Figure 9.

Distribution pattern of oligodendrocyte progenitors in NL at P0. Immunohistochemistry with anti-O4 (A, B) and anti-BrdU (C–F) antibodies. At E21, O4-positive cells were present along the NM axons (A). At E32/P0, O4 labeled cells reached the NL border (B). Also, at E32/P0, BrdU labeled oligodendrocyte progenitors were evenly distributed in the high frequency coding NL (C). In the low frequency coding NL (D–F), while BrdU-labeled cells were evenly distributed in the medial part of NL (E), the distribution of BrdU-labeled cells were restricted to the border of the lateral NL (F). Scale bar: (B–D) 200 μm, (A, E, F) 50 μm.
Myelination began in rostral NL at about the time of hatching (Fig. 2), and we therefore examined BrdU uptake at P0 (n = 2). BrdU-labeled cells were evenly distributed in and around the highest best frequency region of NL [Fig. 9(C)]. In the caudal NL, labeled cells displayed a distribution pattern related to future tonotopic organization [Fig. 9(D)]. In NL, the tonotopic gradient is oblique to any transverse section (it runs from rostro-medial to caudolateral, Fig. 1) and thus each transverse section shows a gradient from higher best frequency (medial) to lower best frequency (lateral). Consistent with the rostro-caudal patterns of development observed above, the caudo-medial part of NL contained BrdU-labeled cells [Fig. 9(E)], similar to that of the high best frequency coding NL [Fig. 2(E)]. However, in the lateral part of NL, BrdU-labeled cells were generally not present in the nucleus, but were instead restricted to the NL border [Fig. 9(F)]. Since the distribution pattern of BrdU-labeled cells resembled that of oligodendrocytes in and around the caudal NL [Fig. 2(G)], it further suggested that oligodendrocytes in NL were newly generated by putative oligodendrocyte progenitors.
Taken together, we hypothesized that myelination of NM axons in NL was restricted by a developmentally regulated glial barrier that later decreased, allowing oligodendrocyte progenitors to migrate into NL and generate oligodendrocytes, which in turn myelinated delay line axons. Removal of this glial barrier should follow the tonotopic pattern, going from rostro-medial to the caudo-lateral NL, resulting in a temporal delay on the onset of myelination of NM axons between the high and low frequency coding NL.
Tenascin-C Is a Candidate for a Developmentally Regulated Glial Barrier in NL
Tenascins are a group of extracellular matrix glycoproteins that may contribute to the hypothesized glial barrier in NL. Two major forms of tenascins are expressed in the CNS: tenascin-C (TN-C) and tenascin-R (TN-R) (Fuss et al., 1993). TN-C is mainly produced by astrocytes and oligodendrocyte progenitors during embryonic development and is largely absent in the adult (Bartsch et al., 1992; Riou et al., 1992; Gotz et al., 1997; Garwood et al., 2004), while TN-R is absent during early embryonic development and is constitutively expressed by oligodendrocytes and their progenitors in the adult (Bartsch et al., 1993; Pesheva and Probstmeier, 2000; Pesheva et al., 2001).
The expression pattern of TN-C in the auditory brainstem was characterized after neurogenesis was complete, after E12 (Kubke et al., 2002, 2004). TN-C expression in NL was divided into four phases (Fig. 10). In phase one, between the second and third embryonic weeks (E14-19, n = 3), TN-C was found throughout the embryonic brainstem except the newly formed NL. At this time in development, axons from NM extended toward NL [Fig. 10(A,B)]. In phase two, at the end of the third embryonic week (E18-E24, n = 5), TN-C expression had extended into NL [Fig. 10(C,D)]. While TN-C expression levels were high in NL, its levels outside NL began to decline in the fourth embryonic week. At this time in development, NM axons had reached NL, NL had expanded from a single layer cluster to a dispersed multi-layer structure, and synaptogenesis occurred in the expanded NL (Kubke et al., 2002), and myelination of NM axons proceeded from proximal to distal regions [Fig. 2(A–D)]. Moreover, there was a correlation between TN-C immunoreactivity in NL and NL expansion, suggesting that TN-C might play a role when NL expands from the compact layer observed early in development. In phase three, at the end of the fourth embryonic week (E24-E28, n = 6), TN-C expression remained high in NL, but declined outside NL [Fig. 10(E,F)]. During this period, NM axons were myelinated up to the NL border (Fig. 2), and synaptogenesis in NL appeared to be complete (Kubke et al., 2002). In phase four, around the time of hatching (E28-E32/P0-P7; n = 7), TN-C levels decreased in NL. The decrease in TN-C expression followed the rostral to caudal gradient described above. By the time of hatching, TN-C was no longer detected in the rostromedial part of NL but remained in the caudolateral part [Fig. 10(G,H)]. By P7, TN-C expression was no longer detectable in NL (n = 1, data not shown). In the first week posthatch, myelination of the NM axons in NL began, and the numbers of oligodendrocytes increased in NL (Figs. 3 and 4).
Figure 10.

Development of Tenascin-C (TN-C) in the auditory brainstem. Immunohistochemistry with M1-B4 (anti-TN-C) antibody. At E17, strong TN-C expression was found in the auditory brainstem, but not in NL (A, B). At E23, TN-C immunoreactivity appeared in NL, and declined outside NL (C, D). At E27, TN-C remained in NL, but was no longer detected outside NL (E, F). At E32/P0, weak TN-C expression was observed in the lateral but not medial region of caudal NL (G, H). M: the medial part of NL; L: the lateral part of NL. Scale bar: (A, E, G) 200 μm, (B, C, F, H) 50 μm and (D) 25 μm.
DISCUSSION
Myelination is generally early and synchronous from the cochlear nerve to the inferior colliculus. This synchronous myelination underlies the establishment of the auditory brainstem response (Moore et al., 1995). An exception to this rule is the delay in the myelination of delay line axons in the brainstem circuit used for computation of ITD. Myelination of the delay line circuit coincides with the period of head growth, and attainment of stable ITD cues (Figs. 11 and 12).
Figure 11.
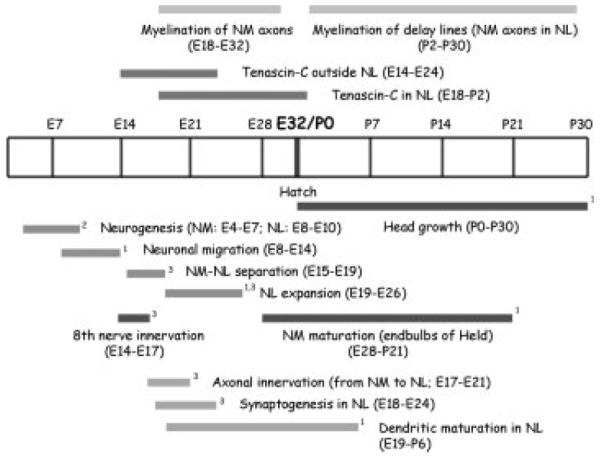
Developmental timeline of auditory brainstem in barn owls. The timelines for myelination and tenascin-C expression in the auditory brainstem were compared to other developmental events in the nucleus magnocellularis (NM) and nucleus Laminaris (NL) between embryonic stages (E) and one month posthatch (P30). The diagram summarizes the results of this study and others. (1Kubke and Carr, 2000; 2Kubke et al., 2004; 3Kubke et al., 2002).
Plasticity and the Late Onset of Myelination
The late onset of myelination may underlie the formation of short (about 60 μm) internodes within NL, which in turn would produce the slower conduction velocity that characterizes the delay line circuit axons in NL (Carr and Konishi, 1990). A similar scenario occurs during cortical expansion, where regional differences in the degree of myelination alter the conduction velocity along thalamocortical fibers to preserve the timing of thalamic inputs (Salami et al., 2003). In peripheral nerve, internodal distances are decided by the degree of axonal elongation after the onset of myelination (Friede et al., 1981; Hildebrand et al., 1996). Once myelination has started, no more oligodendrocytes are added, and the existing oligodendrocytes respond to the axonal growth with elongation, which extends the internodal distance (Hildebrand et al., 1989). Therefore, the timing of myelination with respect to axonal elongation contributes to the final internodal distance. In the auditory brainstem, oligodendrocytes do not appear in NL until first week posthatch, and the peak of myelination is in the second and third postnatal weeks. This is when NL and the incoming delay lines expand to reach the adult depth of about 700 μm (Carr and Boudreau, 1993; Kubke and Carr, 2000). Thus growth of the delay line portion of the NM axons is largely complete by the peak of the myelination of the delay line axons. The short internodes may be a consequence of the relative timing of axonal elongation and myelination in this system. Furthermore, auditory brainstem responses in barn owls are first detectable at P4 (Kubke and Carr, 2000). Thus, auditory responses are present at the time that auditory delay lines axons in NL begin to be myelinated. We hypothesize that the timing of myelination during development provides the adjustments in conduction velocity needed for simultaneous activation of NL coincidence detector neurons (Leibold et al., 2002).
Axons generally grow into their targets and form connections before they are myelinated. Therefore, myelination in NL may also be affected by the electrical activity and/or signals of delay line axons. For example, adenosine promotes differentiation of oligodendrocytes and myelination in an activity-dependent manner (Stevens et al., 2002). In addition, axon-derived signals like F3/contactin acts through Notch/Deltex1 signaling cascade to promote oligodendrocyte differentiation and myelination (Hu et al., 2003). On the other hand, negative axonal signals like jagged1 (Blaschuk and ffrench-Constant, 1998; Wang et al., 1998; Bongarzone et al., 2000) and polysialylated-neural cell adhesion molecule (PSA-NCAM, Charles et al., 2000) act as inhibitors of myelination in oligodendrocytes. Furthermore, in the barn owl, the timing of myelination of delay line axons coincides with the establishment of stable ITD cues, raising the question of whether the late myelination of NM axons in NL permits the delay line circuit to adjust to changing ITDs. There is a growing body of evidence that myelination reduces the ability of neuronal repair, and the suppression of myelination might extend the permissive period for repair (Kapfhammer et al., 1992; Keirstead et al., 1992; Ghooray and Martin, 1993; Varga et al., 1995). In addition, CNS myelin provides a non-permissive substrate for neurite outgrowth, while oligodendrocytes produce several neurite inhibitors like Nogo-A, myelin-associated glycoprotein, oligodendrocyte myelin glycoprotein, and ephrin-B3 that inhibit growth cone mobility and fiber growth (Benson et al., 2005; for reviews see Tessier-Lavigne and Goodman, 2000; Schwab et al., 2006). Antagonists of known neurite inhibitors neutralize the inhibitory effect of CNS myelin, resulting in significant axon regeneration and improved functional recovery (Merkler et al., 2001; Li et al., 2004; Liebscher et al., 2005). Therefore, it is possible that electrical activity affects myelination, and that myelination acts to reduce plasticity in neural circuits such as the map of ITD.
The myelination of delay line axons in NL coincides not only with the period of head growth and changing ITDs, but also with the functional maturation of the auditory brainstem and the development of ITD tuning in NL (Carr, 1995). At P21, auditory brainstem responses and neurophonic tuning to ITD are present, though not yet adult-like (Carr et al., 1998; Kubke and Carr, 2000), suggesting that owls are able to localize sound at this age. Studies from juvenile owls fitted with acoustic filtering devices suggest that the developmental adjustments required for ITD tuning continue to take place after P25 (Gold and Knudsen, 2000a,b; DeBello et al., 2001). Hence, myelination of delay line axons may stabilize the ITD map in NL. The late myelination of the delay line axons may allow the owl to adjust to changing auditory cues during the first month posthatch.
Developmental Regulation of Tenascin-C
Tenascin-C (TN-C) expression changes during the development of the auditory brainstem in NL, and might act as a barrier for oligodendrocyte progenitors, preventing them from entering NL. Changes in TN-C expression are correlated with several morphogenetic changes in barn owl NL, which undergoes developmental reorganization in the embryo (summarized in Fig. 11). Early in embryonic development, the owl’s auditory brainstem exhibits morphology similar to the developing chicken NL, with bitufted NL neurons organized in compact laminar organization (Kubke et al., 2002). Later, the owl and chicken patterns of NL organization diverge, and the owl’s NL undergoes secondary morphogenesis during which the compact, chicken-like laminar organization of NL is lost, and synapses are redistributed [compare Fig. 10(A,B) and Fig. 10(E,F)]. These events lead to the restructuring of the ITD coding circuit and the reorganization of the map of ITDs and azimuthal space (Kubke et al., 2002).
In early development of NL, when NL is organized into a compact lamina, TN-C immunoreactivity was high surrounding NL, and low or absent inside NL [phase one, Fig. 10(A,B)]. At this time, NM axons made synapses on the distal dendrites of NL (Kubke et al., 2002). TN-C levels in NL increased during the secondary morphogenetic phase when the compact, chicken-like laminar organization of NL was lost, and synapses were redistributed towards the NL cell bodies (Kubke et al., 2002), meanwhile, TN-C began to decline outside NL [Fig. 10(C,D)]. In phase three, TN-C had disappeared from outside NL and myelination of NM axons proceeded toward NL [Figs. 10(E,F) and 2(D)]. TN-C expression in NL gradually declined in the last embryonic week (phase four), and NM axons within NL remained unmyelinated [Fig. 2(G)]. At the time of hatching (E32/P0), TN-C had disappeared from most of NL and can only be seen at the lateral end of caudal NL [Fig. 10(G,H)]. By comparison, although oligodendrocyte progenitors were evenly distributed in the medial part of NL [Fig. 9(E)], they were restricted to the border of the lateral part of caudal NL [Fig. 9(F)]. Thus, the expression pattern of TN-C was inversely related to the distribution pattern of oligodendrocyte progenitors, and to the myelination progress of NM axons, leading to the hypothesis that TN-C in NL might contribute to a barrier for oligodendrocyte progenitors.
TN-C inhibits migration of oligodendrocyte progenitors both in vitro and in vivo (Frost et al., 1996; Kiernan et al., 1996; Garcion et al., 2001). Studies from oligodendrocyte progenitor cell line CG-4 cells and from rat primary oligodendrocyte progenitor cultures indicate that TN-C induced the accumulation of β-catenin at focal adhesions, which makes cells less mobile (Kakinuma et al., 2004). In addition, TN-C is widely expressed in early stages of CNS development, and is downregulated after maturation (Bartsch et al., 1992). In NL, the increase of TN-C immunoreactivity occurs around the third embryonic week, just after NM axons have innervated NL [Figs. 11 and 12(D)].
Similar developmental timetables are found in the olfactory bulb where the formation of TN-C around glomeruli depends on the olfactory axons (Gonzalez and Silver, 1994), and in the midbrain substantia nigra, where tenascins are upregulated by nigrostriatal axons (O’Brien et al., 1992; Gates et al., 1993). In vitro, TN-C expression can be upregulated by the homeobox family of proteins like Evx-1 (Jones et al., 1992), as well as by cytokines like PDGF and bFGF (Meiners et al., 1993; Tucker, 1993; LaFleur et al., 1994; Jinnin et al., 2006), and by β3 integrin-mediated mitogen activated protein (MAP) signal pathways (Jones et al., 1999). Hence, NM axons may induce TN-C expression in NL via stimulants like homeobox transcription factors and cytokines, or through integrin-mediated axonal-glial interactions. Alternatively, TN-C may be transported into NL by tenascin-binding proteins (Perez and Halfter, 1994) that are upregulated by NM axons in the auditory brainstem.
Downregulation of TN-C in NL occurred after synaptogenesis in NL [Kubke et al., 2002; Fig. 12(G,H)], and followed a tonotopic pattern, where rostro-medial NL (the future high frequency coding area) led expression in caudo-lateral NL, the future low best frequency coding area. Similar TN-C gradients are found in the late embryonic and early postnatal stages in striatum (O’Brien et al., 1992) and in hippocampus (Ferhat et al., 1996). TN-C is recognized as a mediator of neuronal-glial interactions, and downregulation of TN-C is an indicator for functional maturation (Mitrovic et al., 1994; Ferhat et al., 1996). In addition, TN-C is involved in the regulation of synaptic plasticity and efficacy (Evers et al., 2002; Strekalova et al., 2002), and may be downregulated by growth hormones such as thyroid hormone, and by NMDA-dependent neuronal activity in the developing CNS (Mitrovic et al., 1996; Alvarez-Dolado et al., 1998).
The developmental events in the auditory brainstem are summarized in Figure 11. And the general sequence of events is hypothesized to be (Fig. 12): (A) Dorsal cell mass formed in the auditory brainstem after neuronal migration (E8-E14); (B) Separation of NM and NL neurons (E15-19); (C) NM axons extend through TN-C to reach NL (E17-21); (D) Myelination of NM axons starts at the proximal ends, and the axonal activity upregulates TN-C expression in NL (E18-); (E) TN-C acts to detach NL neurons from their substrate during NL expansion (E19-26) and synaptogenesis in NL begins (E18-); (F) TN-C expression is downregulated in the region outside NL (−E24). Synaptogenesis in NL completed (−E24). NM axons are myelinated from proximal to distal ends; (G) NM axons are myelinated up to the NL border (−E28). Delay line circuitry is established (−E28); (H) TN-C is downregulated by the activity of the delay line axons in NL (−P2), allowing dendritic reorganization in NL and myelination of delay line axons to begin.
In conclusion, myelination of auditory delay line axons in NL is delayed with respect to the proximal portion of the NM axons. This late onset of myelination is correlated with the shortened internodal distance of delay line axons in NL. We hypothesize that a developmentally regulated glial barrier restricts oligodendrocyte precursor migration into NL, and prevents early myelination of delay line axons.
Acknowledgments
The authors thank Dr. Klaus Nave for providing the chicken PLP cDNA clone. This work was supported by an award from The National Organization for Hearing Research (NOHR) to SMC.
Contract grant sponsor: NIH; contract grant number: DCD00436.
REFERENCES
- Alvarez-Dolado M, Gonzalez-Sancho JM, Bernal J, Munoz A. Developmental expression of the tenascin-C is altered by hypothyroidism in the rat brain. Neuroscience. 1998;84:309–322. doi: 10.1016/s0306-4522(97)00511-3. [DOI] [PubMed] [Google Scholar]
- Bansal R, Warrington AE, Gard AL, Ranscht B, Pfeiffer SE. Multiple and novel specificities of monoclonal antibodies O1, O4, and R- mAb used in the analysis of oligodendrocyte development. J Neurosci Res. 1989;24:548–557. doi: 10.1002/jnr.490240413. [DOI] [PubMed] [Google Scholar]
- Bartsch U, Bartsch S, Dorries U, Schachner M. Immunohistological localization of tenascin in the developing and lesioned adult mouse optic nerve. Eur J Neurosci. 1992;4:338–352. doi: 10.1111/j.1460-9568.1992.tb00881.x. [DOI] [PubMed] [Google Scholar]
- Bartsch U, Pesheva P, Raff M, Schachner M. Expression of janusin (J1–160/180) in the retina and optic nerve of the developing and adult mouse. Glia. 1993;9:57–69. doi: 10.1002/glia.440090108. [DOI] [PubMed] [Google Scholar]
- Benson MD, Romero MI, Lush ME, Lu QR, Henkemeyer M, Parada LF. Ephrin-B3 is a myelin-based inhibitor of neurite outgrowth. Proc Natl Acad Sci USA. 2005;102:10694–10699. doi: 10.1073/pnas.0504021102. [DOI] [PMC free article] [PubMed] [Google Scholar]
- Blaschuk KL, ffrench-Constant C. Developmental neurobiology: Notch is tops in the developing brain. Curr Biol. 1998;8:R334–R337. doi: 10.1016/s0960-9822(98)70215-5. [DOI] [PubMed] [Google Scholar]
- Bongarzone ER, Byravan S, Givogri MI, Schonmann V, Campagnoni AT. Platelet-derived growth factor and basic fibroblast growth factor regulate cell proliferation and the expression of notch-1 receptor in a new oligodendrocyte cell line. J Neurosci Res. 2000;62:319–328. doi: 10.1002/1097-4547(20001101)62:3<319::AID-JNR1>3.0.CO;2-G. [DOI] [PubMed] [Google Scholar]
- Brill MH, Waxman SG, Moore JW, Joyner RW. Conduction velocity and spike configuration in myelinated fibres: Computed dependence on internode distance. J Neurol Neurosurg Psychiatry. 1977;40:769–774. doi: 10.1136/jnnp.40.8.769. [DOI] [PMC free article] [PubMed] [Google Scholar]
- Carr CE. The development of nucleus laminaris in the barn owl. In: Manley GA, Klump GM, Koppl C, Fastl H, Oekinghaus H, editors. Advances in Hearing Research, Proceedings of the 10th International Sysposium on Hearing. World Scientific Publishers; Singapore: 1995. pp. 24–31. [Google Scholar]
- Carr CE, Boudreau RE. Central projections of auditory nerve fibers in the barn owl. J Comp Neurol. 1991;314:306–318. doi: 10.1002/cne.903140208. [DOI] [PubMed] [Google Scholar]
- Carr CE, Boudreau RE. Organization of the nucleus magnocellularis and the nucleus laminaris in the barn owl: Encoding and measuring interaural time differences. J Comp Neurol. 1993;334:337–355. doi: 10.1002/cne.903340302. [DOI] [PubMed] [Google Scholar]
- Carr CE, Konishi M. A circuit for detection of interaural time differences in the brainstem of the barn owl. J Neurosci. 1990;10:3227–3246. doi: 10.1523/JNEUROSCI.10-10-03227.1990. [DOI] [PMC free article] [PubMed] [Google Scholar]
- Carr CE, Kubke MF, Massoglia DP, Cheng SM, Rigby L, Moiseff A. Development of temporal coding circuits in the barn owl. In: Palmer AR, Rees A, Summerfield QA, Meddis R, editors. Psychophysical and Physiological Advances in Hearing. Whurr Publishers; London: 1998. pp. 344–351. [Google Scholar]
- Charles P, Hernandez MP, Stankoff B, Aigrot MS, Colin C, Rougon G, Zalc B, Lubetzki C. Negative regulation of central nervous system myelination by polysialylated-neural cell adhesion molecule. Proc Natl Acad Sci USA. 2000;97:7585–7590. doi: 10.1073/pnas.100076197. [DOI] [PMC free article] [PubMed] [Google Scholar]
- Cheng SM, Carr CE. The role of myelination in the development of nucleus laminaris in the barn owl. Mol Biol Hearing and Deafness, La Jolla, CA. 1992. (abstract)
- DeBello WM, Feldman DE, Knudsen EI. Adaptive axonal remodeling in the midbrain auditory space map. J Neurosci. 2001;21:3161–3174. doi: 10.1523/JNEUROSCI.21-09-03161.2001. [DOI] [PMC free article] [PubMed] [Google Scholar]
- Evers MR, Salmen B, Bukalo O, Rollenhagen A, Bosl MR, Morellini F, Bartsch U, Dityatev A, Schachner M. Impairment of L-type Ca2+ channel-dependent forms of hippocampal synaptic plasticity in mice deficient in the extracellular matrix glycoprotein tenascin-C. J Neurosci. 2002;22:7177–7194. doi: 10.1523/JNEUROSCI.22-16-07177.2002. [DOI] [PMC free article] [PubMed] [Google Scholar]
- Ferhat L, Chevassus au Louis N, Jorquera I, Niquet J, Khrestchatisky M, Ben-Ari Y, Represa A. Transient increase of tenascin-C in immature hippocampus: Astroglial and neuronal expression. J Neurocytol. 1996;25:53–66. doi: 10.1007/BF02284785. [DOI] [PubMed] [Google Scholar]
- Friede RL, Meier T, Diem M. How is the exact length of an internode determined. J Neurol Sci. 1981;50:217–228. doi: 10.1016/0022-510x(81)90168-4. [DOI] [PubMed] [Google Scholar]
- Frost E, Kiernan BW, Faissner A, ffrench-Constant C. Regulation of oligodendrocyte precursor migration by extracellular matrix: Evidence for substrate-specific inhibition of migration by tenascin-C. Dev Neurosci. 1996;18:266–273. doi: 10.1159/000111416. [DOI] [PubMed] [Google Scholar]
- Fuss B, Wintergerst ES, Bartsch U, Schachner M. Molecular characterization and in situ mRNA localization of the neural recognition molecule J1-160/180: A modular structure similar to tenascin. J Cell Biol. 1993;120:1237–1249. doi: 10.1083/jcb.120.5.1237. [DOI] [PMC free article] [PubMed] [Google Scholar]
- Garcion E, Faissner A, ffrench-Constant C. Knockout mice reveal a contribution of the extracellular matrix molecule tenascin-C to neural precursor proliferation and migration. Development. 2001;128:2485–2496. doi: 10.1242/dev.128.13.2485. [DOI] [PubMed] [Google Scholar]
- Garwood J, Garcion E, Dobbertin A, Heck N, Calco V, ffrench-Constant C, Faissner A. The extracellular matrix glycoprotein Tenascin-C is expressed by oligodendrocyte precursor cells and required for the regulation of maturation rate, survival and responsiveness to platelet-derived growth factor. Eur J Neurosci. 2004;20:2524–2540. doi: 10.1111/j.1460-9568.2004.03727.x. [DOI] [PubMed] [Google Scholar]
- Gates MA, O’Brien TF, Faissner A, Steindler DA. Neuron-glial interactions during the in vivo and in vitro development of the nigrostriatal circuit. J Chem Neuroanat. 1993;6:179–189. doi: 10.1016/0891-0618(93)90040-b. [DOI] [PubMed] [Google Scholar]
- Ghooray GT, Martin GF. The development of myelin in the spinal cord of the North American opossum and its possible role in loss of rubrospinal plasticity. A study using myelin basic protein and galactocerebroside immuno-histochemistry. Brain Res Dev Brain Res. 1993;72:67–74. doi: 10.1016/0165-3806(93)90160-c. [DOI] [PubMed] [Google Scholar]
- Gold JI, Knudsen EI. A site of auditory experience-dependent plasticity in the neural representation of auditory space in the barn owl’s inferior colliculus. J Neurosci. 2000a;20:3469–3486. doi: 10.1523/JNEUROSCI.20-09-03469.2000. [DOI] [PMC free article] [PubMed] [Google Scholar]
- Gold JI, Knudsen EI. Abnormal auditory experience induces frequency-specific adjustments in unit tuning for binaural localization cues in the optic tectum of juvenile owls. J Neurosci. 2000b;20:862–877. doi: 10.1523/JNEUROSCI.20-02-00862.2000. [DOI] [PMC free article] [PubMed] [Google Scholar]
- Gonzalez ML, Silver J. Axon-glia interactions regulate ECM patterning in the postnatal rat olfactory bulb. J Neurosci. 1994;14:6121–6131. doi: 10.1523/JNEUROSCI.14-10-06121.1994. [DOI] [PMC free article] [PubMed] [Google Scholar]
- Gotz M, Bolz J, Joester A, Faissner A. Tenascin-C synthesis and influence on axonal growth during rat cortical development. Eur J Neurosci. 1997;9:496–506. doi: 10.1111/j.1460-9568.1997.tb01627.x. [DOI] [PubMed] [Google Scholar]
- Grinspan J, Wrabetz L, Kamholz J. Oligodendrocyte maturation and myelin gene expression in PDGF-treated cultures from rat cerebral white matter. J Neurocytol. 1993;22:322–333. doi: 10.1007/BF01195556. [DOI] [PubMed] [Google Scholar]
- Hardy RJ. Dorsoventral patterning and oligodendroglial specification in the developing central nervous system. J Neurosci Res. 1997;50:139–145. doi: 10.1002/(SICI)1097-4547(19971015)50:2<139::AID-JNR3>3.0.CO;2-G. [DOI] [PubMed] [Google Scholar]
- Haresign T, Moiseff A. Early growth and development of the common barn-owl’s facial ruff. The Auk. 1988;105:699–705. [Google Scholar]
- Hildebrand C, Loeliger S, Bjartmar C, Karlsson M. Sheath lengths of large motor axons in the ventral root L5 of neonatal and adult rats. Neurosci Lett. 1996;202:173–176. doi: 10.1016/0304-3940(95)12242-7. [DOI] [PubMed] [Google Scholar]
- Hildebrand C, Westerberg M, Mustafa GY. Influence of an experimental hindlimb maldevelopment on axon number and nodal spacing in the rat sciatic nerve. Brain Res Dev Brain Res. 1989;50:169–175. doi: 10.1016/0165-3806(89)90192-2. [DOI] [PubMed] [Google Scholar]
- Hu QD, Ang BT, Karsak M, Hu WP, Cui XY, Duka T, Takeda Y, Chia W, Sankar N, Ng YK, Ling EA, Maciag T, Small D, Trifonova R, Kopan R, Okano H, Nakafuku M, Chiba S, Hirai H, Aster JC, Schachner M, Pallen CJ, Watanabe K, Xiao ZC. F3/contactin acts as a functional ligand for Notch during oligodendrocyte maturation. Cell. 2003;115:163–175. doi: 10.1016/s0092-8674(03)00810-9. [DOI] [PubMed] [Google Scholar]
- Jackson H, Parks TN. Functional synapse elimination in the developing avian cochlear nucleus with simultaneous reduction in cochlear nerve axon branching. J Neurosci. 1982;2:1736–1743. doi: 10.1523/JNEUROSCI.02-12-01736.1982. [DOI] [PMC free article] [PubMed] [Google Scholar]
- Jinnin M, Ihn H, Asano Y, Yamane K, Trojanowska M, Tamaki K. Platelet derived growth factor induced tenascin-C transcription is phosphoinositide 3-kinase/Akt-dependent and mediated by Ets family transcription factors. J Cell Physiol. 2006;206:718–727. doi: 10.1002/jcp.20527. [DOI] [PubMed] [Google Scholar]
- Jones FS, Prediger EA, Bittner DA, De Robertis EM, Edelman GM. Cell adhesion molecules as targets for Hox genes: Neural cell adhesion molcule promoter activity is modulated with cotranfection with Hox-2.5 and -2.4. Proc Natl Acad Sci USA. 1992;89:2086–2090. doi: 10.1073/pnas.89.6.2086. [DOI] [PMC free article] [PubMed] [Google Scholar]
- Jones PL, Jones FS, Zhou B, Rabinovitch M. Induction of vascular smooth muscle cell tenascin-C gene expression by denatured type I collagen is dependent upon a beta3 integrin-mediated mitogen-activated protein kinase pathway and a 122-base pair promoter element. J Cell Sci. 1999;112(Pt 4):435–445. doi: 10.1242/jcs.112.4.435. [DOI] [PubMed] [Google Scholar]
- Kakinuma Y, Saito F, Osawa S, Miura M. A mechanism of impaired mobility of oligodendrocyte progenitor cells by tenascin C through modification of wnt signaling. FEBS Lett. 2004;568:60–64. doi: 10.1016/j.febslet.2004.05.022. [DOI] [PubMed] [Google Scholar]
- Kapfhammer JP, Schwab ME, Schneider GE. Antibody neutralization of neurite growth inhibitors from oligodendrocytes results in expanded pattern of postnatally sprouting retinocollicular axons. J Neurosci. 1992;12:2112–2119. doi: 10.1523/JNEUROSCI.12-06-02112.1992. [DOI] [PMC free article] [PubMed] [Google Scholar]
- Keirstead HS, Hasan SJ, Muir GD, Steeves JD. Suppression of the onset of myelination extends the permissive period for the functional repair of embryonic spinal cord. Proc Natl Acad Sci USA. 1992;89:11664–11668. doi: 10.1073/pnas.89.24.11664. [DOI] [PMC free article] [PubMed] [Google Scholar]
- Keita M, Magy L, Heape A, Richard L, Piaser M, Vallat JM. Immunocytological studies of L-MAG expression regulation during myelination of embryonic brain cell cocultures. Dev Neurosci. 2002;24:495–503. doi: 10.1159/000069360. [DOI] [PubMed] [Google Scholar]
- Kiernan BW, Gotz B, Faissner A, ffrench-Constant C. Tenascin-C inhibits oligodendrocyte precursor cell migration by both adhesion-dependent and adhesion-independent mechanisms. Mol Cell Neurosci. 1996;7:322–335. doi: 10.1006/mcne.1996.0024. [DOI] [PubMed] [Google Scholar]
- Konishi M. Coding of auditory space. Annu Rev Neurosci. 2003;26:31–55. doi: 10.1146/annurev.neuro.26.041002.131123. [DOI] [PubMed] [Google Scholar]
- Köppl C, Futterer E, Nieder B, Sistermann R, Wagner H. Embryonic and posthatching development of the barn owl (Tyto alba): Reference data for age determination. Dev Dyn. 2005;233:1248–1260. doi: 10.1002/dvdy.20394. [DOI] [PubMed] [Google Scholar]
- Kubke MF, Carr CE. Development of the auditory brainstem of birds: Comparison between barn owls and chickens. Hear Res. 2000;147:1–20. doi: 10.1016/s0378-5955(00)00116-7. [DOI] [PubMed] [Google Scholar]
- Kubke MF, Massoglia DP, Carr CE. Developmental changes underlying the formation of the specialized time coding circuits in barn owls (Tyto alba) J Neurosci. 2002;22:7671–7679. doi: 10.1523/JNEUROSCI.22-17-07671.2002. [DOI] [PMC free article] [PubMed] [Google Scholar]
- Kubke MF, Massoglia DP, Carr CE. Bigger brains or bigger nuclei? Regulating the size of auditory structures in birds. Brain Behav Evol. 2004;63:169–180. doi: 10.1159/000076242. [DOI] [PMC free article] [PubMed] [Google Scholar]
- LaFleur DW, Fagin JA, Forrester JS, Rubin SA, Sharifi BG. Cloning and characterization of alternatively spliced isoforms of rat tenascin. Platelet-derived growth factor-BB markedly stimulates expression of spliced variants of tenascin mRNA in arterial smooth muscle cells. J Biol Chem. 1994;269:20757–20763. [PubMed] [Google Scholar]
- Leibold C, Kempter R, van Hemmen JL. How spiking neurons give rise to a temporal-feature map: from synaptic plasticity to axonal selection. Phys Rev E Stat Nonlin Soft Matter Phys. 2002;65:051915. doi: 10.1103/PhysRevE.65.051915. [DOI] [PubMed] [Google Scholar]
- Li W, Walus L, Rabacchi SA, Jirik A, Chang E, Schauer J, Zheng BH, Benedetti NJ, Liu BP, Choi E, Worley D, Silvian L, Mo W, Mullen C, Yang W, Strittmatter SM, Sah DW, Pepinsky B, Lee DH. A neutralizing anti-Nogo66 receptor monoclonal antibody reverses inhibition of neurite outgrowth by central nervous system myelin. J Biol Chem. 2004;279:43780–43788. doi: 10.1074/jbc.M401803200. [DOI] [PubMed] [Google Scholar]
- Liebscher T, Schnell L, Schnell D, Scholl J, Schneider R, Gullo M, Fouad K, Mir A, Rausch M, Kindler D, Hamers FP, Schwab ME. Nogo-A antibody improves regeneration and locomotion of spinal cord-injured rats. Ann Neurol. 2005;58:706–719. doi: 10.1002/ana.20627. [DOI] [PubMed] [Google Scholar]
- Martini R, Schachner M. Immunoelectron microscopic localization of neural cell adhesion molecules (L1, N-CAM, and MAG) and their shared carbohydrate epitope and myelin basic protein in developing sciatic nerve. J Cell Biol. 1986;103:2439–2448. doi: 10.1083/jcb.103.6.2439. [DOI] [PMC free article] [PubMed] [Google Scholar]
- Meiners S, Marone M, Rittenhouse JL, Geller HM. Regulation of astrocytic tenascin by basic fibroblast growth factor. Dev Biol. 1993;160:480–493. doi: 10.1006/dbio.1993.1322. [DOI] [PubMed] [Google Scholar]
- Merkler D, Metz GA, Raineteau O, Dietz V, Schwab ME, Fouad K. Locomotor recovery in spinal cord-injured rats treated with an antibody neutralizing the myelin-associated neurite growth inhibitor Nogo-A. J Neurosci. 2001;21:3665–3673. doi: 10.1523/JNEUROSCI.21-10-03665.2001. [DOI] [PMC free article] [PubMed] [Google Scholar]
- Mitrovic N, Dorries U, Schachner M. Expression of the extracellular matrix glycoprotein tenascin in the somatosensory cortex of the mouse during postnatal development: An immunocytochemical and in situ hybridization analysis. J Neurocytol. 1994;23:364–378. doi: 10.1007/BF01666526. [DOI] [PubMed] [Google Scholar]
- Mitrovic N, Mohajeri H, Schachner M. Effects of NMDA receptor blockade in the developing rat somato-sensory cortex on the expression of the glia-derived extracellular matrix glycoprotein tenascin-C. Eur J Neurosci. 1996;8:1793–1802. doi: 10.1111/j.1460-9568.1996.tb01323.x. [DOI] [PubMed] [Google Scholar]
- Moiseff A, Konishi M. Neuronal and behavioral sensitivity to binaural time differences in the owl. J Neurosci. 1981;1:40–48. doi: 10.1523/JNEUROSCI.01-01-00040.1981. [DOI] [PMC free article] [PubMed] [Google Scholar]
- Moore JK, Perazzo LM, Braun A. Time course of axonal myelination in the human brainstem auditory pathway. Hear Res. 1995;87:21–31. doi: 10.1016/0378-5955(95)00073-d. [DOI] [PubMed] [Google Scholar]; Hear Res. 1995;91:208–209. Published erratum appears in. [Google Scholar]
- Nakahara J, Takemura M, Gomi H, Tsunematsu K, Itohara S, Asou H, Ogawa M, Aiso S, Tan-Takeuchi K. Role of radial fibers in controlling the onset of myelination. J Neurosci Res. 2003;72:279–289. doi: 10.1002/jnr.10593. [DOI] [PubMed] [Google Scholar]
- Nave KA, Lai C, Bloom FE, Milner RJ. Splice site selection in the proteolipid protein (PLP) gene transcript and primary structure of the DM-20 protein of central nervous system myelin. Proc Natl Acad Sci USA. 1987;84:5665–5669. doi: 10.1073/pnas.84.16.5665. [DOI] [PMC free article] [PubMed] [Google Scholar]
- Nave KA, Milner RJ. Proteolipid proteins: Structure and genetic expression in normal and myelin-deficient mutant mice. Crit Rev Neurobiol. 1989;5:65–91. [PubMed] [Google Scholar]
- O’Brien TF, Faissner A, Schachner M, Steindler DA. Afferent-boundary interactions in the developing neostriatal mosaic. Brain Res Dev Brain Res. 1992;65:259–267. doi: 10.1016/0165-3806(92)90187-2. [DOI] [PubMed] [Google Scholar]
- Parnavelas JG. Glial cell lineages in the rat cerebral cortex. Exp Neurol. 1999;156:418–429. doi: 10.1006/exnr.1999.7044. [DOI] [PubMed] [Google Scholar]
- Perez RG, Halfter W. Tenascin protein and mRNA in the avian visual system: Distribution and potential contribution to retinotectal development. Perspect Dev Neurobiol. 1994;2:75–87. [PubMed] [Google Scholar]
- Pesheva P, Gloor S, Probstmeier R. Tenascin-R as a regulator of CNS glial cell function. Prog Brain Res. 2001;132:103–114. doi: 10.1016/S0079-6123(01)32069-1. [DOI] [PubMed] [Google Scholar]
- Pesheva P, Probstmeier R. The yin and yang of tenascin-R in CNS development and pathology. Prog Neurobiol. 2000;61:465–493. doi: 10.1016/s0301-0082(99)00061-1. [DOI] [PubMed] [Google Scholar]
- Poganiatz I, Nelken I, Wagner H. Sound-localization experiments with barn owls in virtual space: Influence of interaural time difference on head-turning behavior. J Assoc Res Otolaryngol. 2001;2:1–21. doi: 10.1007/s101620010039. [DOI] [PMC free article] [PubMed] [Google Scholar]
- Rich V, Carr C. Husbandry and captive rearing of barn owls. Poultry Avian Biol Rev. 1999;10:91–95. [Google Scholar]
- Riou JF, Umbhauer M, Shi DL, Boucaut JC. Tenascin: A potential modulator of cell-extracellular matrix interactions during vertebrate embryogenesis. Biol Cell. 1992;75:1–9. doi: 10.1016/0248-4900(92)90118-k. [DOI] [PubMed] [Google Scholar]
- Ross SE, Greenberg ME, Stiles CD. Basic helix-loop-helix factors in cortical development. Neuron. 2003;39:13–25. doi: 10.1016/s0896-6273(03)00365-9. [DOI] [PubMed] [Google Scholar]
- Salami M, Itami C, Tsumoto T, Kimura F. Change of conduction velocity by regional myelination yields constant latency irrespective of distance between thalamus and cortex. Proc Natl Acad Sci USA. 2003;100:6174–6179. doi: 10.1073/pnas.0937380100. [DOI] [PMC free article] [PubMed] [Google Scholar]
- Schwab JM, Tuli SK, Failli V. The Nogo receptor complex: Confining molecules to molecular mechanisms. Trends Mol Med. 2006;12:293–297. doi: 10.1016/j.molmed.2006.05.001. [DOI] [PubMed] [Google Scholar]
- Shiota C, Miura M, Mikoshiba K. Developmental profile and differential localization of mRNAs of myelin proteins (MBP and PLP) in oligodendrocytes in the brain and in culture. Brain Res Dev Brain Res. 1989;45:83–94. doi: 10.1016/0165-3806(89)90010-2. [DOI] [PubMed] [Google Scholar]
- Stevens B, Porta S, Haak LL, Gallo V, Fields RD. Adenosine: a neuron-glial transmitter promoting myelination in the CNS in response to action potentials. Neuron. 2002;36:855–868. doi: 10.1016/s0896-6273(02)01067-x. [DOI] [PMC free article] [PubMed] [Google Scholar]
- Strekalova T, Sun M, Sibbe M, Evers M, Dityatev A, Gass P, Schachner M. Fibronectin domains of extracellular matrix molecule tenascin-C modulate hippocampal learning and synaptic plasticity. Mol Cell Neurosci. 2002;21:173–187. doi: 10.1006/mcne.2002.1172. [DOI] [PubMed] [Google Scholar]
- Tessier-Lavigne M, Goodman CS. Perspectives: neurobiology. Regeneration in the Nogo zone. Science. 2000;287:813–814. doi: 10.1126/science.287.5454.813. [DOI] [PubMed] [Google Scholar]
- Tucker RP. The in situ localization of tenascin splice variants and thrombospondin 2 mRNA in the avian embryo. Development. 1993;117:347–358. doi: 10.1242/dev.117.1.347. [DOI] [PubMed] [Google Scholar]
- Varga ZM, Bandtlow CE, Erulkar SD, Schwab ME, Nicholls JG. The critical period for repair of CNS of neonatal opossum (Monodelphis domestica) in culture: Correlation with development of glial cells, myelin and growth-inhibitory molecules. Eur J Neurosci. 1995;7:2119–2129. doi: 10.1111/j.1460-9568.1995.tb00634.x. [DOI] [PubMed] [Google Scholar]
- Wang S, Sdrulla AD, diSibio G, Bush G, Nofziger D, Hicks C, Weinmaster G, Barres BA. Notch receptor activation inhibits oligodendrocyte differentiation. Neuron. 1998;21:63–75. doi: 10.1016/s0896-6273(00)80515-2. [DOI] [PubMed] [Google Scholar]