

Abstract
Accurate estimates of mortality at advanced ages are essential to improving forecasts of mortality and the population size of the oldest old age group. However, estimation of hazard rates at extremely old ages poses serious challenges to researchers: (1) The observed mortality deceleration may be at least partially an artifact of mixing different birth cohorts with different mortality (heterogeneity effect); (2) standard assumptions of hazard rate estimates may be invalid when risk of death is extremely high at old ages and (3) ages of very old people may be exaggerated. One way of obtaining estimates of mortality at extreme ages is to pool together international records of persons surviving to extreme ages with subsequent efforts of strict age validation. This approach helps researchers to resolve the third of the above-mentioned problems but does not resolve the first two problems because of inevitable data heterogeneity when data for people belonging to different birth cohorts and countries are pooled together. In this paper we propose an alternative approach, which gives an opportunity to resolve the first two problems by compiling data for more homogeneous single-year birth cohorts with hazard rates measured at narrow (monthly) age intervals. Possible ways of resolving the third problem of hazard rate estimation are elaborated. This approach is based on data from the Social Security Administration Death Master File (DMF). Some birth cohorts covered by DMF could be studied by the method of extinct generations. Availability of month of birth and month of death information provides a unique opportunity to obtain hazard rate estimates for every month of age. Study of several single-year extinct birth cohorts shows that mortality trajectory at advanced ages follows the Gompertz law up to the ages 102–105 years without a noticeable deceleration. Earlier reports of mortality deceleration (deviation of mortality from the Gompertz law) at ages below 100 appear to be artifacts of mixing together several birth cohorts with different mortality levels and using cross-sectional instead of cohort data. Age exaggeration and crude assumptions applied to mortality estimates at advanced ages may also contribute to mortality underestimation at very advanced ages.
1. Introduction
Accurate estimates of mortality at advanced ages are essential for improving forecasts of mortality and predicting the population size of the oldest old age group. It is believed that mortality at advanced ages has a tendency to deviate from the Gompertz law (Gavrilov and Gavrilova 1991), so that the logistic model is suggested for fitting human mortality after age 85 years (Horiuchi and Wilmoth 1998). The estimates of mortality force at extreme ages are difficult to make because of small numbers of survivors to these ages in most countries. Data for extremely long-lived individuals are scarce and subjected to age exaggeration. Traditional demographic estimates of mortality based on period data encounter the well-known denominator problem. More accurate estimates are obtained using the method of extinct generations (Vincent 1951). In order to minimize statistical noise in estimates of mortality at advanced ages, researchers are forced to pool data for several calendar periods (Depoid 1973; Thatcher 1999). Single-year life tables for many countries have very small numbers of survivors to age 100, which makes estimates of mortality at advanced ages unreliable. On the other hand, aggregation of deaths for several calendar periods creates a heterogeneous mixture of cases from different birth cohorts. Theoretical models suggest that mortality deceleration at advanced ages may be caused by population heterogeneity even if individual risk of death follows the Gompertz law (Beard 1959, 1971; Vaupel et al. 1979). In addition, many standard assumptions used in hazard rate estimation are not valid for extreme old ages when mortality is particularly high.
Thus estimation of the hazard rate at extremely old ages poses several serious challenges to researchers:
The observed mortality deceleration may be at least partially related to mixing different birth cohorts with different mortality (heterogeneity effect)
Standard assumptions of hazard rate estimates may be invalid when risk of death is extremely high at old ages
Ages of very old people may be exaggerated.
One way of obtaining estimates of mortality at extreme ages is to pool international records of persons surviving to extreme ages with subsequent efforts of strict age validation (Robine et al. 2005; Robine and Vaupel 2001). This approach helps to resolve the third problem mentioned above but does not allow researchers to resolve the first two problems because of inevitable data heterogeneity when data for people belonging to different birth cohorts and countries are pooled.
In this paper we propose an alternative approach, which allows us to resolve partially these problems. This approach is based on using data from the Social Security Administration Death Master File (DMF), which allows compiling data for large single-year birth cohorts. Some already extinct birth cohorts covered by the DMF could be studied by the method of extinct generations. Availability of month-of-birth and month-of-death information provides a unique opportunity to obtain hazard rate estimates for every month of age. Possible ways of resolving the age exaggeration problem in hazard rate estimation are also elaborated.
2. Mortality at Advanced Ages: A Historical Review
The history of mortality studies at extreme ages is very rich in ideas and findings. Early studies starting with Gompertz (1825) himself suggested that the Gompertz law of mortality is not applicable to extreme old ages, and that mortality deceleration and leveling off takes place at advanced ages (for a thoughtful historical review of studies on mortality deceleration at extreme old ages, see Olshansky 1998). In 1939 two British researchers, Greenwood and Irwin, published an article, “Biostatistics of Senility,” with an intriguing finding that mortality force stops increasing with age at extreme old ages and becomes constant (Greenwood and Irwin 1939). This study, led by the famous British statistician and epidemiologist Major Greenwood, may be interesting to discuss here because it describes the mortality pattern at advanced ages for humans reported by researchers many years later.
The first important finding was formulated by Greenwood and Irwin in the following way: “the increase of mortality rate with age advances at a slackening rate, that nearly all, perhaps all, methods of graduation of the type of Gompertz’s formula over-state senile mortality” (Greenwood and Irwin 1939, p. 14). This observation was reported later by many authors (Depoid 1973; Gavrilov and Gavrilova 1991; Horiuchi and Wilmoth 1998; Thatcher 1999; Thatcher et al. 1998) and is now known as the “late-life mortality deceleration.”
The authors also suggested “the possibility that with advancing age the rate of mortality asymptotes to a finite value” (Greenwood and Irwin 1939, p. 14). Their conclusion that mortality at exceptionally high ages follows a first-order kinetics (also known as the law of radioactive decay with exponential decline in survival probabilities) was supported later by other researchers, including A. C. Economos (Economos 1979, 1980), who reported that this law holds for humans and laboratory animals (linear decrease for the logarithm of the number of survivors). This observation is known now as the “mortality leveling-off” at advanced ages and as the “late-life mortality plateau” (Curtsinger et al. 2006).
Moreover, Greenwood and Irwin made the first estimates for the asymptotic value of human mortality (one-year probability of death, qx) at extreme ages using data from a life insurance company. According to their estimates, “the limiting values of qx are 0.439 for women and 0.544 for men” (Greenwood and Irwin 1939, p. 21). It is interesting that these first estimates are very close to estimates obtained later using more numerous and accurate human data, including recent data on supercentenarians (Robine and Vaupel 2001). The authors also suggested an explanation of this phenomenon. According to Greenwood and Irwin (1939), centenarians live in a more protected environment than younger age groups and hence have a lower risk of death than predicted by the Gompertz formula.
The actuaries including Gompertz himself were the first who noticed this phenomenon of mortality deceleration. They also proposed a logistic formula for fitting mortality growth with age in order to account for mortality leveling off at advanced ages (Perks 1932; Beard 1959, 1971). British actuary Robert Eric Beard introduced a model of population heterogeneity with gamma-distributed individual risk in order to explain mortality deceleration at older ages (Beard 1959). This explanation is now considered to be the most common explanation of the mortality deceleration phenomenon (Horiuchi and Wilmoth 1998).
The same phenomenon of “almost nonaging” survival dynamics at extreme old ages is detected in many other biological species. In some species a mortality plateau can occupy a sizable part of their life (Carey et al. 1992; Gavrilov and Gavrilova 2006). Biologists have been aware of mortality leveling off since the 1960s. For example, Lindop (1961) applied Perks’ formula in order to account for mortality deceleration at older ages in mice. George Sacher believed that the observed mortality deceleration in mice and rats can be explained by population heterogeneity: “one effect of such residual heterogeneity is to bring about a decreased slope of the Gompertzian at advanced ages. This occurs because sub-populations with the higher injury levels die out more rapidly, resulting in progressive selection for vigour in the surviving populations” (Sacher 1966, p. 435). Strehler and Mildvan (1960) considered mortality deceleration at advanced ages as a prerequisite for all mathematical models of aging to explain.
Later Economos published a series of articles claiming priority in the discovery of a “non-Gompertzian paradigm of mortality” (Economos 1979, 1980, 1983, 1985). He found that mortality leveling off is observed in rodents (guinea pigs, rats, mice) and invertebrates (nematodes, shrimps, bdelloid rotifers, fruit flies, and degenerate medusae [Campanularia flexuosa]). In the 1990s, the phenomenon of mortality deceleration and leveling off became widely known after publications that demonstrated mortality leveling off in large samples of Drosophila melanogaster (Curtsinger et al. 1992, 2006) and medflies (Ceratitis capitata) (Carey et al. 1992). Mortality plateaus at advanced ages are observed for other insects: housefly (Musca vicina), blow-fly (Calliphora erythrocephala) (Gavrilov 1980), housefly (Musca domestica) (Gavrilov and Gavrilova 2006), fruit flies (Anastrepha ludens, Anastrepha obliqua, Anastrepha serpentine), parasitoid wasp (Diachasmimorpha longiacaudtis) (Vaupel et al. 1998), and bruchid beetle (Callosobruchus maculates) (Tatar et al. 1993). Interestingly, the failure kinetics of manufactured products (steel samples, industrial relays, and motor heat insulators) also demonstrates the same “nonaging” pattern at the end of their “lifespan” (Economos 1979).
Population heterogeneity, first proposed by Beard in 1959, is by far the most common explanation of mortality deceleration (Horiuchi and Wilmoth 1998). Another explanation of this phenomenon comes from the reliability theory of aging, which explains mortality leveling off by an exhaustion of an organism’s redundancy (reserves) at extremely old ages so that every random hit results in death (Gavrilov and Gavrilova 1991, 2001, 2006). There is also an opinion that lower risks of death for older people are due to their less risky behavior (Greenwood and Irwin 1939). Finally, some researchers suggest evolutionary explanations for the phenomenon of mortality leveling off (Charlesworth 2001; Mueller and Rose 1996).
The existence of mortality plateaus is well established for a number of lower organisms, mostly insects. In the case of mammals, data are much more controversial. Lindop (1961) and Sacher (1966) reported short-term periods of mortality deceleration in mice at advanced ages and even used Perks’ formula in their analyses. However, Austad later argued that rodents do not demonstrate mortality deceleration even in the case of large samples (Austad 2001). Study of baboons found no mortality deceleration at advanced ages (Bronikowski et al. 2002). In the case of humans this problem is not yet resolved, because of scarceness of data and/or their low reliability. Thus, more studies on larger human birth cohorts are required to establish with certainty the true mortality trajectory at advanced ages.
3. Hazard Rate (Mortality Force) Estimation at Advanced Ages
A conventional way to obtain estimates of mortality at advanced ages is a construction of demographic life table with probability of death (qx) as one of important life table functions. Although probability of death is a useful indicator for mortality studies, it may be not the most convenient one for studies of mortality at advanced ages. First, the values of qx depend on the length of the age interval Δx for which it is calculated. This hampers both analyses and interpretation. For example, if one-year probability of death follows the Gompertz law of mortality, probability of death calculated for another age interval does not follow this law (Gavrilov and Gavrilova 1991; Le Bras 1976). Thus it turns out that the shape of age trajectory for qx depends on the arbitrary choice of age interval. Also, by definition qx is bounded by unity, which would inevitably produce apparent mortality deceleration when death rates are particularly high.
A more useful indicator of mortality at advanced age is the instantaneous mortality rate (mortality force) or hazard rate μx, which is de-fined as follows:
where Nx is a number of living individuals exposed to risk of death at age x. It follows from the definition of the hazard rate that it is equal to the rate of decrease of the logarithmic survival function with age. In actuarial practice, the hazard rate is often called mortality force as was done in the original paper by Gompertz (Gompertz 1825). The hazard rate does not depend on the length of the age interval (it is measured at the instant of time x), has no upper boundary, and has a dimension of rate (time−1). It should also be noted that the famous law of mortality, the Gompertz law, was first proposed for fitting the age-specific hazard rate function rather than probability of death (Gompertz 1825).
The empirical estimates of hazard rates are often based on the suggestion that the age-specific mortality rate or death rate (number of deaths divided by exposure) is a good estimate of the theoretical hazard rate. One of the first empirical estimates of the hazard rate was proposed by George Sacher (Sacher 1956, 1966):
This estimate is unbiased for slow changes in the hazard rate if ΔxΔμx ≪ 1 (Sacher 1966) and was shown to be the maximum likelihood estimate (Gehan and Siddiqui 1973). A simplified version of the Sacher estimate (for small age intervals equal to unity) is often used in biodemographic studies of mortality: μx = −ln(1 − qx). This estimate was initially suggested by Gehan, who called it a “Sacher” estimate (Gehan 1969; Gehan and Siddiqui 1973). It is based on the assumption that hazard rate is constant over age interval and is shifted by one-half of a year to younger ages compared to the original Sacher estimate.
Another empirical estimate of hazard rate, often used in life table construction (Klein and Moesberger 1997), is the actuarial estimate, which is calculated in the following way (Kimball 1960):
This estimate assumes uniform distribution of deaths over the age interval and is bounded by 2/Δx, so this is not the best estimate of the hazard rate at extreme old ages when death rates are particularly high (Gavrilov and Gavrilova 1991).
At advanced ages, when death rates are very high, the assumptions about small changes in the hazard rate or a constant hazard rate within the age interval become questionable. The same is true for the assumption of uniform distribution of deaths within the age interval. Simulation studies showed that the bias in hazard rate estimation increases with the increase of the age interval (Kimball 1960). Narrowing the age interval for hazard rate estimation from one year to one month helps to improve the accuracy of hazard rate estimation.
4. Social Security Administration Death Master File as a Source of Mortality Data for Advanced Ages
The Social Security Administration Death Master File (DMF) is a publicly available data source that allows a search for deceased individuals in the United States using various search criteria: birth date, death date, first and last names, Social Security number, place of last residence, etc. This resource covers deaths that occurred in the period 1937–2010 (Faig 2001) and captures about 95% of deaths recorded by the National Death Index (Sesso et al. 2000). According to other estimates, the DMF covers about 90% of all deaths for which death certificates are issued (Faig 2001) and about 92–96% of deaths for persons older than 65 years (Hill and Rosenwaike 2001).
The DMF was used in our study of age-related mortality dynamics after age 85 years. The advantage of this data source is that some already extinct birth cohorts covered by the DMF could be studied by the method of extinct generations (Kannisto 1988, 1994; Vincent 1951). Information available in the DMF includes names of the deceased, his or her Social Security number, date, month, and year of birth, month and year of death, state of Social Security number issuance, and place of the last residence.
In this study information from the DMF was collected for individuals who lived 88 years and more and died before 2011. The DMF database is unique because it represents mortality experience for very large birth cohorts of the oldest-old persons. In this study mortality measurements were made for cohorts, which are more homogeneous in respect to the year of birth and historical life course experiences. Availability of month-of-birth and month-of-death information provides a unique opportunity to obtain hazard rate estimates for every month of age, which is important given extremely high mortality after age 100 years. Despite certain limitations, this data source allows researchers to obtain detailed estimates of mortality at advanced ages. We already used this data resource for centenarians’ age validation in the study of centenarian family histories (Gavrilova and Gavrilov 2007). This data resource is also useful in mortality estimates for several extinct or almost extinct birth cohorts in the United States.
5. Hazard Rate Estimates at Advanced Ages Using Data from the DMF
In this study we collected information from the DMF publicly available at www.Rootsweb.com. The total number of records collected from this resource was about 9 million, with more than 900,000 records belonging to persons who lived 100 years and more. We obtained data for persons who died before 2011 and were born in 1875–1895. Persons born in these years and alive in 2010 should survive to at least age 115 years, which can be considered a very unlikely event. Thus, the 1875–1895 birth cohorts in this sample may be considered practically extinct. Assuming that the number of living persons belonging to these birth cohorts in 2010 is close to zero, it is possible to construct a cohort life table using well-known method of extinct generations, which was suggested and explained by Vincent (1951) and developed further by Kannisto (1994).
The DMF provides information about years and months of birth and death. However, information on the exact day of death is not available for all records, so we were not able to calculate lifespan in days. Nevertheless we were able to calculate individual lifespans with one-month accuracy, which is still higher than the accuracy of the traditional yearly estimate of lifespan. In the first stage of our analyses we calculated an individual lifespan in completed months:
Having this information it is possible to estimate hazard rates at each month of age by standard methods of survival analysis. All calculations were done using Stata statistical software, release 11 (StataCorp 2009). This software calculates nonparametric estimates of major survival functions including the Nelson-Aalen estimator of the hazard rate (force of mortality). Note that the hazard rate μ (x) in contrast to the probability of death q(x) has a dimension of time frequency, because of the time interval in the denominator (reciprocal time, time−1). Thus the values of hazard rates depend on the chosen units of time measurement (day−1, month−1, or year−1). In this study, survival times were measured in months, so the estimates of hazard rates initially had a dimension of month−1. For the purpose of comparability with other published studies, which typically use the year−1 time scale, we transformed the monthly hazard rates to the more conventional units of year−1, by multiplying these estimates by a factor of 12 (one month in the denominator of hazard rate formula is equal to 1/12 year). It should be noted that the hazard rate, in contrast to the probability of death, can be greater than 1, and therefore its logarithm can be greater than 0 (and we indeed observed these values at extreme old ages in some rare cases as will be described later). In this paper we focus our analyses on 1881–1895 birth cohorts, because we found that data quality for cohorts born before 1881 is not particularly good.
In our study we used Nelson-Aalen hazard rate estimates provided by Stata (StataCorp 2009). In fact, the Nelson-Aalen method was initially proposed for cumulative hazard rate estimation (particularly for right-censored survival data; Klein and Moesberger 1997). In Stata hazard rate estimation is made by taking the steps of the Nelson-Aalen cumulative hazard function (Cleves et al. 2008), so that for each observed time of death xj the estimated hazard contribution is
where Ĥ(x) is an estimate of cumulative hazard function.
The way of hazard rate estimation conducted in Stata is similar to calculation of life-table probability of death (StataCorp 2009); that is, the number of deaths in the studied age interval is divided by the number alive at the beginning of age interval. At advanced ages when mortality is high and for relatively large age intervals, the number of persons exposed to risk of death in the middle of age interval is substantially lower than the number alive at the beginning of the age interval. This would result in downward bias in hazard rate estimates at advanced ages, which we observed in our study when the Nelson-Aalen estimates were applied to yearly age intervals (Fig. 1, lower line). However, for smaller monthly age intervals, the problem described above is not so crucial, and the Nelson-Aalen method still can be applied (Fig. 1, upper line).
Figure 1. Logarithm of Hazard Rate (per Year) as Function of Age Calculated for Monthly and Yearly Age Intervals.

Note: Hazard rate estimates were obtained using the Nelson-Aalen estimate. Solid lines show polynomial fit with quadratic term. Data for 1891 birth cohort from the DMF.
Note that hazard rate values calculated on a monthly basis demonstrate steady exponential growth up to age 105 years (Fig. 1). After age 105 years mortality trajectories show a small tendency for deceleration with age. Study of hazard rate estimates for several other single-year birth cohorts (1886–1895) found a similar age pattern for mortality at advanced ages.
Another issue that makes monthly age intervals preferable for hazard rate estimation is the pattern-of-deaths distribution within studied age intervals at extremely old ages. This issue is important because some estimates of the hazard rate (for example, the actuarial estimate of the hazard rate) are based on the assumption of approximately uniform distribution of deaths within one-year age intervals (Gehan and Siddiqui 1973; Kimball 1960; Watson and Leadbetter 1964). Indeed, this assumption is consistent with the data for 90-year-olds, presented in Figure 2a. However, for 102-year-olds, the distribution of deaths is obviously not uniform, with far more deaths occurring at the beginning of the age interval (Fig. 2b). To alleviate this problem, it is preferable to make mortality estimates at advanced ages for shorter (monthly) age intervals, rather than for traditional one-year age intervals when the actuarial estimate of the hazard rate is applied.
Figure 2. Deaths at Extreme Old Ages (102 Years) Are Not Distributed Uniformly over One-Year Age Intervals in Contrast to Earlier Age Groups (90 Years).

Note: 1891 birth cohort from the DMF. (a) Distribution for 90-year-olds. (b) Distribution for 102-year-olds.
Using single-year birth cohort data from the DMF we were able to minimize the effects of population heterogeneity on age-related mortality dynamics. We were also able to calculate more accurate monthly estimates of hazard rates, which are less prone to possible biases caused by violation of typical assumptions used in mortality estimation (Kimball 1960). However, we were not able to control for possible age misreporting among the deceased. The most common type of age misreporting among very old individuals is age exaggeration (Willcox et al. 2008). This type of age misreporting results in underestimation of mortality rates at advanced ages. Thus, we may suggest that mortality deceleration after age 105 years among DMF cohorts may be caused by poor data quality (age exaggeration) at very advanced ages. If this hypothesis is correct, then mortality deceleration at advanced ages should be less expressed for data with presumably better quality. In order to test this hypothesis we conducted a data quality study for DMF birth cohorts.
6. Measures to Improve Data Quality
Mortality deceleration and even decline of mortality is observed usually for data of low quality. On the other hand, improvement of data quality results in a straighter mortality trajectory in a semilog scale (Kestenbaum and Ferguson 2002). Thus, we may suggest that mortality estimates at advanced ages should be lower in populations with less accurate age reporting compared to populations with more accurate age reporting. In order to test this hypothesis, we compared mortality trajectories at advanced ages for populations with a different quality of age reporting.
Study of age validation among individuals aged 110 years or more (Rosenwaike and Stone 2003) demonstrated that age reporting among super-centenarians in the Social Security Administration DMF is rather accurate with the exception of persons born in the Southern states. In order to compare populations with presumably different data quality we split DMF records into two groups. In the first (“Southern”) group of less reliable data we included records for those persons who applied for a Social Security number in the Southeast states (AL, AR, FL, GA, KY, LA, MS, NC, SC, TN, VA, WV), Southwest states (AZ, NM, OK, TX), Puerto Rico, and Hawaii. We also added to this group all records for persons who applied for a Social Security number in New York and California because of a very high proportion of immigrants (with unknown quality of age reporting) residing in these states. In the second (“Northern”) group with presumably better data quality we included persons applying for a Social Security number in all other states as well as retired railroad workers.
Figure 3 shows age trajectories of mortality for persons born in 1891 and who had applied for a Social Security number in either “Southern” or “Northern” states. Note that the line corresponding to the polynomial fit of the logarithm of mortality with age is straighter for the “Northern” group (upper line) compared with the line corresponding to mortality of the “Southern” group (lower line). Thus, the estimates of age-specific mortality demonstrate a straighter trajectory of mortality in the semilog scale for the population of “Northern” states with presumably better quality of age reporting compared to the population with less reliable quality of age reporting (verified using a polynomial fit of mortality data).
Figure 3. Regional Mortality Data with Presumably Different Quality.

Note: Logarithm of hazard rate (per year) for the 1891 birth cohort as a function of age. Comparison of less reliable (“Southern” group) and more reliable (“Northern” group) data. Solid lines show a polynomial fit with a quadratic term. Data from the DMF.
A similar phenomenon is observed when mortality data for earlier birth cohort are compared to mortality data for later birth cohort. Records for later-born persons are expected to be of better quality because of the improvement of age reporting over time. Taking into account that age reporting is improving over history, we may suggest that mortality for later birth cohorts would follow the Gompertz law more closely compared to the mortality of earlier birth cohorts with presumably lower data quality. This suggestion is confirmed by comparing the 1881 and 1891 birth cohorts (Fig. 4). The more recent 1891 birth cohort demonstrates a straighter trajectory and lower statistical noise after age 105 than the older 1881 one (Fig. 4). Thus, we may expect that future extinct cohorts born after 1891 may demonstrate even better fit by the Gompertz model than the older ones because of continuously improving accuracy in age reporting.
Figure 4. Historical Mortality Data with Presumably Different Quality.

Note: Logarithm of the hazard rate (per year) for two birth cohorts as a function of age. Comparison of less reliable (older 1881 birth cohort, lower line) and more reliable (more recent 1891 birth cohort, upper line) data. Solid lines show fit by a polynomial function with a quadratic term. Data from the DMF.
Quantitative estimation of the degree of mortality deceleration at older ages was conducted by modeling the logarithm of the hazard rate as a polynomial function of age. In the case of mortality deceleration, the hazard rate would be described by a convex parabola in semilog coordinates. This is expressed as a negative parameter at a quadratic term, and the absolute value of this parameter can be used as a measure of mortality deceleration. Table 1 presents values of the parameter at a quadratic term for polynomial regression of the logarithm of the hazard rate as a function of age (after age 90). Note that the absolute value of a parameter at the quadratic term is higher for older birth cohorts and the “Southern” group of less reliable records (described earlier), confirming that data with lower quality demonstrate a higher degree of mortality deceleration.
Table 1.
Comparison of the Degree of Mortality Deceleration at Advanced Ages Using Polynomial Regression Model
| Population | Parameter at quadratic term × 105 (95% CI) |
|---|---|
| 1881 birth cohort | −75.5 (−76.7, −74.4) |
| 1889 birth cohort | −38.3 (−38.9, −37.8) |
| 1894 birth cohort | 5.2 (4.7, 5.6) |
| 1891 birth cohort | |
| Northern group (more reliable data) | −18.7 (−19.6, −17.8) |
| Southern group (less reliable data) | −64.7 (−65.7, −63.6) |
| 1893 birth cohort | |
| Northern group (more reliable data) | −7.4 (−8.2, −6.6) |
| Southern group (less reliable data) | −18.3 (−19.2, −17.3) |
| 1891 birth cohort | |
| Yearly age intervals | −48.9 (−49.1, −48.6) |
| Monthly age intervals | −25.5 (−25.8, −25.1) |
Note: Logarithm of hazard rate after age 90 for a particular population was fitted by the polynomial regression model with a quadratic term.
Based on the results presented above we may conclude that the better the quality of mortality data at advanced ages, the closer mortality trajectories are to the Gompertz function. However, we have to admit that the data at very old ages are noisy and have quality problems even for the “Northern” group and the most recent birth cohorts. Thus, our next step in data quality control is to identify the age interval with reasonably good data quality and then to compare competing mortality models in this age interval.
One approach to testing data quality at advanced ages is to calculate the female-to-male ratio at advanced ages. Taking into account that female mortality is always lower than male mortality, it is reasonable to expect that the female-to-male ratio should continuously increase with age. On the other hand, old men have a tendency for age exaggeration, and in populations with poor age registration there is a relative excess of men at very advanced ages (Caselli et al. 2006; Willcox et al. 2008).
The DMF does not have information about sex of the deceased. To cope with this limitation of the data sample, we conducted a procedure of sex identification using information about the 1,000 most commonly used baby first names in the 1900s provided by the Social Security Administration (http://www.ssa.gov/OACT/babynames). These data come from a sample of 5% of all Social Security cards issued to individuals who were born during the 1900s in the United States. From the lists of male and female names we removed names consisting of initials and potentially unisex names (such as Jessie or Lonnie). It is interesting to note that the male list contains obviously female names (Mary, Elizabeth), and the same problem was observed for the female list, which indicates that the data apparently contain many sex misidentifications. These female names were removed from the male list, and the same procedure was done for the female list. Additional male or female names found in DMF were also added to our sex identification name lists. Using the final lists of male and female first names, we applied the sex identification procedure to the sample of 1879–1895 birth cohorts. Eventually we were able to identify sex for 91–93% of records for persons in our sample. The remaining 7–9% of persons with unknown sex had approximately the same mean lifespan as the remaining percentage of individuals with identified sex pooled (checked with the t-test statistics), so the existence of possible sex nonidentification bias in mortality seems unlikely. This data sample of 774,926 individuals with known sex (out of 846,982 individuals) was used for identifying the age interval of reasonably good data quality using information on the female-male ratio at advanced ages.
The result of hazard rate estimation for men and women born in 1891 is presented in Figure 5. Note that male mortality continues to exceed female mortality up to very advanced ages, and this mortality differential narrows very slowly with age. At age 110 years the number of remaining males (9) and females (61) is too small for accurate estimates of the hazard rate after this age. This pattern of sex differential in mortality at very old ages confirms the validity of using the female-to-male ratio as a tool of data quality assessment because higher male mortality at all observed ages should theoretically lead to a continuously growing female-male ratio.
Figure 5. Age-Specific Hazard Rates (Log Scale) for Men (Upper Line) and Women (Lower Line) Born in 1891.

Note: Solid lines show fit with polynomial function with quadratic term. Data from the DMF.
We calculated the female-to-male ratio after age 95 years for 1881–1895 U.S. birth cohorts from the DMF. Figure 6 demonstrates the age dependency of this ratio for pooled sample of 1887–1892 birth cohorts (these cohorts have similar levels of mortality). Note that the female-to-male ratio is growing steadily with age up to ages 106–107 years. After this age the female-to-male ratio starts to decrease, indicating a declining quality of age reporting. Thus, the estimates of hazard rates obtained from the DMF are of acceptable quality up to the age of 106 years. Figure 7 shows the maximum age or tipping point when the female-to-male ratio starts to decline for different birth cohorts. It demonstrates that this age varies from 104 to 107, indicating the upper limit for data of reasonably good quality in terms of age reporting.
Figure 6. Observed Female-to-Male Ratio at Advanced Ages for Combined 1887–1892 Birth Cohort.

Note: If data are of good quality, then this ratio should grow with age.
Figure 7.

Age of Maximum Female-to-Male Ratio, by Birth Cohort
Thus, our study of the female-to-male ratio for different birth cohorts indicates that age reporting has reasonably good quality up to an age of about 106 years. For this reason we used the age interval 88–106 years for mortality modeling.
7. Modeling Mortality at Advanced Ages
The next step of our study was to compare two competing models of mortality at advanced ages—the Gompertz and the logistic models—using data of reasonably good quality. Study of data quality control at advanced ages described earlier suggests that age reporting among the oldest-old in the United States is good until the age of 106 years. It means that comparing mortality models beyond this age is not feasible because of poor quality of mortality data. For this reason, we used a subsample of deaths for persons who applied for Social Security numbers in the “Northern” states (described above) and born in 1886–1895 because these data have reasonably good quality. We applied Gompertz and logistic (Kannisto) models (Thatcher et al. 1998) to mortality modeling in the age interval 88–106 years using the nonlinear regression method for parameter estimation. Calculations were performed using Stata.
Figure 8 presents the results of mortality fit-ting after age 88 for Gompertz and Kannisto models using data for “Northern” states and the 1891 birth cohort. The visual impression is that the Gompertz model fits data better than the logistic model, although for objective comparisons we need to use conventional measures of goodness-of-fit. In this study, goodness-of-fit for each model was estimated using the Bayesian information criterion (BIC). Table 2 shows values of the BIC for both the Gompertz and the logistic model for 10 studied birth cohorts. Note that in 8 of 10 cases (studied birth cohorts), the Gompertz model demonstrates better fit (lower BIC) than the logistic model for age interval 88–106 years.
Figure 8. Mortality Fitting Using Gompertz (Upper Line) and Logistic (Lower Line) Models for 1891 Birth Cohort of Persons Who Applied for Social Security Numbers in the Northern States.
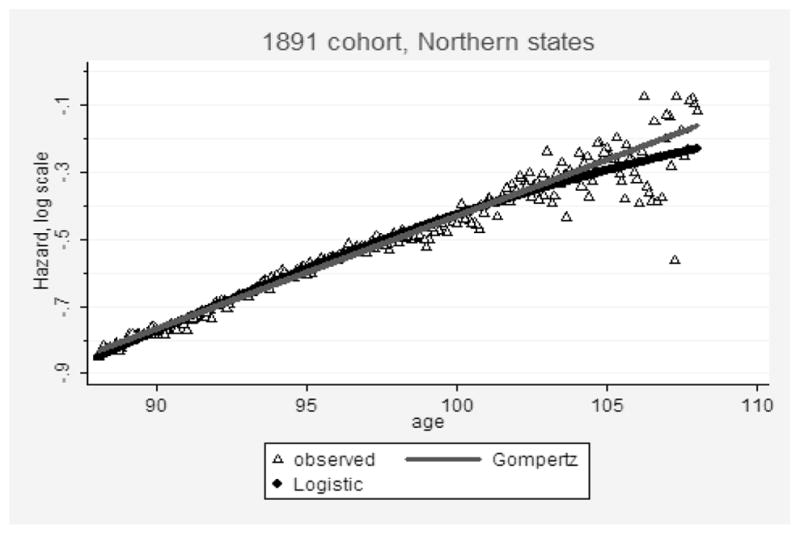
Note: Data from the DMF.
Table 2.
Comparison of Goodness-of-Fit (Bayesian Information Criterion) for Gompertz and Logistic Models of Mortality
| Birth Cohort | Cohort Size at Age 88 Years, Persons | Bayesian Information Criterion
|
|
|---|---|---|---|
| Gompertz Model | Logistic Model | ||
| 1886 | 111,657 | −594,776.2 | −588,049.5 |
| 1887 | 114,469 | −625,303.0 | −618,721.4 |
| 1888 | 128,768 | −709,620.7 | −712,575.5 |
| 1889 | 131,778 | −710,087.1 | −715,356.6 |
| 1890 | 135,393 | −724,731.0 | −722,939.6 |
| 1891 | 143,138 | −767,138.3 | −739,727.6 |
| 1892 | 152,058 | −831,555.3 | −810,951.8 |
| 1893 | 156,189 | −890,022.6 | −862,135.9 |
| 1894 | 160,835 | −946,219.0 | −905,787.1 |
| 1895 | 165,294 | −921,650.3 | −863,246.6 |
Note: Estimates were made in the age interval 88–106 years for 10 single-year U.S. birth cohorts and data of enhanced accuracy for individuals who applied for Social Security numbers in the Northern states (see explanation in the text). Cases when the Gompertz model fits data better than the logistic model are highlighted in bold.
At this time, we cannot make a conclusion that the Gompertz model fits mortality data better than the logistic model after age 106, because of the low quality of age reporting beyond this age. At the same time, the data indicate that the Gompertz model fits mortality data well until age 106 years. Taking into account that survival beyond age 106 years is a rather rare event, it would be reasonable to suggest the Gompertz model rather than the logistic model for closing cohort life tables in actuarial practice. In this case, mortality modeling could be done first for the hazard rate (mortality force) function, and then all life table functions (including probability of death qx) could be derived on the basis of modeled values of the hazard rate.
8. Comparison of DMF Old-Age Mortality Data with the 1900 Actuarial Life Table
Because of limitations of the DMF data (incompleteness of death registration before the 1970s), we were unable to estimate mortality before the age 85–88 years. There is also a question whether our estimates of the Gompertz parameters (slope parameter in particular) are applicable to a wider age interval or whether they are specific only for advanced ages (the so-called two-stage Gompertz model). In this study we compared our empirical estimates of cohort mortality at advanced ages, based on DMF data, with the 1900 actuarial cohort life table (Bell et al. 1992). Unfortunately, no reliable U.S. cohort life tables exist for cohorts older than 1900, so we compared our mortality data for earlier birth cohorts to the later 1900 birth cohort. It should be noted that the adult U.S. population did not experience substantial mortality changes between 1890 and 1900. According to the estimates made by historical demographers, life expectancy at age 40 in the United States in 1890 (27.61 years) was practically the same as in 1900 (27.52 years) (Haines 1998). Thus, we believe that mortality at advanced ages for the 1900 birth cohort in the actuarial study and the 1894 birth cohort we used for comparison should not be substantially different.
We initially compared our DMF data with probability-of-death estimates from the actuarial life table (qx) and found that life table values of probability of death show deceleration after age 100. It should be noted, however, that the yearly estimates of probability of death (qx) and mortality force (μ x) diverge at advanced ages. This happens because probability of death cannot continue its rapid growth when it approaches its mathematical upper limit equal to one, whereas mortality force theoretically can increase indefinitely with age. Therefore, estimates of probability of death at advanced ages are biased downward compared to the hazard rate estimates. Hence, probability-of-death estimates beyond age 100 show deceleration in semilog coordinates even if values of hazard rates follow the Gompertz model.
A formula proposed by George Sacher (Sacher 1956, 1966) gives more accurate estimates of the hazard rate for yearly age intervals, and so we applied a simplified Sacher formula for the age-specific hazard rate conversion from qx values reported in the 1900 actuarial cohort life table:
where qx is a probability-of-death value from the life table.
Figure 9 shows the trajectories of age-specific hazard rates for the 1900 birth cohort from the actuarial study and 1894 birth cohort from DMF over a broad age interval starting at age 50 years. Note that hazard rate estimates for the 1894 birth cohort are practically identical to the hazard rate estimates calculated on the basis of the actuarial life table. Also note that mortality of the 1894 birth cohort has the same slope in semilog coordinates as the mortality of the actuarial birth cohort calculated for a much wider age interval, which does not support the suggestion about the two-stage Gompertz model of mortality at advanced ages. Indeed, the maximum likelihood estimator of the Gompertz slope parameter for mortality in the 1894 cohort measured in the interval 88–106 years (0.0786 year− 1, 95% CI: 0.0786–0.0787) does not differ from the slope parameter calculated over the age interval 40–104 years in the 1900 life table: 0.0785 year− 1, 95% CI: 0.0772–0.0797. Thus, we may conclude that more accurate estimates of hazard rates at advanced ages based on individual mortality data practically coincide with hazard rate estimates calculated on the basis of the 1900 actuarial cohort life table (Bell et al. 1992). It is remarkable that estimates in the actuarial life table obtained by extrapolation of annual probabilities of death after age 95 (Bell et al. 1992) are practically identical to the observed estimates of hazard rates based on mortality experience of a very large cohort of old individuals.
Figure 9. Actuarial 1900 U.S. Cohort Life Table and 1894 Birth Cohort.

Note: Source for actuarial life table: Bell and Miller (2002).
9. Discussion
This study of large single-year U.S. birth cohorts found that mortality deceleration at advanced ages is negligible up to the age of 106 years. Below the age of 107 years and for data of reasonably good quality the Gompertz model fits mortality better than the logistic model (no mortality deceleration). We also found that deceleration of mortality in later life is more expressed for data of lower quality. Quality of age reporting in DMF becomes particularly poor after the age of 107 years. It is also interesting that the DMF mortality data agree remarkably well with mortality estimates reported by the 1900 actuarial cohort life table (if hazard rate values are compared).
There are several reasons why earlier studies, including our own research (Gavrilov 1984; Gavrilov and Gavrilova 1991), reported mortality deceleration and mortality leveling off at advanced ages (Horiuchi and Wilmoth 1998; Kannisto 1994; Robine and Vaupel 2001; Thatcher 1999; Thatcher et al. 1998). First, many studies present information for age-specific probability of death rather than the hazard rate (Gallop and Macdonald 2005; Robine and Vaupel 2001). It is not surprising that probability of death has a tendency of deceleration at advanced ages when mortality is high, taking into account that this mortality indicator has a theoretical upper limit equal to one. For example, a study of mortality among supercentenarians demonstrated that probability of death for this group does not increase with age (Robine and Vaupel 2001). The authors do not provide estimates of the hazard rate for this small heterogeneous population, so at this moment it is difficult to make a conclusion about the real mortality trajectory in this sample of very old individuals. In the study of validated French-Canadian centenarians born in 1870–1894 the authors found no growth of mortality with age for life table death rates rather than hazard rates (Beaudry-Godin et al. 2008). It is true that for young and middle ages (when mortality is relatively low), probability-of-death and hazard rate values are numerically close. As a result, some authors do not distinguish between probability of death and hazard rate in their calculations (Le Bras 2005).
In the studies of period mortality, deceleration at advanced ages is probably caused by mixing data for several birth cohorts with different mortality levels (heterogeneity effect) and using cross-sectional instead of cohort data (Horiuchi and Wilmoth 1998; Kannisto 1994; Thatcher et al. 1998). In addition to that, if information about the population at risk is taken from censuses, there is always a possibility of a mismatch in the accuracy of age reporting between deaths and population at risk due to a higher proportion of age misreporting in censuses (the so-called denominator problem). It should be noted that mortality deceleration was also reported for cohort mortality data (Thatcher et al. 1998). In this case, mortality deceleration may be caused by age misreporting in death data for older persons, as we already found in our study. Earlier studies, conducted more than 10 years ago, used data for older birth cohorts when age reporting was not particularly accurate even for such countries as the United Kingdom (Gallop and Macdonald 2005). In addition, most developed countries have much smaller populations compared to the United States, and hence studies of mortality at advanced ages for these countries have to combine many single-year birth cohorts, thereby increasing the heterogeneity of the sample. Thus, age exaggeration, use of probabilities of death instead of hazard rates, and perhaps data heterogeneity could lead to downward biases in mortality estimates at older ages reported in previous studies.
In our study we found no significant mortality deceleration at advanced age for humans, while many less complex organisms demonstrate very long late-age mortality plateaus (Carey et al. 1992; Curtsinger et al. 1992; Gavrilov and Gavrilova 1991; Vaupel et al. 1998). Earlier studies showed that the period of mortality deceleration in mammalian species is very short (Lindop 1961; Sacher 1966) compared to less complex organisms (Gavrilov and Gavrilova 2006; Vaupel et al. 1998). It appears to be relatively short if not negligible in humans too. This observation agrees with the prediction of the reliability theory of aging that more complex living systems/organisms with many vital subsystems (such as mammals) may experience a very short period of mortality plateau at advanced ages in contrast to less complex organisms (Gavrilov and Gavrilova 1991, 2001, 2006). Thus, human mortality at advanced ages may show a very short or even negligible mortality plateau despite the evidence of mortality leveling off among other organisms such as insects.
The results obtained in this study may be important for actuarial practice, particularly if mortality is analyzed for birth cohorts. For cohort data, hazard rates can be extrapolated with the Gompertz formula up to 107 years of age, and then probabilities of death can be reconstructed with the Sacher formula if necessary. Our study also suggests that improvements in age reporting should result in mortality trajectories that better follow the Gompertz function until very advanced ages. DMF data confirm that the 1900 actuarial cohort life table (Bell et al. 1992) provides a good description of mortality at advanced ages, suggesting that cohort life tables obtained in this study may indeed be useful in actuarial practice.
Acknowledgments
We would like to thank three anonymous reviewers for their constructive criticism and useful suggestions. This study was made possible thanks to generous support from the Society of Actuaries and the National Institute on Aging (NIA grant R01 AG028620). We are grateful to Thomas Ed-walds, Kenneth Faig, and Ward Kinkade for helpful comments and suggestions on an earlier version of this manuscript as well as to the participants of the 2008 and 2010 International Symposiums “Living to 100” in Orlando, FL, organized by the Society of Actuaries for stimulating discussion.
Contributor Information
Leonid A. Gavrilov, Email: gavrilov@longevity-science.org.
Natalia S. Gavrilova, Email: gavrilova@longevity-science.org.
References
- Austad SN. Concepts and Theories of Aging. In: Masoro EJ, Austad SN, editors. Handbook of the Biology of Aging. San Diego: Academic Press; 2001. pp. 3–22. [Google Scholar]
- Beard RE. Note on Some Mathematical Mortality Models. In: Wolstenholme EW, O’Connor MO, editors. The Lifespan of Animals. Boston: Little, Brown; 1959. pp. 302–311. [Google Scholar]
- Beard RE. Some Aspects of Theories of Mortality, Cause of Death Analysis, Forecasting and Stochastic Processes. In: Brass W, editor. Biological Aspects of Demography. London: Taylor and Francis; 1971. pp. 57–68. [Google Scholar]
- Beaudry-Godin M, Bourbeau R, Desjardins B. Living to 100 and Beyond [online monograph] Schaumburg, IL: Society of Actuaries; 2008. Data Validation and Measurement of Cohort Mortality among Centenarians in Quebec (Canada) according to Ethnic Origin. [Google Scholar]
- Bell FC, Miller ML. Actuarial Study No. 116. Baltimore, MD: U.S. Department of Health and Human Services; 2002. Life Tables for the United States Social Security Area 1900–2100. [Google Scholar]
- Bell FC, Wade AH, Goss SC. Actuarial Study No. 107. Baltimore, MD: U.S. Department of Health and Human Services; 1992. Life Tables for the United States Social Security Area 1900–2080. [Google Scholar]
- Bronikowski AM, Alberts SC, Altmann J, Packer C, Carey KD, Tatar M. The Aging Baboon: Comparative Demography in a Non-Human Primate. Proceedings of the National Academy of Sciences of the USA. 2002;99:9591–9595. doi: 10.1073/pnas.142675599. [DOI] [PMC free article] [PubMed] [Google Scholar]
- Carey JR, Liedo P, Orozco D, Vaupel JW. Slowing of Mortality-Rates at Older Ages in Large Medfly Cohorts. Science. 1992;258(5081):457–461. doi: 10.1126/science.1411540. [DOI] [PubMed] [Google Scholar]
- Caselli G, Pozzi L, Vaupel JW, Deiana L, Pes G, Carru C, Franceschi C, Baggio G. Family Clustering in Sardinian Longevity: A Genealogical Approach. Experimental Gerontology. 2006;41(8):727–736. doi: 10.1016/j.exger.2006.05.009. [DOI] [PubMed] [Google Scholar]
- Charlesworth B. Patterns of Age-Specific Means and Genetic Variances of Mortality Rates Predicted by Mutation-Accumulation Theory of Ageing. Journal of Theoretical Biology. 2001;210:47–65. doi: 10.1006/jtbi.2001.2296. [DOI] [PubMed] [Google Scholar]
- Cleves MA, Gutierrez RG, Gould WW, Marchenko Y. An Introduction to Survival Analysis Using Stata. College Station, TX: Stata Press; 2008. [Google Scholar]
- Curtsinger JW, Fukui H, Townsend D, Vaupel JW. Demography of Genotypes: Failure of the Limited Life-Span Paradigm in. Drosophila melanogaster Science. 1992;258:461–463. doi: 10.1126/science.1411541. [DOI] [PubMed] [Google Scholar]
- Curtsinger JW, Gavrilova NS, Gavrilov LA. Biodemography of Aging and Age-Specific Mortality in Drosophila melanogaster. In: Masoro EJ, Austad SN, editors. Handbook of the Biology of Aging. San Diego: Academic Press; 2006. pp. 261–288. [Google Scholar]
- Depoid F. Mortality of Old People over 85. Population. 1973;28(4–5):755–792. [Google Scholar]
- Economos AC. A Non-Gompertzian Paradigm for Mortality Kinetics of Metazoan Animals and Failure Kinetics of Manufactured Products. AGE. 1979;2:74–76. [Google Scholar]
- Economos AC. Kinetics of Metazoan Mortality. Journal of Social and Biological Structures. 1980;3(4):317–329. [Google Scholar]
- Economos AC. Rate of Aging, Rate of Dying and the Mechanism of Mortality. Archives in Gerontology and Geriatrics. 1983;1:3–27. doi: 10.1016/0167-4943(82)90003-6. [DOI] [PubMed] [Google Scholar]
- Economos AC. Rate of Aging, Rate of Dying and Non-Gompertzian Mortality—Encore. Gerontology. 1985;31(2):106–111. doi: 10.1159/000212688. [DOI] [PubMed] [Google Scholar]
- Faig K. Reported Deaths of Centenarians and Near-Centenarians in the U.S. Social Security Administration’s Death Master File. Paper presented at the Society of Actuaries Living to 100 and Beyond International Symposium; Orlando, FL. 2001. [Google Scholar]
- Gallop A, Macdonald AS. Living to 100 and Beyond Monograph [online edition] Schaumburg, IL: Society of Actuaries; 2005. Mortality at Advanced Ages in the United Kingdom. [Google Scholar]
- Gavrilov LA. PhD thesis. Moscow: Moscow State University; 1980. Study of Life Span Genetics Using the Kinetic Analysis. [Google Scholar]
- Gavrilov LA. Does the Limit of the Life-Span Really Exist? Biofizika. 1984;29(5):908–909. [PubMed] [Google Scholar]
- Gavrilov LA, Gavrilova NS. The Biology of Life Span: A Quantitative Approach. New York: Harwood Academic; 1991. [Google Scholar]
- Gavrilov LA, Gavrilova NS. The Reliability Theory of Aging and Longevity. Journal of Theoretical Biology. 2001;213(4):527–545. doi: 10.1006/jtbi.2001.2430. [DOI] [PubMed] [Google Scholar]
- Gavrilov LA, Gavrilova NS. Reliability Theory of Aging and Longevity. In: Masoro EJ, Austad SN, editors. Handbook of the Biology of Aging. San Diego: Academic Press; 2006. pp. 3–42. [Google Scholar]
- Gavrilova NS, Gavrilov LA. Search for Predictors of Exceptional Human Longevity: Using Computerized Genealogies and Internet Resources for Human Longevity Studies. North American Actuarial Journal. 2007;11(1):49–67. [Google Scholar]
- Gehan EA. Estimating Survival Functions from Life Table. Journal of Chronic Diseases. 1969;21(9–10):629–644. doi: 10.1016/0021-9681(69)90035-6. [DOI] [PubMed] [Google Scholar]
- Gehan EA, Siddiqui MM. Simple Regression Methods for Survival Time Studies. Journal of the American Statistical Association. 1973;68(344):848–856. [Google Scholar]
- Gompertz B. On the Nature of the Function Expressive of the Law of Human Mortality and on a New Mode of Determining Life Contingencies. Philosophical Transactions of the Royal Society of London A. 1825;115:513–585. doi: 10.1098/rstb.2014.0379. [DOI] [PMC free article] [PubMed] [Google Scholar]
- Greenwood M, Irwin JO. The Biostatistics of Senility. Human Biology. 1939;11:1–23. [Google Scholar]
- Haines MR. Estimated Life Tables for the United States, 1850–1910. Historical Methods. 1998;31(4):149–169. [Google Scholar]
- Horiuchi S, Wilmoth JR. Deceleration in the Age Pattern of Mortality at Older Ages. Demography. 1998;35:391–412. [PubMed] [Google Scholar]
- Kannisto V. On the Survival of Centenarians and the Span of Life. Population Studies. 1988;42:389–406. [Google Scholar]
- Kannisto V. Development of Oldest-Old Mortality, 1950–1990: Evidence from 28 Developed Countries. Odense: Odense University Press; 1994. [Google Scholar]
- Kestenbaum B, Ferguson BR. Living to 100 and Beyond International Symposium [online edition] Schaumburg, IL: Society of Actuaries; 2002. Mortality of the Extreme Aged in the United States in the 1990s, Based on Improved Medicare Data. [Google Scholar]
- Kimball AW. Estimation of Mortality Intensities in Animal Experiments. Biometrics. 1960;16(4):505–521. [Google Scholar]
- Klein JP, Moesberger ML. Survival Analysis Techniques for Censored and Truncated Data. New York: Springer; 1997. [Google Scholar]
- Le Bras H. Lois de mortalité et âgea limité. Population. 1976;31:655–692. [Google Scholar]
- Le Bras H. Mortality Tempo versus Removal of Causes of Mortality: Opposite Views Leading to Different Estimations of Life Expectancy. Demographic Research. 2005;13:615–640. [Google Scholar]
- Lindop PJ. Growth Rate, Lifespan and Causes of Death in SAS/4 Mice. Gerontologia. 1961;5:193–208. doi: 10.1159/000211059. [DOI] [PubMed] [Google Scholar]
- Mueller LD, Rose MR. Evolutionary Theory Predicts Late-Life Mortality Plateaus. Proceedings of the National Academy of Sciences USA. 1996;93:15249–15253. doi: 10.1073/pnas.93.26.15249. [DOI] [PMC free article] [PubMed] [Google Scholar]
- Olshansky SJ. On the Biodemography of Aging: A Review Essay. Population and Development Review. 1998;24:381–393. [Google Scholar]
- Robine J-M, Cournil A, Gampe J, Vaupel JW. Living to 100 and Beyond Monograph [online edition] Schaumburg, IL: Society of Actuaries; 2005. IDL, the International Database on Longevity. [Google Scholar]
- Robine JM, Vaupel JW. Supercentenarians: Slower Ageing Individuals or Senile Elderly? Experimental Gerontology. 2001;36(4–6):915–930. doi: 10.1016/s0531-5565(00)00250-3. [DOI] [PubMed] [Google Scholar]
- Rosenwaike I, Stone LF. Verification of the Ages of Supercentenarians in the United States: Results of a Matching Study. Demography. 2003;40(4):727–739. doi: 10.1353/dem.2003.0038. [DOI] [PubMed] [Google Scholar]
- Sacher GA. On the Statistical Nature of Mortality, with Especial Reference to Chronic Radiation Mortality. Radiology. 1956;67:250–257. doi: 10.1148/67.2.250. [DOI] [PubMed] [Google Scholar]
- Sacher GA. The Gompertz Transformation in the Study of the Injury-Mortality Relationship: Application to Late Radiation Effects and Ageing. In: Lindop PJ, Sacher GA, editors. Radiation and Aging. London: Taylor and Francis; 1966. pp. 411–441. [Google Scholar]
- Sesso HD, Paffenbarger RS, Lee IM. Comparison of National Death Index and World Wide Web Death Searches. American Journal of Epidemiology. 2000;152(2):107–111. doi: 10.1093/aje/152.2.107. [DOI] [PubMed] [Google Scholar]
- StataCorp. Stata Statistical Software: Release 11. College Station, TX: StataCorp; 2009. [Google Scholar]
- Strehler BL, Mildvan AS. General Theory of Mortality and Aging. Science. 1960;132(3418):14–21. doi: 10.1126/science.132.3418.14. [DOI] [PubMed] [Google Scholar]
- Tatar M, Carey JR, Vaupel JW. Long-Term Cost of Reproduction with and without Accelerated Senescence in Callosobruchus maculatus: Analysis of Age-Specific Mortality. Evolution. 1993;47:1302–1312. doi: 10.1111/j.1558-5646.1993.tb02156.x. [DOI] [PubMed] [Google Scholar]
- Thatcher AR. The Long-Term Pattern of Adult Mortality and the Highest Attained Age. Journal of the Royal Statistical Society Series A–Statistics in Society. 1999;162:5–30. doi: 10.1111/1467-985x.00119. [DOI] [PubMed] [Google Scholar]
- Thatcher AR, Kannisto V, Vaupel JW. The Force of Mortality at Ages 80 to 120. Odense: Odense University Press; 1998. [Google Scholar]
- Vaupel JW, Carey JR, Christensen K, Johnson TE, Yashin AI, Holm NV, Iachine IA, Kannisto V, Khazaeli AA, Liedo P, Longo VD, Zeng Y, Manton KG, Curtsinger JW. Biodemographic Trajectories of Longevity. Science. 1998;280(5365):855–860. doi: 10.1126/science.280.5365.855. [DOI] [PubMed] [Google Scholar]
- Vaupel JW, Manton KG, Stallard E. Impact of Heterogeneity in Individual Frailty on the Dynamics of Mortality. Demography. 1979;16(3):439–454. [PubMed] [Google Scholar]
- Vincent P. La Mortalité des vieillards. Population. 1951;6:181–204. [Google Scholar]
- Watson GS, Leadbetter MR. Hazard Analysis. I. Biometrika. 1964;51(1–2):175–184. [Google Scholar]
- Willcox DC, Willcox BJ, He Q, Wang NC, Suzuki M. They Really Are That Old: A Validation Study of Centenarian Prevalence in Okinawa. Journals of Gerontology Series A–Biological Sciences and Medical Sciences. 2008;63(4):338–349. doi: 10.1093/gerona/63.4.338. [DOI] [PubMed] [Google Scholar]