Abstract
Oxidative stress contributes to the pathogenesis of diabetic nephropathy. In mitochondria, lipoic acid synthase produces α-lipoic acid, an antioxidant and an essential cofactor in α-ketoacid dehydrogenase complexes, which participate in glucose oxidation and ATP generation. Administration of lipoic acid abrogates diabetic nephropathy in animal models, but whether lower production of endogenous lipoic acid promotes diabetic nephropathy is unknown. Here, we crossed mice heterozygous for lipoic acid synthase deficiency (Lias+/−) with Ins2Akita/+ mice, a well characterized model of type 1 diabetes. Double mutant mice had more overt diabetic nephropathy, including microalbuminuria, glomerular basement thickening, mesangial matrix expansion, and hypertension, compared with Lias+/+Ins2Akita/+ controls. We also identified proximal tubules as a major site for generation of superoxide anions during diabetic nephropathy. Mitochondria in proximal tubular cells were particularly sensitive to damage in diabetic mice with reduced lipoic acid production. These results suggest that lipoic acid synthase deficiency increases oxidative stress and accelerates the development of diabetic nephropathy.
Diabetic nephropathy (DN) is a major complication of diabetes and is the single largest cause of ESRD.1 Although research shows that treatment with angiotensin-converting enzyme inhibitors or angiotensin receptor antagonists attenuates the progression of kidney disease, renal failure remains a major challenge in DN. Because increased oxidative stress is an important feature in the development and progression of diabetes and its complications,2 there is increasing interest in the protective function of antioxidants and their potential as an adjunctive therapy for diabetic complications.
α-Lipoic acid (1,2-dithiolane-3-pentanoic acid; LA), produced by LA synthase (Lias) in mitochondria, is a natural antioxidant and an essential cofactor in mitochondrial α-ketoacid dehydrogenase complexes, such as pyruvate dehydrogenase complex and α-ketoglutarate dehydrogenase complex. Both enzyme complexes participate in glucose oxidation and ATP generation.3 Studies show that LA administration prevents and attenuates DN in animal models and humans.4–9 However, LA can also act as a pro-oxidant. For example, Bhatti et al.10 demonstrated that LA dose-dependently increased oxidative stress and kidney damage in nondiabetic rats. Such discrepancies may reflect the result of different doses and routes of administration that, in turn, affect LA bioavailability. The use of genetic models could reduce these discrepancies and define the efficacy of LA with respect to treatment of DN.
Endogenous production of LA is essential for normal embryo development. Homozygous LA synthase gene (Lias)–deficient (knockout) mice die in utero shortly after implantation.11 Lias+/− mice appear normal but have an impaired antioxidant defense system.12 Diabetes and its complications are usually accompanied by a diminished antioxidant reservoir,2 including a decrease in blood α-LA.13 The objective of this study was to investigate the role of reduced endogenous LA production in the development of DN. If reduced endogenous antioxidant capacity is a primary pathogenic factor, diabetic mice with Lias deficiency will be susceptible to reactive oxygen species and, consequently, the mice would manifest accelerated development of DN. To test our hypothesis, we crossed Lias+/− mice with Ins2Akita/+ mice, a well characterized type 1 diabetic mouse model. The C96Y mutation in the Ins2Akita/+ mouse causes a protein misfolding of insulin, leading to early loss of pancreatic β cells and spontaneous development of type 1 diabetes.14 The nephropathy that develops in Ins2Akita/+ mice is similar to that of human diabetic renal disease.15 Our results showed enhanced features of DN in Lias+/−Ins2Akita/+ mice, which were accompanied by increases in both kidney and systemic oxidative stress. Histologic findings suggest that increased superoxide and reduced antioxidant production resulting from the heterozygous deficiency of Lias synthase lead to mitochondrial damage in proximal tubules of the kidney.
RESULTS
Fasting Blood Glucose in Lias+/+Ins2Akita/+ and Lias+/−Ins2Akita/+ Mice
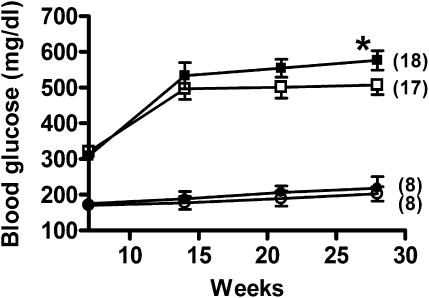
Ins2Akita/+ male mice usually develop hyperglycemia between 4 and 8 weeks of age and start to die around the 25th week.14 To investigate the effect of Lias deficiency on the development of diabetes and mortality, we conducted this study between weeks 7 and 28. Blood glucose levels of Lias+/−Ins2Akita/+ males in the initial 7 weeks did not differ significantly from those of Lias+/+Ins2Akita/+ males (Figure 1). However, hyperglycemia was more pronounced in 28-week-old Lias+/−Ins2Akita/+ mice compared with Lias+/+Ins2Akita/+ mice (Figure 1). Total plasma cholesterol and triglyceride levels in both genotypes did not exhibit any significant differences (Table 1). Likewise, body weight, food intake, and water intake were not significantly different between Lias+/−Ins2Akita/+ mice and Lias+/+Ins2Akita/+ mice (Table 1).
Figure 1.
Plasma glucose levels in Lias+/+Ins2Akita/+ mice (□) and Lias+/−Ins2Akita/+ mice (■) from 7 to 28 weeks of age. Lias+/+ mice (○) and Lias+/− (●) mice served as nondiabetic controls. Blood was drawn after 5 hours of fasting. The numbers in parentheses indicate the number of animals in each group. Each value represents the group mean±SEM (*P<0.05, Lias+/−Ins2Akita/+ versus Lias+/+Ins2Akita/+ mice).
Table 1.
Laboratory data in experimental animals
| Parameters | Lias+/− (n=8) | Lias+/+ (n=8) | Lias+/−Ins2Akita/+ (n=18) | Lias+/+Ins2Akita/+ (n=16) | P Value |
|---|---|---|---|---|---|
| Systolic pressure (mmHg) | NA | NA | 135±4 | 126±3 | <0.01 |
| Diet intake (g/d) | 3.0±0.8 | 2.8±0.6 | 8.0±0.3 | 7.4±0.3 | 0.42 |
| Water intake (ml/d) | 2.7±0.6 | 2.6±0.8 | 28.9±0.6 | 27.0±0.4 | 0.24 |
| Body weight (g) | 31.7±1.1 | 30.3±3.7 | 28.6±0.6 | 28.2±0.7 | 0.18 |
| Plasma | |||||
| cholesterol (mg/dl) | 60.5±5.5 | 65.6±8.8 | 88±8 | 78±6 | 0.10 |
| triglyceride (mg/dl) | 47.5±4 | 44.2±3.6 | 109±13 | 110±13 | 0.14 |
| free fatty acid (mg/dl) | 0.36±0.05 | 0.39±0.07 | 0.46±0.03 | 0.40±0.03 | 0.07 |
| Kidney | |||||
| urine volume (ml/d) | 1.2±0.3 | 1.2±0.8 | 27.9±1.5 | 25.3±1.8 | 0.15 |
| kidney weight (g) | 0.20±0.02 | 0.21±0.05 | 0.27±0.04 | 0.26±0.03 | 0.52 |
| kidney weight/body weight (mg/g) | 6.31±0.25 | 6.93±0.41 | 9.44±0.28 | 9.21±0.29 | 0.81 |
| GBM thickness (μm) | NA | NA | 268±16 | 211±10 | <0.05 |
| GFR (μl/min/g body weight) | NA | NA | 29.6±2.6 | 32.8±3.2 | 0.99 |
| urine nitric oxide/creatinine (μM/mg) | 2.1±0.8 | 2.5±0.4 | 8.1±3.7 | 3.2±2.9 | 0.32 |
| lactate (mM/μg protein) | 0.74±0.11 | 0.46±0.09 | 0.97±0.08 | 0.99±0.07 | 0.86 |
| pyruvate (mM/μg protein) | 1.8±0.16 | 1.9±0.22 | 2.0±0.11 | 2.3±0.12 | 0.09 |
Data shown are mean±SEM for the male mice at 7 months. P values are for comparisons between Lias+/−Ins2Akita/+ and Lias+/+Ins2Akita/+ mice. NA, not available.
Hypertension in Lias+/+Ins2Akita/+ and Lias+/−Ins2Akita/+ Mice
Because hypertension is a common characteristic in patients with DN, we monitored systolic blood pressure of the mice in this study. Systolic blood pressure was significantly higher in 28-week-old Lias+/−Ins2Akita/+ mice compared with their Lias+/+Ins2Akita/+ counterparts (Table 1).
Renal Phenotypes in Lias+/−Ins2Akita/+ and Lias+/+Ins2Akita/+ Mice
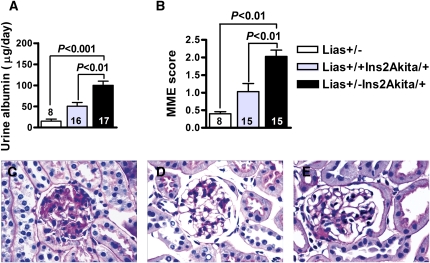
We measured urine albumin excretion, kidney to body weight ratio, and renal histopathology to assess renal changes in Lias+/−Ins2Akita/+ and Lias+/+Ins2Akita/+ mice. Urine albumin excretion was 2-fold higher in 28-week-old Lias+/−Ins2Akita/+ mice than in Lias+/+Ins2Akita/+ littermates (100.3±18.0 and 50±11.9, respectively) (Figure 2A). GFR was lower in 28-week-old Lias+/−Ins2Akita/+ mice than in Lias+/+Ins2Akita/+ mice, but the difference was not statistically significant (Table 1). Moreover, concentrations of kidney lactate and pyruvate, as well as the lactate/pyruvate ratio, were not significantly different between Lias+/−Ins2Akita/+ mice and Lias+/+Ins2Akita/+ mice (Table 1). The urine nitric oxide level was higher in Lias+/−Ins2Akita/+ mice than in Lias+/+Ins2Akita/+ mice, although the difference was not statistically significant.
Figure 2.
Kidney parameters and morphologic features observed in glomeruli from Lias+/−Ins2Akita/+ mice, nondiabetic Lias+/− mice (open bars), Lias+/+Ins2Akita/+ mice (gray bars), and Lias+/−Ins2Akita/+ mice (black bars) at 28 weeks of age. (A) Daily urinary albumin excretion. (B) MME fraction, quantified as the region of positive PAS staining and expressed as a function of total glomerular tuft area. Data are expressed as mean±SEM. The numbers inside the bars indicate the number of animals. Representative glomerular histopathology in (C) Lias+/−Ins2Akita/+, (D) Lias+/+Ins2Akita/+, and (E) nondiabetic Lias+/− mice at 7 months of age. PAS stain; original magnification, ×400.
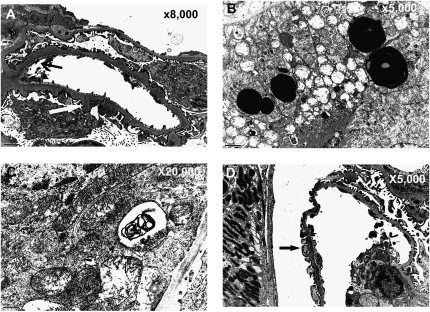
Gross kidney size, expressed as the kidney index (kidney mass/body mass), was not significantly different between the diabetic animals of either genotype (Table 1). Figure 2, C–E shows representative glomerular light micrographs from Lias+/−Ins2Akita/+ mice, Lias+/+Ins2Akita/+ mice, and nondiabetic Lias+/− mice. We observed moderate mesangial matrix expansion (MME), as evidenced by increased accumulation of a periodic acid–Schiff (PAS)-positive substance in the mesangial area, in 28-week-old Lias+/+Ins2Akita/+ mice (Figure 2C), whereas the expansion was significantly worse in Lias+/−Ins2Akita/+ mice (Figure 2D). In contrast, MME was either undetectable or very mild in the nondiabetic mice (Figure 2E). Semiquantitative analysis revealed significantly higher MME scores in 28-week-old Lias+/−Ins2Akita/+ mice compared with Lias+/+Ins2Akita/+ mice (Figure 2B). In addition, basement membrane thickening was significantly increased in Lias+/−Ins2Akita/+ mice (Table 1). Transmission electron microscopy examinations of Lias+/−Ins2Akita/+ glomeruli showed segmental structural irregularities of glomerular basement membranes (GBM), including thickening and peculiar seesawing of the lamina rara externa GBM with protrusions into Bowman’s space (Figure 3A). Some epithelium-like cells exhibited villous cytoplasmic projections and loss of fenestration, indicating that they are segmentally activated (Figure 3A). Rarely observed, thinning of the lamina densa was seen along capillary walls, located immediately adjacent to thickened segments with protrusions of lamina densa (Figure 3A). Proximal tubular epithelium-like cells showed mitochondrial structural irregularities. These alterations included dilation and disruption of cisternae, enlarged lysosomes containing an electron-dense substance, and scattered zebra bodies with laminated lipid particles that are assumed to be lipofuscin deposits (Figure 3, B and C). Segmental podocyte changes with effacement of foot processes, although mild, were primarily detected in Lias+/−Ins2Akita/+ mice (Figure 3D). With the exception of mild MME and few dilated mitochondria, the abnormal ultrastructural changes described above were not observed in Lias+/+Ins2Akita/+ mice. We did not note characteristic and diagnostic electron-dense, immune complex–type deposits in kidneys of either genotype.
Figure 3.
Representative electron micrographs from Lias+/−Ins2Akita/+ mice at 7 months of age. (A) Segmental structural irregularities of thickened GBM, including seesawing of the lamina rara externa and lamina densa protrusions into Bowman’s space, vaguely resembling “humps” (white arrow). Loss of the fenestration in endothelial cells is also depicted (black arrow). Thinning of the lamina densa, sometimes located immediately adjacent to thickened segments with densa protrusions, was also observed (black arrow). (B) Structural irregularities of mitochondria, including dilation and disruption of cisternae and enlargement of lysosomes containing an electron-dense substance (presumed to be lipofuscins). (C) Scattered zebra bodies with laminated lipid particles in proximal tubular epithelium-like cells. (D) Mild podocyte effacement occurred in some areas of GBM (arrow). Magnification, ×8000 in A; ×5000 in B; ×20,000 in C; ×5000 in D.
Whole Body and Kidney Oxidative Stress
Oxidative Stress/Antioxidant Markers
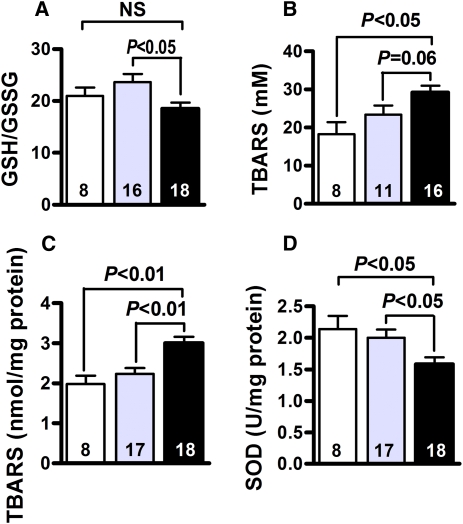
To investigate the mechanism(s) by which Lias+/−Ins2Akita/+ mice are more susceptible to DN, we examined oxidative stress markers in the entire body and kidney cortex. The systemic redox status of the whole body was determined as the ratio of reduced/oxidized glutathione (GSH/GSSG) in erythrocytes. The GSH/GSSG ratio was lower (P<0.05) in Lias+/−Ins2Akita/+ mice than in Lias+/+Ins2Akita/+ mice (Figure 4A). In addition, the plasma thiobarbituric acid reactive substances (TBARS) level was close to reaching statistical significance between Lias+/−Ins2Akita/+ mice and Lias+/+Ins2Akita/+ mice (P=0.06) (Figure 4B). In addition, the TBARS level in Lias+/−Ins2Akita/+ kidney was significantly higher than in Lias+/+Ins2Akita/+ kidney (Figure 4C). Accordingly, SOD antioxidant enzyme activity was significantly reduced in Lias+/−Ins2Akita/+ kidney compared with Lias+/−Ins2Akita/+ kidney at 7 months of age (Figure 4D). Collectively, these data strongly suggest that the increase in reactive oxygen species contributes to the development of DN.
Figure 4.
Systemic and kidney cortex oxidative stress status. (A) GSH/GSSG ratio in erythrocytes. (B) Plasma TBARS. (C) TBARS in kidney cortex. (D) Superoxide dismutase activity in kidney cortex from nondiabetic Lias+/− mice (open bars), Lias+/+Ins2Akita/+ mice (gray bars), and Lias+/−Ins2Akita/+ mice (black bars). The numbers inside the bars indicate the number of animals in each group. Results are expressed as mean±SEM.
In Situ Visualization of Superoxide and Superoxide-Derived Oxidant Production
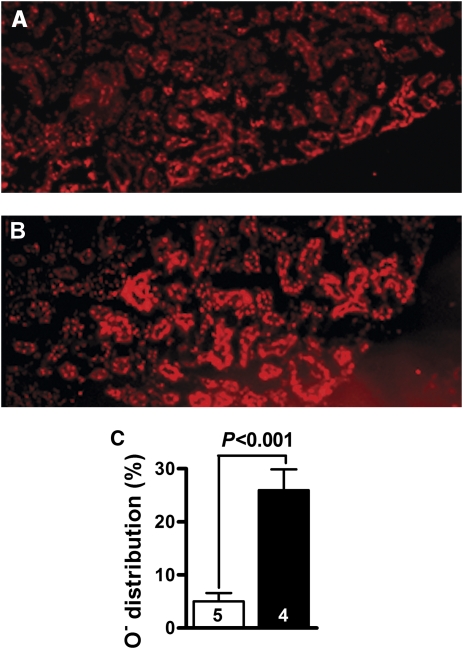
Superoxide and superoxide-derived oxidant products, visualized by ethidium fluorescence, were increased in Lias+/−Ins2Akita/+ mice (Figure 5A) compared with levels in Lias+/+Ins2Akita/+ mice (Figure 5B). Ethidium fluorescence was mainly distributed within the epithelium-like cells of proximal tubules. In addition, as depicted in Figure 5C, the fluorescent/nonfluorescent area ratios were considerably different between the two genotypic mice (5%±1.6% for Lias+/+Ins2Akita/+ mice versus 26%±3.9% for Lias+/−Ins2Akita/+ mice).
Figure 5.
Superoxide production in the kidneys. (A) Distribution area and intensity of ethidium fluorescence in Lias+/+Ins2Akita/+ mice. (B) Ethidium fluorescence in Lias+/−Ins2Akita/+ mice. (C) Quantitative measurement of ethidium fluorescence. The white bar represents Lias+/+Ins2Akita/+ mice, and the black bar represents Lias+/−Ins2Akita/+ mice. Data are mean±SEM for four to five samples per group.
Gene Expression
As shown in Table 2, gene expression of Sod1 and Sod2 was significantly higher in the Lias+/−Ins2Akita/+ kidney cortex than in the Lias+/+Ins2Akita/+ cortex. In addition, among other genes that are often involved in DN development, mRNA levels for collagen IV, TGF-β1, and connective tissue growth factor were higher but nephrin was lower in Lias+/−Ins2Akita/+ mice than in Lias+/+Ins2Akita/+ mice (Table 2). Collagen I expression did not differ significantly between the two genotypes (Table 2). Among genes related to the regulation of blood pressure and nitric oxide levels, mRNA for endothelial nitric oxide synthase (eNOS) renin, angiotensin I–converting enzyme (ACE), and angiotensin II type 1 receptor a (Atr1a) were not significantly different between the two genotypes (Table 2).
Table 2.
Gene expression in kidney
| Gene | Lias+/−Ins2Akita/+ (n=15) | Lias+/+Ins2Akita/+ (n=14) | P Value |
|---|---|---|---|
| Nephrin | 0.48±0.07 | 1.00±0.14 | <0.01 |
| Sod1 | 1.66±0.21 | 1.00±0.12 | <0.05 |
| Sod2 | 1.55±0.17 | 1.00±0.11 | <0.05 |
| Sod3 | 0.80±0.10 | 1.00±0.12 | 0.09 |
| Col I | 1.27±0.18 | 1.00±0.23 | 0.54 |
| Col IV | 1.44±0.19 | 1.00±0.10 | <0.05 |
| Tgfβ1 | 1.56±0.16 | 1.00±0.12 | <0.05 |
| Lias | 0.35±0.03 | 1.00±0.10 | <0.001 |
| eNOS | 2.08±61.7 | 1.00±0.24 | 0.12 |
| Renin | 1.08±0.19 | 1.00±0.21 | 0.78 |
| ACE | 1.50±0.41 | 1.00±0.20 | 0.32 |
| Atr1α | 1.74±0.68 | 1.00±0.37 | 0.38 |
mRNA levels in kidney cortex are expressed as mean±SEM relative to the mean levels of Lias+/+Ins2Akita/+ as 1.00.
LA Synthase Protein Amount
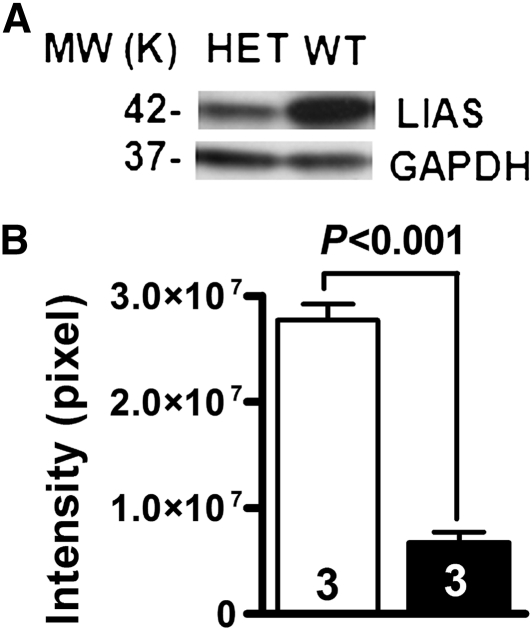
To determine protein levels of LA synthase, total proteins were isolated from kidney and subjected to Western blot analysis using an antibody against mouse Lias. The amounts of Lias protein, quantified by densitometry, decreased by 74% in the Lias+/−Ins2Akita/+ kidney compared with the Lias+/−Ins2Akita/+ kidney (Figure 6, A and B).
Figure 6.
(A) Western blot for Lias protein in the kidney cortex (HET, Lias+/−Ins2Akita/+ mice; WT, Lias++Ins2Akita/+ mice). (B) The amounts of Lias protein in Lias+/−Ins2Akita/+ kidney (black bar) and in Lias+/+Ins2Akita/+ kidney (white bar), quantified by Image Quant software. Results are given as band intensities of Western blot signals and Western blot analysis of kidney Lias gene expression are represented as mean ± SEM. MW, molecular weight; GAPDH, glyceraldehyde-3-phosphate dehydrogenase.
Citrate Synthase Activity
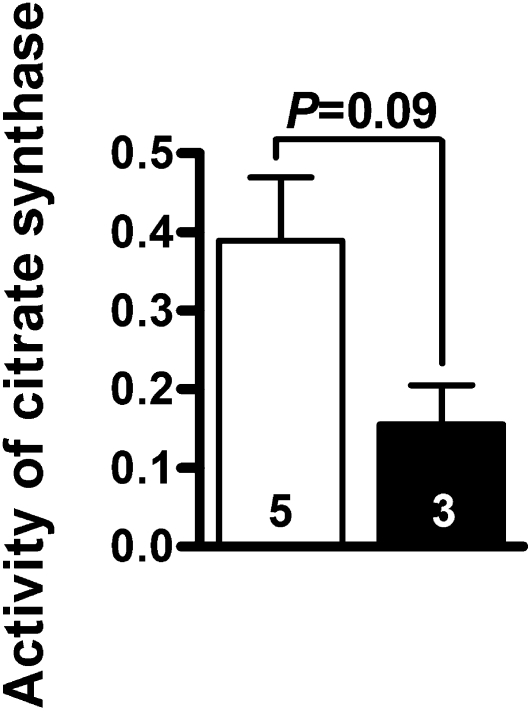
The above-described histologic observations suggest significant mitochondrial damage in the proximal tubular cells. To assess mitochondrial function, we measured citrate synthase activity in the kidney homogenates. Citrate synthase catalyzes the initial step in the trichloroacetic acid cycle and is a quantitative enzyme marker for the presence of intact mitochondria.16,17 Citrate synthase activity in the Lias+/−Ins2Akita/+ kidney (n=3) was 40% of that in the Lias+/+Ins2Akita/+ kidney (n=3; Figure 7), although this difference was not statistically significant (P=0.09).
Figure 7.
Citrate synthase activity (μmol CoA/min/mg) in Lias+/+Ins2Akita/+ (white bar) and Lias+/−Ins2Akita/+ (black bar) kidneys. Results are expressed as mean±SEM. The numbers inside the bars indicate the number of animals.
DISCUSSION
In this study, we tested the hypothesis that diabetic Ins2Akita/+ mice with a reduced capacity to produce LA are susceptible to increased oxidative stress and consequently develop accelerated diabetic kidney disease. Our results revealed that albuminuria, hypertension, and morphologic changes (e.g., MME, GBM thickening, and diffused podocyte effacement) in the Ins2Akita/+ mice were worse in the Lias+/−Ins2Akita/+ mice. These alterations were associated with decreased antioxidant capacity/increased oxidative stress in both the whole body and kidney cortex. We reached this conclusion from our observation of reduced Lias gene expression with correspondingly decreased LA synthase protein expression, reduced GSG/GSSG ratio in erythrocytes, decreased SOD activity, and increased superoxide production, lipid peroxidation, and mitochondrial damage in kidney proximal tubules. These changes were accompanied by compensatory upregulation of Sod1 and Sod2 gene expression in the Lias+/−Ins2Akita/+ mice. These findings suggest that decreased antioxidant capacity contributes to accelerated DN. Ueno et al.18 also reported increased oxidative stress in Ins2Akita/+ kidney, and their results showed that hexanoyl-lysine and dityrosine, biomarkers of oxidative stress, increased in convoluted tubules.
Mitochondria are believed to be the major organelles involved in superoxide production. They consume approximately 85% of the oxygen used by cells, and they are also the primary targets for oxidative stress because of their lack of protection from histone and DNA repair.19 Overproduction of superoxide anions by the mitochondrial electron transport chain during diabetes has been postulated as the primary initiating event in the development of diabetic complications.20,21 The observation that excessive superoxide production coexists with the structural irregularities of mitochondria is consistent with the high mitochondrial density in proximal tubules. In support of the role of oxidative stress in mitochondrial damage, lipofuscins were primarily present in the proximal tubules of Lias+/−Ins2Akita/+ mice, whereas lipofuscins were not observed in Lias+/+Ins2Akita/+ mice. Lipofuscins are the age-associated accumulation of damaged mitochondria.22 These subcellular structures are resistant to lysosomal enzyme digestion, presumably because of protein cross-linking by lipid peroxidation.23 Our results revealed significantly increased products of lipid peroxidation, such as TBARS, in the kidney cortex in Lias+/−Ins2Akita/+ mice. These peroxidation products lay the foundation for lipofuscin formation. Lipofuscin accumulation is accelerated by enhanced mitochondrial superoxide production.23 In turn, accumulation of defective mitochondria is postulated to increase oxidative stress and further augment lipofuscin accumulation.23 Our experiments identified proximal tubule epithelium-like cells as a major site for superoxide generation, indicated by a markedly increased production of superoxide anions and mitochondrial injury in Lias+/−Ins2Akita/+ mice, both of which are likely to be a direct consequence of decreased production of endogenous LA. Sod1 and Sod2 are mainly distributed in proximal tubules as the first line of defense.24,25 Our data showed that the increase of superoxide was accompanied by the upregulated expression of Sod1 and Sod2. Upregulation of each may serve as a compensatory response,26–28 but this limited upregulation may be insufficient to protect mitochondria from oxidative damage. Renal proximal tubules, possessing numerous mitochondria, represent metabolically active structural and functional components of nephrons and are responsible for re-absorption of the majority of filtered constituents, including albumin, glucose, and electrolytes. Accordingly, mitochondrial damage could lead to proximal tubular energy deficits and functional impairment. In agreement with this postulation, citrate synthase activity in the Lias+/−Ins2Akita/+ kidney was 40% of that in Lias+/+Ins2Akita/+ kidney, but this difference did not reach statistical significance (P=0.09), possibly because of a small sample number and thus a large variance. The data suggest that mitochondrial function is likely impaired in the kidney.
Our data showed that BP in Lias+/+Ins2Akita/+ mice was significantly higher (by 11 mmHg) than that in Lias+/−Ins2Akita/+ mice. Studies in diabetic rats and different hypertensive rat models have shown the potential for LA supplementation to decrease BP.29,30 Because genes encoding key proteins in the renin–angiotensin system (including renin, ACE, and Atr1α) were not significantly different between the two genotypes, the renin–angiotensin system is unlikely to mediate the effects of LA on BP (Table 2). Other proposed mechanisms include the participation of LA in mitochondrial-associated metabolic pathways and/or in cell signaling that may improve coupling of eNOS.31
In this study, we used F1 mice between 129/SvEv and C57BL/6J strains. Earlier studies in mice have investigated the effect of genetic background on susceptibility or resistance to the development of DN.15,32 Indeed, kidney injury is more pronounced in Ins2Akita/+ mice irrespective of whether they are on 129/SvEv, DBA, or C57BL/6J background. Furthermore, severity in F1 animals (DBA × B6 cross) was similar to DBA inbred strain. Our experimental F1 Ins2Akita/+ mice are genetically identical except at the Lias gene. Consequently, the effects of the genetic deficiency of Lias gene expression were studied in the uniform background. In addition, F1 progeny are usually more vigorous than inbred mice because they lack detrimental recessive mutations that can affect inbred strains.33 The Lias+/− effects could have been different if an inbred strain background was used because of unknown gene–gene interactions.
As previously described, in addition to being a natural antioxidant, LA is also a cofactor for several mitochondrial enzymes that are essential in metabolism and energy production. Thus, potential metabolic regulation by LA could contribute to the treatment of diabetes and DN. In other words, the beneficial effects that LA exerts on DN are likely derived from its combined effects of antioxidant and metabolic regulations. Pathologic changes seen in the 28-week-old F1 Ins2Akita/+ mice mimic early stages of human DN, and we did not detect glomerulosclerosis, arteriolar hyalinosis, and tubulointerstitial fibrosis. Because untreated diabetic mice, especially Lias+/−Ins2Akita/+ mice, exhibit progressively severe polyuria and reduced survival after 7 months of age, this hampered longer-term studies. Nevertheless, our findings from the genetic model demonstrate that Lias deficiency leads to an increase in oxidative stress and subsequently accelerated DN development with a particularly enhanced mitochondrial damage in proximal tubular cells. These data provide insight into the pathophysiology of DN and the mechanism responsible for the preclinical development of new therapeutic strategies.
CONCISE METHODS
Experimental Animals
Twenty-three Lias+/−Ins2Akita/+ mice and 19 Lias+/+Ins2Akita/+ littermates were F1 offspring of the cross between Ins2Akita/+C57BL/6J mice and Lias+/−129/SvEv mice. Only males were studied because hyperglycemia in Ins2Akita/+ mice is sexually dimorphic, with hyperglycemia being worse in males.14 The mice were fed normal mouse chow and had ad libitum access to water. The Institutional Animal Care and Use Committee at the University of North Carolina approved the experimental protocols, which were in accordance with National Institutes of Health standards.
Biochemical Parameters
Blood glucose was monitored monthly in the mice from 7 to 28 weeks using the One-Touch Lifescan meter (Lifescan Inc, Milpitas, CA) on samples obtained after a 5-hour fasting. Plasma glucose, total cholesterol, triglyceride, and free fatty acids were examined using assay kits (Wako, Richmond, VA). Citrate synthase activity (EC 2.3.3.1) in mouse kidney was determined using a modified protocol34 and activity was depicted in micromoles per milliliter per minute. The reaction was started by adding 0.1 mM oxaloacetate (OAA) to the reaction mixture consisting of 20 mM HEPES buffer, pH 7.4; 0.1 mM 5-5′-dithiobis(2-nitrobenzoic acid); and 1 mM acetyl-CoA. Activity was calculated by subtracting ΔA412/min before the addition of OAA from ΔA412/min after the addition of OAA. Protein concentration was determined using a BCA protein assay method (Thermo Scientific, Rockford, IL). To determine lactate and pyruvate concentrations, kidneys were homogenized in PBS buffer (pH 7.4) and centrifuged, and the supernatant was assayed for respective enzyme activity. Lactic acid concentrations in tissues were determined as described.35 Pyruvate concentrations were measured using a pyruvate assay kit (BioVision, Mountain View, CA). Urine stable nitric oxide metabolites, nitrate (NO3), were measured using a colorimetric assay kit (Cayman Chemical, Ann Arbor, MI). The absorbance was read on a microplate reader using a test wavelength of 540 nm.
Urinary Albumin Measurements
At 14 and 28 weeks of age, mice were placed in metabolic cages to record food consumption, water intake, body weight, and urine output for 48 hours. The albumin concentration in the urine was determined using an ELISA kit according to the manufacturer’s instructions (Exocell, Philadelphia, PA).
Renal Function and Histopathology
Creatinine clearance was used to estimate GFR. Blood was collected at the end of 24 hours in metabolic cages for creatinine analysis.36 Mice were perfused at 120 mmHg with 0.9% saline containing heparin, followed by 4% paraformaldehyde solution. The kidney was embedded in paraffin. Three-micrometer sections were cut and stained with hematoxylin and eosin and PAS for examination by light microscopy. MME was examined in a blinded fashion and scored from 0 to 4 according to the ratio of glomerular expansion area/normal area: score 0, a normal glomerulus; score 1, increased mesangial matrix <25% of glomerular tuft; score 2, MME of 25%–50% of glomerular tuft; score 3, MME of 50%–75%; and score 4, MME of >75% of the tuft. MME was derived from assessment of three glomerular profiles on each mouse. Next, the kidneys were conventionally prepared for transmission electron microscopy.37 The samples were examined with LEO 910 electron microscope (LEO Electron Microscopy Inc, Thornwood, NY). Three kidney samples from each experimental group were randomly chosen for electron microscopic observation. GBM thickness was measured at five evenly distributed points per loop and semiquantified using ImageJ software. Forty to 55 GBM points were measured for each sample. For mitochondrial damage in epithelium-like cells from proximal tubules, 10–12 fields (magnification, ×8000) were examined in each genotype.
Oxidative Stress Markers
Plasma and tissue lipid peroxide content was determined using TBARS assay38 with malondialdehyde as a standard. The ratio of GSH/GSSG in red cells was determined by using an assay kit (Calbiochem, San Diego, CA). SOD activity in kidney cortex was measured by using SOD assay kit that measures all three types of SOD (Cayman).
In Situ Visualization of Superoxide Anion and Superoxide-Derived Oxidant Production
Superoxide and superoxide-derived oxidant production in the kidney were visualized by hydroethidine histochemistry with minor modifications.39 Mice were injected intraperitoneally with dihydroethidium (10 mg/kg) in 0.5% carboxymethyl cellulose, and the solvent alone was used as a control. After 30 minutes, the animals were killed, and the kidney was removed. Cryosections (10 μm) were examined by fluorescence microscopy (excitation at 510 nm; emission at 580 nm) for accumulation of ethidium hydroethidium oxidation product.
Reverse Transcriptase-PCR
Total RNAs in kidney cortex were isolated using an ABI 6700 Automated Nucleic Acid Workstation following the manufacturer’s protocol (Applied Biosystems, Foster City, CA). Relative mRNA amounts were determined using real-time quantitative reverse transcriptase-PCR (Applied Biosystems) with β-actin as the reference gene in each reaction.40 Antioxidant genes (Lias, Sod1, Sod2, and Sod3), genes related to glomerular structure and function (nephrin), and genes implicated in kidney fibrosis (TGF-β1, connective tissue growth factor, and collagen I and IV) were examined. Likewise, the expression of genes related to hypertension (eNOS, renin, ACE, and Atr1a) was assessed.
Systolic BP Measurement
Systolic BP was determined in conscious mice using a tail-cuff method.41 The first 10 readings were discarded, and 30 readings were taken to obtain daily BP. Average BP on 5 consecutive days was taken to represent BP of each mouse.
Western Blot Analysis and Protein Quantification
Freshly isolated kidneys were frozen in liquid nitrogen. The kidney cortex was homogenized at 4°C in buffer (50 mM Tris, pH 8; 150 mM NaCl; 0.5% deoxycholate; 0.1% SDS) containing protease inhibitors (Roche Diagnostics, Indianapolis, IN). Protein concentrations were measured by BCA protein assay method (Thermo Scientific, Rockford, IL). Twenty micrograms of protein was subjected to SDS-PAGE, and Western blots were prepared using a standard protocol. A rabbit anti-mouse polyclonal antibody against LA synthase (Gentex, Irvine, CA) was used as a primary antibody at 1:1000. The protein bands were visualized using the chemiluminescent method and quantified with Image Quant LAS4000 software (GE Healthcare, Piscataway, NJ).
Statistical Analyses
All results are reported as mean±SEM. Comparison between groups was performed using ANOVA and the Tukey-Kramer honestly significant difference method for pairwise comparisons for multiple group comparison. P<0.05 was considered significant.
DISCLOSURES
None.
Acknowledgments
We thank Shinja Kim, Hong Xiao, Liya Qin, and Yianwu Zen for technical help and Lance Johnson and Benjamin Bleasdale for critical reading of the manuscript.
This work was supported by National Institutes of Health Grants HL042630 and HL87946 to N.M. and a University of North Carolina Research Council grant to X.Y.
Footnotes
Published online ahead of print. Publication date available at www.jasn.org.
REFERENCES
- 1.Foley RN, Collins AJ: End-stage renal disease in the United States: An update from the United States Renal Data System. J Am Soc Nephrol 18: 2644–2648, 2007 [DOI] [PubMed] [Google Scholar]
- 2.Baynes JW, Thorpe SR: Role of oxidative stress in diabetic complications: A new perspective on an old paradigm. Diabetes 48: 1–9, 1999 [DOI] [PubMed] [Google Scholar]
- 3.Reed LJ: From lipoic acid to multi-enzyme complexes. Protein Sci 7: 220–224, 1998 [DOI] [PMC free article] [PubMed] [Google Scholar]
- 4.Melhem MF, Craven PA, Derubertis FR: Effects of dietary supplementation of alpha-lipoic acid on early glomerular injury in diabetes mellitus. J Am Soc Nephrol 12: 124–133, 2001 [DOI] [PubMed] [Google Scholar]
- 5.Oksala NK, Lappalainen J, Laaksonen DE, Khanna S, Kaarniranta K, Sen CK, Atalay M: Alpha-lipoic acid modulates heat shock factor-1 expression in streptozotocin-induced diabetic rat kidney. Antioxid Redox Signal 9: 497–506, 2007 [DOI] [PubMed] [Google Scholar]
- 6.Lee SJ, Kang JG, Ryu OH, Kim CS, Ihm SH, Choi MG, Yoo HJ, Kim DS, Kim TW: Effects of alpha-lipoic acid on transforming growth factor beta1-p38 mitogen-activated protein kinase-fibronectin pathway in diabetic nephropathy. Metabolism 58: 616–623, 2009 [DOI] [PubMed] [Google Scholar]
- 7.Yi X, Nickeleit V, James LR, Maeda N: α-Lipoic acid protects diabetic apolipoprotein E-deficient mice from nephropathy. J Diabetes Complications 25: 193–201, 2011 [DOI] [PMC free article] [PubMed] [Google Scholar]
- 8.Siu B, Saha J, Smoyer WE, Sullivan KA, Brosius FC, 3rd: Reduction in podocyte density as a pathologic feature in early diabetic nephropathy in rodents: Prevention by lipoic acid treatment. BMC Nephrol 7: 6, 2006 [DOI] [PMC free article] [PubMed] [Google Scholar]
- 9.Chang JW, Lee EK, Kim TH, Min WK, Chun S, Lee KU, Kim SB, Park JS: Effects of alpha-lipoic acid on the plasma levels of asymmetric dimethylarginine in diabetic end-stage renal disease patients on hemodialysis: A pilot study. Am J Nephrol 27: 70–74, 2007 [DOI] [PubMed] [Google Scholar]
- 10.Bhatti F, Mankhey RW, Asico L, Quinn MT, Welch WJ, Maric C: Mechanisms of antioxidant and pro-oxidant effects of alpha-lipoic acid in the diabetic and nondiabetic kidney. Kidney Int 67: 1371–1380, 2005 [DOI] [PubMed] [Google Scholar]
- 11.Yi X, Maeda N: Endogenous production of lipoic acid is essential for mouse development. Mol Cell Biol 25: 8387–8392, 2005 [DOI] [PMC free article] [PubMed] [Google Scholar]
- 12.Yi X, Kim K, Yuan W, Xu L, Kim HS, Homeister JW, Key NS, Maeda N: Mice with heterozygous deficiency of lipoic acid synthase have an increased sensitivity to lipopolysaccharide-induced tissue injury. J Leukoc Biol 85: 146–153, 2009 [DOI] [PMC free article] [PubMed] [Google Scholar]
- 13.Kleemann A, Borbe HO, Ulrich H: Thioctsaure: a-liponsaure. In: Thioctsaure: Neue biochemische, pharmakologische und klinische Erkenntnisse zur Thioctsaure, edited by Borbe HO, Ulrich H, Frankfurt am Main, pmi Verlag, 1989 [Google Scholar]
- 14.Yoshioka M, Kayo T, Ikeda T, Koizumi A: A novel locus, Mody4, distal to D7Mit189 on chromosome 7 determines early-onset NIDDM in nonobese C57BL/6 (Akita) mutant mice. Diabetes 46: 887–894, 1997 [DOI] [PubMed] [Google Scholar]
- 15.Gurley SB, Clare SE, Snow KP, Hu A, Meyer TW, Coffman TM: Impact of genetic background on nephropathy in diabetic mice. Am J Physiol Renal Physiol 290: F214–F222, 2006 [DOI] [PubMed] [Google Scholar]
- 16.Marco R, Pestaña A, Sebastian J, Sols A: Oxaloacetate metabolic crossroads in liver. Enzyme compartmentation and regulation of gluconeogenesis. Mol Cell Biochem 3: 53–70, 1974 [DOI] [PubMed] [Google Scholar]
- 17.Sivitz WI, Yorek MA: Mitochondrial dysfunction in diabetes: From molecular mechanisms to functional significance and therapeutic opportunities. Antioxid Redox Signal 12: 537–577, 2010 [DOI] [PMC free article] [PubMed] [Google Scholar]
- 18.Ueno Y, Horio F, Uchida K, Naito M, Nomura H, Kato Y, Tsuda T, Toyokuni S, Osawa T: Increase in oxidative stress in kidneys of diabetic Akita mice. Biosci Biotechnol Biochem 66: 869–872, 2002 [DOI] [PubMed] [Google Scholar]
- 19.Shigenaga MK, Hagen TM, Ames BN: Oxidative damage and mitochondrial decay in aging. Proc Natl Acad Sci USA 91: 10771–10778, 1994 [DOI] [PMC free article] [PubMed] [Google Scholar]
- 20.Brownlee M: Biochemistry and molecular cell biology of diabetic complications. Nature 414: 813–820, 2001 [DOI] [PubMed] [Google Scholar]
- 21.Forbes JM, Coughlan MT, Cooper ME: Oxidative stress as a major culprit in kidney disease in diabetes. Diabetes 57: 1446–1454, 2008 [DOI] [PubMed] [Google Scholar]
- 22.Brunk UT, Terman A: Lipofuscin: mechanisms of age-related accumulation and influence on cell function. Free Radic Biol Med 33: 611–619, 2002 [DOI] [PubMed] [Google Scholar]
- 23.Terman A, Brunk UT: Lipofuscin. Int J Biochem Cell Biol 36: 1400–1404, 2004 [DOI] [PubMed] [Google Scholar]
- 24.Fujita H, Fujishima H, Chida S, Takahashi K, Qi Z, Kanetsuna Y, Breyer MD, Harris RC, Yamada Y, Takahashi T: Reduction of renal superoxide dismutase in progressive diabetic nephropathy. J Am Soc Nephrol 20: 1303–1313, 2009 [DOI] [PMC free article] [PubMed] [Google Scholar]
- 25.Gwinner W, Deters-Evers U, Brandes RP, Kubat B, Koch KM, Pape M, Olbricht CJ: Antioxidant-oxidant balance in the glomerulus and proximal tubule of the rat kidney. J Physiol 509: 599–606, 1998 [DOI] [PMC free article] [PubMed] [Google Scholar]
- 26.Munusamy S, MacMillan-Crow LA: Mitochondrial superoxide plays a crucial role in the development of mitochondrial dysfunction during high glucose exposure in rat renal proximal tubular cells. Free Radic Biol Med 46: 1149–1157, 2009 [DOI] [PubMed] [Google Scholar]
- 27.Obrosova IG, Fathallah L, Liu E, Nourooz-Zadeh J: Early oxidative stress in the diabetic kidney: effect of DL-alpha-lipoic acid. Free Radic Biol Med 34: 186–195, 2003 [DOI] [PubMed] [Google Scholar]
- 28.Reddi AS, Bollineni JS: Renal cortical expression of mRNAs for antioxidant enzymes in normal and diabetic rats. Biochem Biophys Res Commun 235: 598–601, 1997 [DOI] [PubMed] [Google Scholar]
- 29.Vasdev S, Ford CA, Parai S, Longerich L, Gadag V: Dietary alpha-lipoic acid supplementation lowers blood pressure in spontaneously hypertensive rats. J Hypertens 18: 567–573, 2000 [DOI] [PubMed] [Google Scholar]
- 30.Koçak G, Aktan F, Canbolat O, Ozoğul C, Elbeğ S, Yildizoglu-Ari N, Karasu C. ADIC Study Group-Antioxidants in Diabetes-Induced Complications: Alpha-lipoic acid treatment ameliorates metabolic parameters, blood pressure, vascular reactivity and morphology of vessels already damaged by streptozotocin-diabetes. Diabetes Nutr Metab 13: 308–318, 2000 [PubMed] [Google Scholar]
- 31.Kizhakekuttu TJ, Widlansky ME: Natural antioxidants and hypertension: promise and challenges. Cardiovasc Ther 28: e20–e32, 2010 [DOI] [PMC free article] [PubMed] [Google Scholar]
- 32.Gurley SB, Mach CL, Stegbauer J, Yang J, Snow KP, Hu A, Meyer TW, Coffman TM: Influence of genetic background on albuminuria and kidney injury in Ins2(+/C96Y) (Akita) mice. Am J Physiol Renal Physiol 298: F788–F795, 2010 [DOI] [PMC free article] [PubMed] [Google Scholar]
- 33.Wang CH, Li F, Hiller S, Kim HS, Maeda N, Smithies O, Takahashi N: A modest decrease in endothelial NOS in mice comparable to that associated with human NOS3 variants exacerbates diabetic nephropathy. Proc Natl Acad Sci USA 108: 2070–2075, 2011 [DOI] [PMC free article] [PubMed] [Google Scholar]
- 34.Srere PA: Citrate synthase. In: Methods in Enzymology, Vol. XIII, 3rd Ed., edited by Colowick SP, Kaplan, NOP, London, Academic Press, 1969, pp 3−11 [Google Scholar]
- 35.Valero E, García-Carmona F: Optimizing enzymatic cycling assays: spectrophotometric determination of low levels of pyruvate and L-lactate. Anal Biochem 239: 47–52, 1996 [DOI] [PubMed] [Google Scholar]
- 36.Takahashi N, Boysen G, Li F, Li Y, Swenberg JA: Tandem mass spectrometry measurements of creatinine in mouse plasma and urine for determining glomerular filtration rate. Kidney Int 71: 266–271, 2007 [DOI] [PubMed] [Google Scholar]
- 37.Periyasamy-Thandavan S, Jiang M, Wei Q, Smith R, Yin XM, Dong Z: Autophagy is cytoprotective during cisplatin injury of renal proximal tubular cells. Kidney Int 74: 631–640, 2008 [DOI] [PubMed] [Google Scholar]
- 38.Lapenna D, Ciofani G, Pierdomenico SD, Giamberardino MA, Cuccurullo F: Reaction conditions affecting the relationship between thiobarbituric acid reactivity and lipid peroxides in human plasma. Free Radic Biol Med 31: 331–335, 2001 [DOI] [PubMed] [Google Scholar]
- 39.Wu DC, Teismann P, Tieu K, Vila M, Jackson-Lewis V, Ischiropoulos H, Przedborski S: NADPH oxidase mediates oxidative stress in the 1-methyl-4-phenyl-1,2,3,6-tetrahydropyridine model of Parkinson’s disease. Proc Natl Acad Sci USA 100: 6145–6150, 2003 [DOI] [PMC free article] [PubMed] [Google Scholar]
- 40.Kim HS, Lee G, John SW, Maeda N, Smithies O: Molecular phenotyping for analyzing subtle genetic effects in mice: Application to an angiotensinogen gene titration. Proc Natl Acad Sci USA 99: 4602–4607, 2002 [DOI] [PMC free article] [PubMed] [Google Scholar]
- 41.Krege JH, Hodgin JB, Hagaman JR, Smithies O: A noninvasive computerized tail-cuff system for measuring blood pressure in mice. Hypertension 25: 1111–1115, 1995 [DOI] [PubMed] [Google Scholar]


