Abstract
Inflammation contributes to the tubulointerstitial lesions of diabetic nephropathy. Toll-like receptors (TLRs) modulate immune responses and inflammatory diseases, but their role in diabetic nephropathy is not well understood. In this study, we found increased expression of TLR4 but not of TLR2 in the renal tubules of human kidneys with diabetic nephropathy compared with expression of TLR4 and TLR2 in normal kidney and in kidney disease from other causes. The intensity of tubular TLR4 expression correlated directly with interstitial macrophage infiltration and hemoglobin A1c level and inversely with estimated glomerular filtration rate. The tubules also upregulated the endogenous TLR4 ligand high-mobility group box 1 in diabetic nephropathy. In vitro, high glucose induced TLR4 expression via protein kinase C activation in a time- and dose-dependent manner, resulting in upregulation of IL-6 and chemokine (C-C motif) ligand 2 (CCL-2) expression via IκB/NF-κB activation in human proximal tubular epithelial cells. Silencing of TLR4 with small interfering RNA attenuated high glucose–induced IκB/NF-κB activation, inhibited the downstream synthesis of IL-6 and CCL-2, and impaired the ability of conditioned media from high glucose–treated proximal tubule cells to induce transmigration of mononuclear cells. We observed similar effects using a TLR4-neutralizing antibody. Finally, streptozotocin-induced diabetic and uninephrectomized TLR4-deficient mice had significantly less albuminuria, renal dysfunction, renal cortical NF-κB activation, tubular CCL-2 expression, and interstitial macrophage infiltration than wild-type animals. Taken together, these data suggest that a TLR4-mediated pathway may promote tubulointerstitial inflammation in diabetic nephropathy.
Diabetic nephropathy (DN) has become the most common cause of ESRD in developed countries, which is mainly due to the increasing prevalence of type 2 diabetes.1 Although DN is traditionally viewed as a nonimmune disease, emerging evidence suggests that inflammatory mechanisms play an important role in disease pathogenesis and progression.2 Indeed, the degeneration of renal function in diabetic patients with proteinuria is positively associated with tubulointerstitial inflammation.3 From a therapeutic perspective, blockade of the renin–angiotensin system coupled to strict glycemic and blood pressure control is the best documented treatment strategy for DN. Despite the initial promises shown in early clinical trials,4,5 many patients still progress relentlessly to ESRD. Therefore, investigations into the mechanisms underlying intrarenal inflammation may provide new therapeutic targets for anti-inflammatory strategies against DN.
Toll-like receptors (TLRs) are a conserved family of pattern recognition receptors that play a fundamental role in the innate immune system by triggering proinflammatory signaling pathways in response to microbial pathogens. In addition, TLRs are also activated by endogenous agonists of nonmicrobial origin and are involved in noninfectious inflammatory conditions.6 Recently, TLRs have been implicated in the pathogenesis of acute and chronic renal disorders. Among the 11 human TLRs, TLR4 and/or TLR2 may promote renal injury in renal ischemia-reperfusion injury,7,8 AKI,9 acute allograft rejection,10,11 renal fibrosis,12 and antibody-mediated glomerulonephritis,13,14 whereas TLRs 3, 7, and 9 predominantly contribute to inflammatory response in immune complex–mediated glomerulonephritis such as lupus nephritis.15–17 It has also been demonstrated that TLR2 and TLR4 expression is elevated in adipose tissue18 and muscle19 of human subjects and/or animal models of insulin resistance. Furthermore, in type 1 and type 2 diabetic patients, increased TLR2 and TLR4 expression in monocytes is positively correlated with hemoglobin A1c (HbA1c) levels20 and homeostasis model assessment–insulin resistance,21 suggesting TLR2 and TLR4 might be a molecular link between inflammation and diabetes. To date, the precise role of TLR2 and TLR4 in tubulointerstitial inflammation during DN remains unknown.
Tubulointerstitial inflammation is a hallmark of DN. Previously, we demonstrated that high glucose (HG) and advanced glycation end products stimulate tubular inflammation in vitro.22,23 HG induced IL-6 and chemokine (C-C motif) ligand 2 (CCL-2) expression in proximal tubular epithelial cells (PTECs) via extracellular signal\x{2013}regulated kinase 1/2 and protein kinase C (PKC) activation. In this study, we hypothesize that TLR4 and/or TLR2 may also play a role in the inflammatory mechanisms of DN. The aims of the current study were (1) to investigate TLR4 and TLR2 expression in human kidney biopsies with documented DN, (2) to determine the functional role of TLR4 in tubular inflammation using an established PTEC culture system in our laboratory,24 and (3) to study in vivo the role of TLR4 in diabetic TLR4-deficient mice.
RESULTS
Renal Cortical TLR4 but Not TLR2 Was Elevated and Correlated with Infiltrating CD68+ Monocytes/Macrophages in Human DN Biopsies
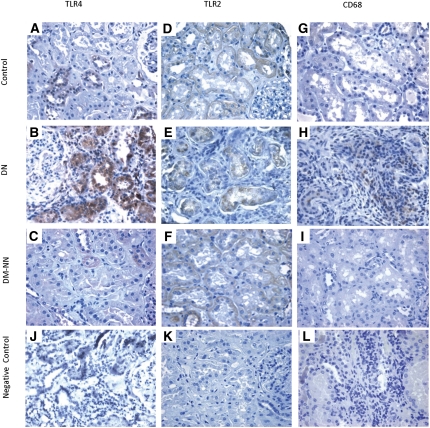
TLR expression was examined in paraffin-embedded sections of human diabetic kidney tissues by immunohistochemical staining with anti-TLR4 or anti-TLR2, and monocyte/macrophage infiltration was visualized with CD68 staining. Heavy granular staining for TLR4, predominantly in proximal tubules, distal tubules, and peritubular capillaries, was detected in tissues from DN subjects (Figure 1B), but little staining was observed in tissues from diabetes mellitus (DM) non-nephropathy subjects (Figure 1C) and nondiabetic control subjects (Figure 1A). In contrast, TLR2 was constitutively expressed in peritubular capillaries and arterioles, glomeruli, and tubules in normal kidney (Figure 1D). Tubular expression of TLR2 was not increased in patients with DN (Figure 1E) or DM non-nephropathy (Figure 1F) compared with that in control subjects.
Figure 1.
Renal cortical expression of TLR4, TLR2, and macrophage infiltration in human kidney biopsies. Representative photomicrographs of TLR4 staining in human renal cortical tissue from normal subjects (A), DN patients (B), and DM-NN patients (C); TLR2 staining in normal subjects (D), DN patients (E), and DM-NN patients (F); and CD68 staining, which denotes infiltrating CD68+ macrophages, in normal subjects (G), DN patients (H), and DM-NN patients (I). Negative control by omission of the corresponding primary antibodies demonstrated no nonspecific staining (J–L). Hematoxylin stain; original magnification, ×400.
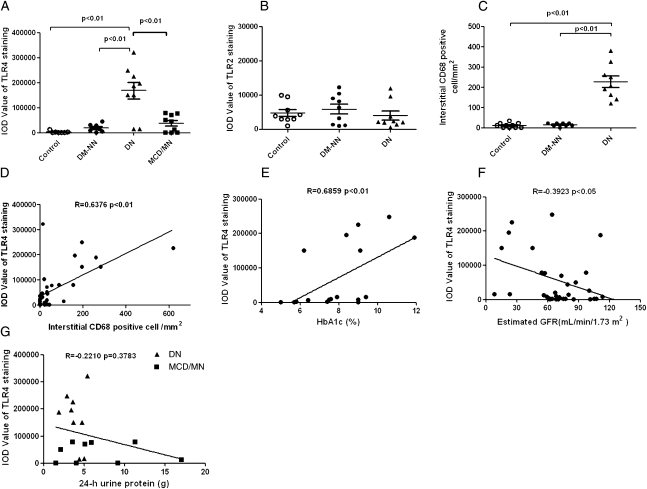
There was heavy staining of interstitial CD68+ monocytes/macrophages in tissues from DN subjects (Figures 1H and 2C and Table 1) but not in tissues from DM non-nephropathy (Figure 1I) and nondiabetic control subjects (Figure 1G). The integrated optical density (IOD) for tubular TLR4 staining was significantly higher in DN than that in DM non-nephropathy and normal tissues (P<0.01; Figure 2A) and was strongly correlated with the number of interstitial CD68+ monocytes/macrophages (Spearman r = 0.6376, P<0.01; Figure 2D). In addition, the immunostaining for TLR4 was significantly correlated with HbA1c level in the 18 diabetic patients (Spearman r = 0.6859, P<0.01; Figure 2E) and was negatively correlated with estimated GFR in all subjects (Spearman r = −0.3923, P<0.05; Figure 2F).
Figure 2.
Quantitative analysis of expression of TLR4 and TLR2 and correlation with CD68+ cell infiltrates in human kidney biopsies. The average IOD of each group was performed by computer-assisted quantitation. (A) TLR4 staining was significantly higher in DN patients (▲; n=9; P<0.01) compared with that in normal controls (○; n=9), DM-NN patients (●; n=9), and MCD/MN patients (▪, n=9). (B) TLR2 staining was similar among DN patients, DM-NN patients, and control subjects (P>0.05). (C) The number of infiltrating CD68+ monocytes/macrophages in the tubulointerstitial area was significantly higher in patients with DN (P<0.01) than in DM-NN patients and normal subjects. (D) Positive correlation between the number of interstitial CD68+ monocytes/macrophages and the intensity of TLR4 staining. (E) Correlation between TLR4 staining and HbA1c in diabetic patients. (F) Negative correlation between TLR4 staining and estimated GFR in all subjects. (G) No correlation between TLR4 staining and 24-hour urine protein excretion among DN and MCD/MN patients.
Table 1.
Clinical data and TLR4, TLR2, and CD68 immunohistochemistry in diabetic subjects with and without DN, nondiabetic normal subjects, and nondiabetic nephrotic subjects
| Patient | Age at Biopsy (yr)/Sex | SCr (μmol/L) | Serum Urea (mmol/L) | UPE/24 h (g) | Duration of Diagnosed DM (yr) | eGFR (ml/min per 1.73 m2)a | CRP (mg/dl) | HbA1c (%) | Comorbidities | TISS (0–5) | CD68+ (n)/HPF (mean [SD]) | ||||
|---|---|---|---|---|---|---|---|---|---|---|---|---|---|---|---|
| Microvascular Disease | Macrovascular Disease | Renal Disease Other than DN | AD | TLR4 | TLR2 | ||||||||||
| DN group (n=9)b | |||||||||||||||
| 1 | 42/F | 85 | 3.5 | 2.92 | 0.1 | 64 | 3.27 | 10.6 | DR | IHD | N | N | 5 | 3 | 35 (7) |
| 2 | 60/M | 64 | 4.9 | 1.89 | 0.1 | 111 | 1.36 | 11.9 | DR, DPN | N | N | N | 4 | 2 | 20 (6) |
| 3 | 65/F | 198 | 20.7 | 3.45 | 15 | 22 | 0.46 | 8.4 | N | N | N | N | 4 | 3 | 14 (4) |
| 4 | 59/M | 141 | 10.3 | 3.70 | 2 | 45 | 2.98 | 9.1 | N | IHD | N | N | 3 | 2 | 15 (3) |
| 5 | 64/F | 284 | 12.8 | 4.74 | 7 | 15 | 6.00 | 6.2 | N | N | N | N | 3 | 4 | 57 (10) |
| 6 | 45/M | 254 | 10.6 | 3.64 | 0.1 | 25 | <0.35 | 9 | DR | N | N | N | 5 | 1 | 18 (3) |
| 7 | 47/M | 672 | 28.4 | 5.00 | 5 | 8 | 2.03 | NA | N | PVD | N | N | 3 | 3 | 26 (9) |
| 8 | 55/M | 170 | 10.1 | 5.40 | 2 | 36 | NA | 9.4 | N | N | N | N | 5 | 2 | 24 (5) |
| 9 | 54/F | 205 | 18.6 | 4.40 | >20 | 23 | 0.26 | 7.9 | N | CVA | N | N | 4 | 3 | 18 (7) |
| mean ± SD | 54.6±8.3 F:M=4:5 | 230.3±180.5 | 13.3±7.9 | 3.9±1.1 | 5.7±7.2 | 38.8±31.9 | 2.1±2.0 | 9.1±1.7 | 4.0±0.9 | 2.6±0.9 | 25.2±13.6 | ||||
| DM-NN group (n=9)c | |||||||||||||||
| 1 | 65/F | 51 | 2.9 | <0.15 | 0.1 | 105 | NA | 7.4 | N | N | N | N | 3 | 2 | 3 (1) |
| 2 | 54/M | 64 | 5.4 | <0.15 | 6 | 113 | NA | 7.5 | N | N | N | N | 3 | 3 | 2 (2) |
| 3 | 46/M | 84 | 5.0 | <0.15 | 0.1 | 85 | NA | 5 | N | N | N | N | 1 | 1 | 1 (1) |
| 4 | 59/M | 106 | 5.7 | <0.15 | 2 | 62 | NA | 5.7 | N | N | N | N | 2 | 1 | 1 (1) |
| 5 | 77/M | 106 | 5.6 | <0.15 | >10 | 59 | NA | 9 | DR | N | N | N | 2 | 3 | 0 |
| 6 | 70/F | 71 | 3.7 | <0.15 | 0.1 | 71 | NA | 6.4 | N | CVA | N | N | 1 | 3 | 1 (1) |
| 7 | 67/M | 96 | 5.0 | <0.15 | 4 | 68 | NA | 9 | N | CVA | N | N | 2 | 2 | 2 (1) |
| 8 | 53/F | 77 | 4.8 | <0.15 | 8 | 68 | NA | 7.6 | N | N | N | N | 2 | 1 | 0 |
| 9 | 49/F | 72 | 2.8 | <0.15 | 1 | 91 | NA | 5.8 | N | N | N | N | 2 | 3 | 2 (1) |
| mean ± SD | 60.0±10.4 F:M=4:5 | 80.8±18.9 | 4.5±1.1 | 3.5±3.7 | 80.2±19.3 | 7.0±1.4 | 2.0±0.7 | 2.1±0.9 | 1.3±1.0 | ||||||
| Normal controls (n=9)c | |||||||||||||||
| 1 | 49/M | 103 | 6.1 | <0.15 | NA | 67 | NA | NA | N | N | N | N | 3 | 2 | 1 (1) |
| 2 | 44/M | 91 | 4.3 | <0.15 | NA | 79 | NA | NA | N | N | N | N | 2 | 2 | 0 |
| 3 | 45/M | 122 | 6.8 | <0.15 | NA | 56 | NA | NA | N | N | N | N | 2 | 4 | 0 |
| 4 | 53/F | 55 | 7.3 | <0.15 | NA | 100 | NA | NA | N | N | N | N | 2 | 2 | 2 (1) |
| 5 | 49/F | 70 | 4.1 | 0.30 | NA | 77 | NA | NA | N | N | N | N | 2 | 3 | 0 |
| 6 | 47/M | 69 | 3.5 | <0.15 | NA | 107 | NA | NA | N | N | N | N | 1 | 2 | 0 |
| 7 | 60/F | 79 | 4.8 | <0.15 | NA | 64 | NA | NA | N | N | N | N | 1 | 2 | 2 (1) |
| 8 | 61/M | 107 | 7.4 | <0.15 | NA | 61 | NA | NA | N | N | N | N | 2 | 3 | 1 (1) |
| 9 | 80/F | 76 | 5.8 | <0.15 | NA | 64 | NA | NA | N | N | N | N | 1 | 1 | 1 (1) |
| mean ± SD | 54.2±11.4 F:M=4:5 | 85.8±21.5 | 5.6±1.5 | 75.0±17.8 | 1.8±0.7 | 2.3±0.9 | 0.8±0.9 | ||||||||
| Nondiabetic nephropathy (n=9) | |||||||||||||||
| MCD (n=5) | |||||||||||||||
| 1 | M/32 | 106 | 6.2 | 9.2 | NA | 70 | NA | NA | NA | N | N | N | 1 | 2 | 2 (2) |
| 2 | M/79 | 80 | 7.2 | 17.0 | NA | 80 | NA | NA | NA | N | N | N | 3 | 4 | 10 (5) |
| 3 | F/77 | 85 | 4.1 | 5.9 | NA | 57 | NA | NA | NA | N | N | N | 3 | 2 | 5 (3) |
| 4 | F/32 | 69 | 6.4 | 4.0 | NA | 101 | NA | NA | NA | N | N | N | 1 | 2 | 4 (2) |
| 5 | F/84 | 67 | 4.0 | 5.1 | NA | 73 | NA | NA | NA | N | N | N | 3 | 4 | 3 (1) |
| MN (n=4) | |||||||||||||||
| 6 | F/41 | 98 | 4.7 | 11.3 | NA | 54 | NA | NA | NA | N | N | N | 3 | 4 | 14 (4) |
| 7 | M/59 | 84 | 6.2 | 2.1 | NA | 87 | NA | NA | NA | N | N | N | 2 | 1 | 3 (1) |
| 8 | M/50 | 48 | 4.2 | 1.5 | NA | 160 | NA | NA | NA | N | N | N | 3 | 1 | 3 (2) |
| 9 | M/14 | 64 | 3.8 | 3.6 | NA | 97d | NA | NA | NA | N | N | N | 3 | 4 | 8 (3) |
| mean ± SD | 52±24.5 F:M=4:5 | 77.9±17.9 | 5.2±1.3 | 6.6±5.0 | 86.6±31.9 | 2.4±0.9 | 2.7±1.3 | 5.8±4.1 | |||||||
SCr, serum creatinine; UPE, urinary protein excretion; eGFR, estimated GFR; CRP, C-reactive protein; HbA1c, hemoglobin A1c; AD, autoimmune disease; TISS, tubular immunohistochemical staining score; HPF, high power field; F, female; M, male; DR, diabetic retinopathy; IHD, ischemic heart disease; N, not present; DPN, diabetic peripheral neuropathy; PVD, peripheral vascular disease; CVA, cerebrovascular accident; NA, not applicable/not available.
Derived from the abbreviated 4-variable Modification of Diet in Renal Disease study equation.62
All patients had a histologic diagnosis of DN and no other renal pathologies.
All patients had tumor nephrectomy for solitary renal cell carcinoma, and sections were obtained from the cortex of the normal pole opposite the tumorous pole.
Derived from the Schwartz equation.63
To confirm that TLR4 overexpression is specific to DN but not secondary to proteinuria per se, we studied sections from an additional group of nondiabetic nephrotic subjects; namely, those with minimal change disease (MCD) and idiopathic membranous nephropathy (MN). The IOD of TLR4 staining was significantly lower in MCD/MN than in DN tissue, although it was slightly above that of normal control (Figure 2A). No correlation was found between proteinuria and TLR4 staining in all subjects with proteinuria (Spearman r = −0.2210, P>0.05; Figure 2G).
Endogenous TLR4 Ligand High-Mobility Group Box 1 but Not Heat Shock Protein 70 Was Induced in DN
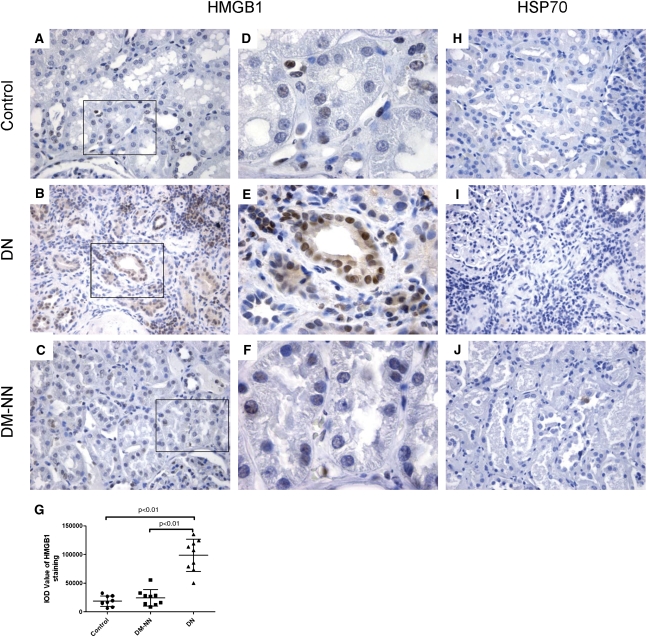
Because the DN subjects included in this study did not show any clinical or laboratory evidence of infection, pathogen-associated motifs are unlikely to have activated tubular TLR4 in their biopsies. We next identified the relevant endogenous ligands for TLR4 during DN. Strong nuclear and cytoplasmic high-mobility group box 1 (HMGB1) staining was detected in proximal and distal tubules of DN biopsies (Figure 3, B and E). Conversely, tissue from DM non-nephropathy subjects (Figure 3, C and F) and nondiabetic control subjects (Figure 3, A and D) showed little HMGB1 nuclear staining. In normal control tissue, heat shock protein 70 (HSP70) staining localized predominantly in the tubules of outer medulla. No increase of HSP70 staining was found in the renal cortex of DN (Figure 3I) compared with that in renal cortex of DM non-nephropathy (Figure 3J) and normal control (Figure 3H).
Figure 3.
Renal cortical expression of HMGB1 and HSP70 in human biopsies. Representative photomicrographs of HMGB1 staining in human renal cortical tissue from normal subjects (A and D), DN patients (B and E), and DM-NN patients (C and F); HSP70 staining in cortical tissue of normal subjects (H), DN patients (I), and DM-NN patients (J). The average IODs of HMGB1 staining were significantly higher in DN patients than those in normal subjects (P<0.01) and DM-NN patients (P<0.01) (G). Hematoxylin stain; original magnification: ×400 (A–C and H–J); ×1000 (D–F).
High Ambient Glucose Induced TLR4 Expression in Human PTECs
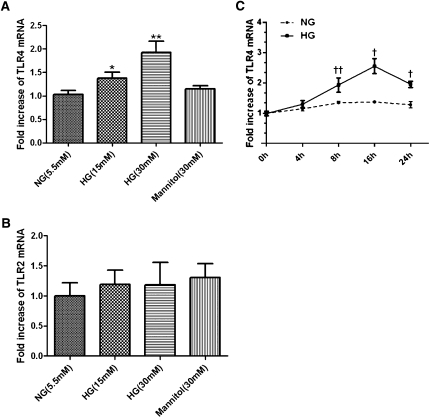
To dissect the effect of HG on tubular TLR4 expression in vitro, we exposed cultured PTECs to d-glucose (15–30 mM) for 8 hours and showed an upregulation of TLR4 mRNA expression in a dose-dependent manner, whereas exposure to an equivalent dose of mannitol (30 mM) had no effect on TLR4 expression (Figure 4A). In addition, HG (30 mM) induced TLR4 expression in a time-dependent manner, with peak stimulation of 2.6-fold after 16 hours of exposure (Figure 4C; P<0.05). In contrast, TLR2 mRNA expression was not upregulated by HG (Figure 4B) under the same conditions. Moreover, incubation of PTECs with HG for 6 and 24 hours significantly induced HMGB1 secretion into culture supernatants (data not shown).
Figure 4.
Effect of high ambient glucose on TLR4 and TLR2 mRNA expression in PTECs. Dose effect of HG on mRNA expression of TLR4 (A) and TLR2 (B). PTECs were incubated with increasing doses of ambient glucose (from 5.5 to 30 mM) for 8 hours. mRNA expression was determined by real-time PCR. *P<0.05, **P<0.01 versus PTECs cultured with normal glucose media. (C) Time effect of HG on mRNA expression of TLR4. PTECs were incubated with high ambient glucose (30 mM) for 0–24 hours. †P<0.05, ††P<0.01 versus time zero control. All results represent means ± SD obtained from five independent experiments. NG, normal glucose.
PKC Was Involved in HG-Induced TLR4 Expression
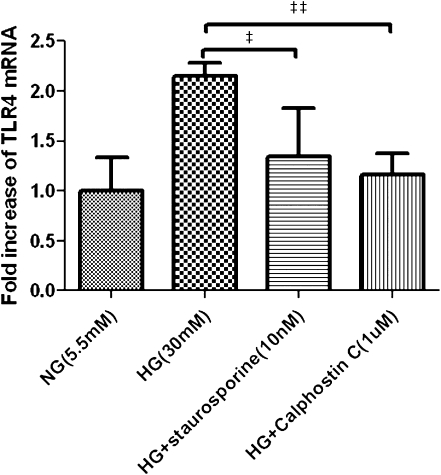
To investigate the mechanism of HG-induced TLR4 expression, we next examined the role of PKC in TLR4 expression stimulated by HG. Pretreatment of PTECs with the PKC inhibitors staurosporine (10 nM) and calphostin C (1 μM) 1 hour before HG exposure resulted in 36% and 43% decrease in the subsequent TLR4 mRNA overexpression, respectively (Figure 5).
Figure 5.
Effect of PKC inhibitors on HG-induced TLR4 expression. PTECs were treated for 16 hours with normal glucose (5.5 mM), HG (30 mM), or PKC inhibitors staurosporine (10 nM, added 1 hour before the addition of HG) or calphostin C (1 µM, added 1 hour before addition of HG). Results are means ± SD of three independent experiments. ‡P<0.05, ‡‡P<0.01 versus cells treated with HG alone. NG, normal glucose.
TLR4 Mediated the Proinflammatory Effect Induced by HG in PTECs
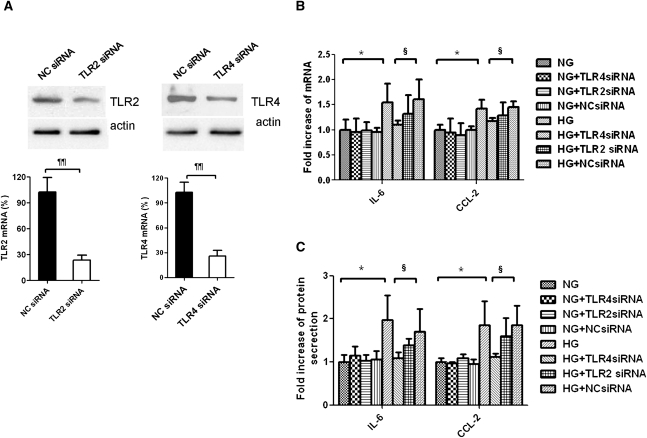
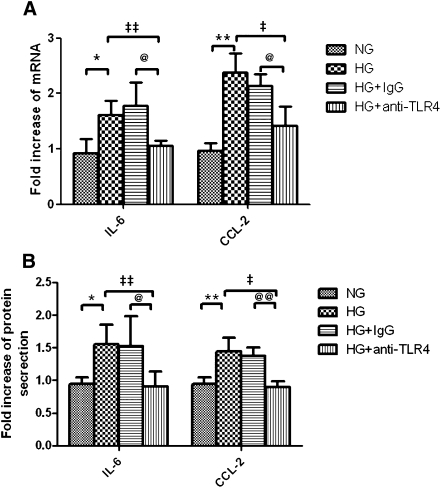
Our previous study showed that HG-induced IL-6 and CCL-2 production in PTECs and inhibition of PKC partially reduced the overexpression of these cytokines. We next explored whether TLR4 mediated such proinflammatory effect using gene-specific small interfering RNA (siRNA). Transfection with TLR4-specific siRNA decreased endogenous expression of TLR4 transcript by 75% and protein by 60% in PTECs (Figure 6A). Reduction in TLR4 had no effect on endogenous expression of IL-6 and CCL-2 but significantly decreased HG-induced upregulation of IL-6 and CCL-2 gene expression (Figure 6B) and protein secretion (Figure 6C). In contrast, there was no difference in IL-6 and CCL-2 gene expression and protein secretion after knocking down TLR2 with specific siRNA. The role of TLR4 in HG-induced cytokine production was further confirmed by using a TLR4-neutralizing antibody. Preincubation of PTECs with anti-TLR4 antibody attenuated HG-induced IL-6 and CCL-2 mRNA expression and protein secretion (Figure 7).
Figure 6.
Effect of HG on IL-6 and CCL-2 expression in PTECs and the effect of TLR4 knockdown. (A) Efficacy of TLR2 and TLR4 knockdown. PTECs were transfected with 30 nM nonspecific negative control siRNA (NC siRNA), TLR2-specific siRNA, or TLR4-specific siRNA, and the respective mRNA and protein expressions were measured after 24 hours. PTECs with no knockdown, transfected with TLR4 siRNA, TLR2 siRNA, or NC siRNA, were incubated with normal glucose (5.5 mM) or HG (30 mM) for 24 hours. (B) Gene expression of IL-6 and CCL-2 was determined by real-time PCR. (C) Protein synthesis of IL-6 and CCL-2 in culture supernatants was determined by ELISA. All results represent means ± SD obtained from five independent experiments. ¶¶P<0.01 versus PTECs transfected with NC siRNA; *P<0.05 versus PTECs cultured with NG media; §P<0.05 versus PTECs transfected with NC siRNA and cultured with HG medium. NG, normal glucose.
Figure 7.
Effect of TLR4-neutralizing antibody on HG-induced IL-6 and CCL-2 expression. PTECs were pretreated with TLR4-neutralizing antibody (20 μg/ml) or equivalent dose of IgG control before addition of HG for 24 hours. At the end of incubation, IL-6 and CCL-2 mRNA expression was determined by real-time PCR (A), and their protein levels in culture supernatants were determined by ELISA (B). Results represent means ± SD of three independent experiments. *P < 0.05, **P < 0.01 versus PTECs cultured with NG media; ‡P<0.05, ‡‡P<0.01 versus PTECs cultured with HG media; @P<0.05, @@P<0.01 versus PTECs pretreated with IgG control and cultured with HG media. NG, normal glucose.
HG Activated IκB/NF-κB Signaling through TLR4 in PTECs
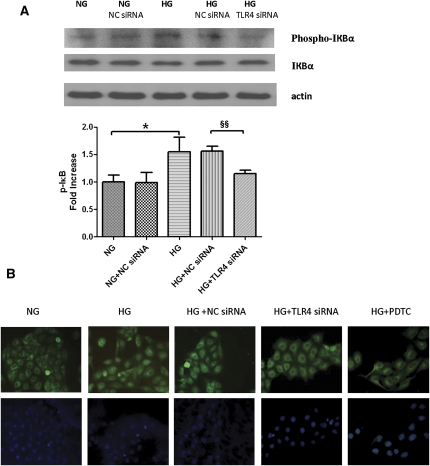
We then investigated HG-induced inflammatory signaling. HG activated IκB phosphorylation by 1.5-fold (Figure 8A; P<0.05) and stimulated NF-κB p65 nuclear translocation (Figure 8B). Knocking down TLR4 with specific siRNA but not scrambled siRNA prevented IκB phosphorylation and NF-κB p65 nuclear translocation. Pretreatment of PTECs with 25 μM pyrrolidine dithiocarbamate, an NF-κB inhibitor, also decreased NF-κB p65 nuclear translocation induced by HG.
Figure 8.
Effect of TLR4 knockdown on HG-mediated IκB/NF-κB signaling in PTECs. (A) Western blot analysis of IκB phosphorylation. PTECs pretransfected with either TLR4 siRNA or negative control siRNA were treated with HG (30 mM) for 6 hours. The phosphorylation state of IκB was detected by immunoblotting against anti–phospho-IκB antibody. Levels of phosphorylation were normalized to actin. Results are means ± SD obtained from three independent experiments. *P < 0.05, versus PTECs cultured with NG media §§P<0.01 versus PTECs transfected with NC siRNA and cultured with HG media. A representative blot is shown at the top. (B) Study of subcellular translocation of NF-κB by immunofluorescence staining. PTECs with no knockdown, transfected with negative control siRNA or TLR4 siRNA, were incubated with HG (30 mM) for 8 hours and were stained by immunofluorescence for the p65 subunit of NF-κB (green, top panel) and for cell nuclei with 4′,6-diamidino-2-phenylindole (blue, bottom panel). PTECs treated with normal glucose (5.5 mM) and HG plus pyrrolidine dithiocarbamate (PDTC; an NF-κB translocation inhibitor) served as baseline and positive controls, respectively. NC siRNA, negative control siRNA; NG, normal glucose. Original magnification, ×400.
Tubular TLR4 Mediated Monocyte Chemotaxis Induced by HG
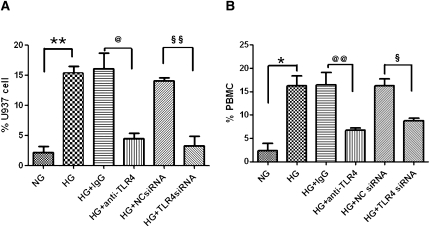
To investigate the chemotactic potency of mediators released by PTECs cultured in HG, a monocyte chemotaxis assay was performed using a Transwell setup. Conditioned media from HG-activated PTECs significantly induced migration of monocytic U937 cells (Figure 9A), as well as freshly isolated human PBMCs (Figure 9B) to the lower chamber. Transfection of PTECs with TLR4-specific siRNA significantly abolished the migration of U937 cells (P<0.01) and PBMCs (P<0.05), suggesting an essential role of tubular TLR4 in mediating HG-induced chemotaxis. Pretreatment of PTECs with a TLR4-neutralizing antibody (10 μg/ml) for 30 minutes also significantly attenuated the migratory effect of U937 cells (P<0.05) and PBMCs (P<0.01) induced by HG.
Figure 9.
Induction of monocyte chemotaxis by HG-activated PTECs and the effect of TLR4 inhibition. Unstimulated monocytic U937 cells (A) and PBMCs (B) were fluorescently labeled with Calcein-AM and seeded onto the upper chamber of a Transwell insert. Conditioned media obtained from PTECs with no knockdown, anti-IgG antibody treatment, TLR4-neutralizing antibody treatment, negative control siRNA transfection, or TLR4 siRNA transfection exposed to HG for 48 hours were added to the lower chamber of the Transwell culture system. After 3 hours, the number of cells that migrated to the lower chamber of the Transwell was determined by spectrofluorometry. Results are presented as a percentage of input cell number. *P < 0.05, **P < 0.01 versus PTECs cultured with NG media; @P<0.05, @@P<0.01 versus PTECs pretreated with IgG control and cultured with HG media; §P<0.05, §§P<0.01 versus PTECs transfected with NC siRNA and cultured with HG media. All results represent means ± SD obtained from three independent experiments. NC siRNA, negative control siRNA; NG, normal glucose.
Induction of DN in TLR4−/− and TLR4+/+ Mice
The role of TLR4 in the pathogenesis of DN was further explored in a TLR4−/− animal model. TLR4−/− and TLR4+/+ mice developed diabetes 2 weeks after streptozotocin (STZ) injection. Fasting glucose levels were similar in all diabetic groups and were maintained throughout the experiment (Table 2). At 12 weeks, nondiabetic mice had gained more weight (27.7%) from baseline than diabetic mice (8.5%). However, there was no difference in body weight between TLR4−/− and TLR4+/+ mice in the diabetic or nondiabetic group. Uninephrectomy (Unx) had no influence on blood glucose in both genotypes of diabetic and nondiabetic animals. Among nondiabetic animals, Unx had no influence on serum creatinine or albuminuria. Among diabetic TLR4+/+ animals, there was no change in serum creatinine and a mild increase in albuminuria at 12 weeks versus baseline in the sham-operated group, but the addition of Unx caused a significantly more profound elevation in serum creatinine and albuminuria (Table 2).
Table 2.
Physical and biochemical parameters of experimental animals (n=8 per group)
| Parameter | TLR4+/+ | TLR4−/− | ||||||
|---|---|---|---|---|---|---|---|---|
| Sham | Unx | Sham | Unx | |||||
| Nondiabetic | Diabetic | Nondiabetic | Diabetic | Nondiabetic | Diabetic | Nondiabetic | Diabetic | |
| Body weight (g) | ||||||||
| baseline | 22.0±0.8 | 23.7±1.2 | 23.2±0.8 | 23.6±1.8 | 23.9±2.2 | 23.8±1.3 | 23.6±2.5 | 22.4±0.9 |
| 12 weeks | 30.9±2.4 | 25.5±1.5 | 29.7±1.7 | 24.9±1.9 | 29.2±2.1 | 25.9±1.5 | 28.1±1.9 | 24.8±2.8 |
| Blood glucose (mM) | ||||||||
| baseline | 6.9±1.3 | 6.1±0.8 | 7.2±1.4 | 6.6±0.8 | 7.0±1.2 | 6.4±1.5 | 6.9±1.5 | 7.4±1.3 |
| 12 weeks | 6.8±1.2 | 22.7±4.8a | 6.6±1.3 | 23.1±3.5a | 7.2±1.0 | 22.1±3.4a | 6.8±0.8 | 22.4±6.6a |
| UACR (μg/mg) | ||||||||
| baseline | 40.5±5.7 | 35.6±16.5 | 27.1±9.1 | 33.7±29.4 | 34.5±11.2 | 34.1±10.9 | 26.6±9.2 | 43.2±11.3 |
| 12 weeks | 38.8±12.6 | 122.8±40.7a | 34.0±5.2 | 389.3±152.4a,b | 41.7±8.6 | 66.2±19.6 | 35.8±9.3 | 86.0±29.4a,c |
| Scr (mg/dl) | ||||||||
| baseline | 0.14±0.05 | 0.16±0.05 | 0.17±0.05 | 0.13±0.03 | 0.15±0.06 | 0.16±0.08 | 0.17±0.09 | 0.16±0.09 |
| 12 weeks | 0.17±0.03 | 0.15±0.07 | 0.17±0.09 | 0.32±0.11a,b | 0.14±0.03 | 0.16±0.07 | 0.16±0.03 | 0.19±0.09c |
Sham, sham operation; Scr, serum creatinine.
P<0.05 versus the corresponding nondiabetic group.
P<0.05 versus the corresponding sham-operated group.
P<0.05 versus the corresponding TLR4+/+ group.
Deletion of TLR4 Conferred Renoprotection in DN
At 12 weeks, Unx-TLR4+/+ diabetic mice displayed an 11-fold increase in urine albumin-to-creatinine ratio (UACR) and a 1.9-fold increase in serum creatinine level compared with those of the corresponding nondiabetic control. By contrast, only a 2.4-fold increase in UACR and an insignificant increase in serum creatinine were recorded in Unx-TLR4−/− diabetic mice, and the levels of both parameters were significantly lower than in the corresponding Unx-TLR4+/+ diabetic mice (Table 2).
TLR4 Was Also Upregulated in STZ-Induced Diabetic Mice
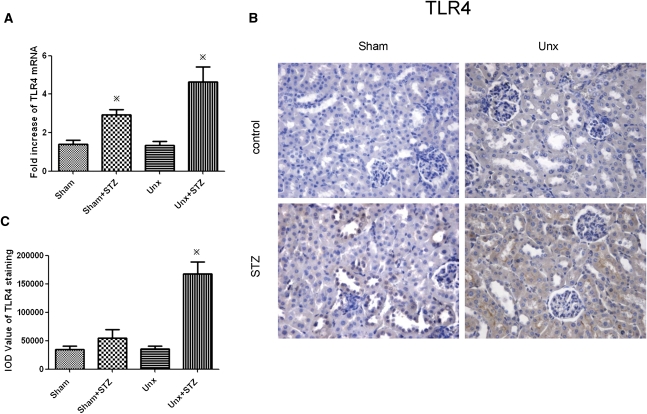
To investigate whether intrarenal TLR4 expression in mice mirrored that in humans, we performed real-time PCR and immunohistochemistry in TLR4+/+ animals rendered diabetic with STZ for 12 weeks with or without concomitant Unx. As shown in Figure 10, tubular TLR4 expression was induced in sham-operated TLR4+/+ diabetic mice versus nondiabetic control, and this upregulation was further enhanced by Unx.
Figure 10.
Renal cortical expression of TLR4 in diabetic and nondiabetic TLR4+/+ mice. (A) TLR4 mRNA expression, determined by real-time PCR, in renal cortex 12 weeks after STZ induction. (B) Representative photomicrograph of renal cortical immunostaining for TLR4. Hematoxylin stain; original magnification, ×400. (C) Quantitative analysis of tubular TLR4 staining. Data represent means ± SD for groups of eight animals. *P<0.05 versus the corresponding nondiabetic animals.
Tubulointerstitial Inflammation Was Attenuated in TLR4−/− Diabetic Mice
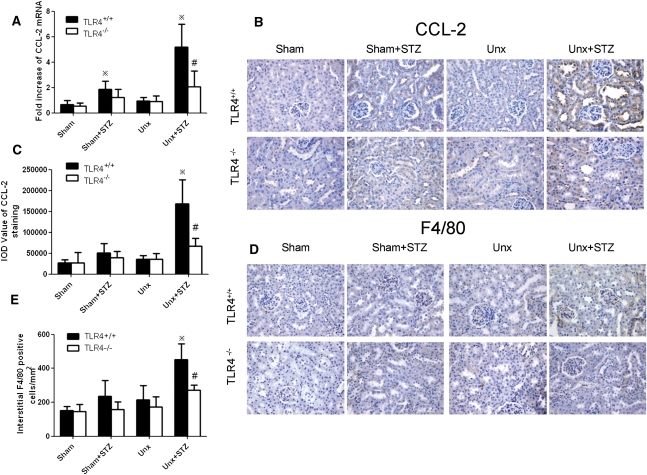
To explore whether in vivo deletion of the TLR4 gene influences tubular inflammation under diabetic conditions, we examined cortical CCL-2 expression by real-time PCR and immunohistochemical staining. As shown in Figure 11, STZ induction caused a 2-fold increase in CCL-2 mRNA expression, which was markedly enhanced by Unx. This was associated with heavy tubular staining for CCL-2 compared with the Unx-TLR4+/+ nondiabetic control. Unx per se had no effect in cortical CCL-2 mRNA expression or immunostaining in nondiabetic animals. Furthermore, the enhanced tubular CCL-2 expression in Unx-TLR4+/+ diabetic mice was associated with a significant increase in tubulointerstitial macrophage infiltration. However, the upregulation of renal cortical CCL-2 mRNA expression and increase in tubular CCL-2 immunostaining and tubulointerstitial macrophage infiltration were all significantly attenuated in Unx-TLR4−/− diabetic mice versus wild-type animals.
Figure 11.
Renal cortical CCL-2 expression and macrophage infiltration in diabetic and nondiabetic TLR4−/− and wild-type mice with or without Unx. (A) Renal cortical CCL-2 mRNA expression determined by real-time PCR. (B) Representative photomicrograph of immunohistochemical staining for CCL-2. Hematoxylin stain; original magnification, ×400. (C) Quantitative analysis of tubular CCL-2 staining. (D) Representative renal cortical sections of F4/80 immunostaining. Hematoxylin stain; original magnification, ×400. (E) Number of interstitial F4/80+ cells. *P<0.05 versus the corresponding nondiabetic animals; #P<0.05 for comparison between diabetic Unx-TLR4+/+ and Unx-TLR4−/− mice.
Tubulointerstitial NF-κB Activation Was Reduced in TLR4−/− Diabetic Mice
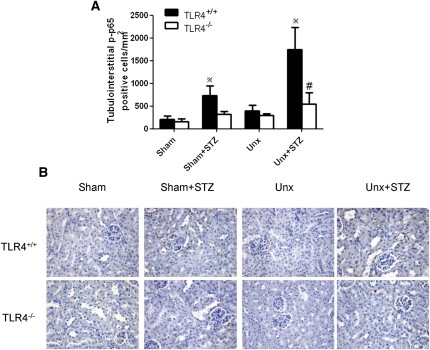
As shown in Figure 12, NF-κB activation was induced in Unx-TLR4+/+ diabetic mice in which there was significant increase in tubular phosphorylated NF-κB/p65 staining in the tubulointerstitium compared with that in nondiabetic controls. However, this tubulointerstitial NF-κB activation was substantially reduced in Unx-TLR4−/− diabetic mice versus wild-type animals.
Figure 12.
Renal cortical phosphorylated NF-κB/p65 nuclear staining in diabetic and nondiabetic TLR4−/− and wild-type mice with or without Unx. (A) Quantitative analysis of phosphorylated NF-κB/p65 nuclear staining in tubulointerstitium. *P<0.05 versus the corresponding nondiabetic animals; #P<0.05 for comparison between diabetic Unx-TLR4+/+ and Unx-TLR4−/− mice. (B) Representative renal cortical immunostaining for nuclear phosphorylated NF-κB/p65. Hematoxylin stain; original magnification, ×400. Data represent means ± SD for groups of eight animals.
DISCUSSION
Accumulating evidence indicates that immunologic and inflammatory elements play a significant role in initiating and extending tubular injury in DN,2,3,25,26 but the mechanisms are not fully understood. In this study, we identified for the first time overexpression of TLR4 in the human diabetic kidney, which was correlated with CD68+ cell infiltration, suggesting a possible role for TLR4 in mediating monocyte/macrophage recruitment and tubulointerstitial inflammation in DN. The absence of this phenomenon in renal tissues of similarly proteinuric but nondiabetic subjects confirmed the observed TLR4 activation was not merely a nonspecific consequence of heavy proteinuria.
TLR4 is required for adaptive immune responses,27 and activation of TLR4 mediates signaling pathways, leading to transcriptional expression of proinflammatory cytokines and chemokines, which might aggravate renal dysfunction in acute and chronic kidney diseases.7,9,11,15,28,29 In addition, the proinflammatory role of TLR4 has been implicated in diabetes and diabetic complications.18 Dasu et al.21 observed an upregulation and activation of TLR4 and its ligands in circulating monocytes of recently diagnosed type 2 diabetic subjects. Our observation of TLR4 overexpression in association with monocyte/macrophage infiltration in the diabetic kidney is entirely consistent with these notions. In addition, we found a significant negative correlation between TLR4 expression and glycemic control, as well as renal function, which may implicate the contribution of HG and/or advanced glycation end products to the increased TLR4 expression. This finding is at least in agreement with the correlation between the expression of TLR ligands and HbA1c observed in type 1 diabetic patients.20
However, the absence of detectable renal TLR2 overexpression in DN biopsy is somewhat unexpected, as TLR2 has been implicated in TLR2 mutant mouse models of ischemic29 and nephritic28 renal injuries and, more recently, in STZ-induced diabetic rat kidneys.30 TLR2 has been documented to be highly expressed in several cell types within the kidney, including glomerular endothelial cells, peritubular capillaries, and tubular cells.31 The biopsies in this study were from patients with chronic and advanced DN (mean duration of 5.7 years) with nodular or diffuse glomerulosclerosis, capillary rarefaction, and tubular atrophy, which may explain the lack of increase in overall TLR2 expression. Furthermore, we found an increased number of TLR2-positive cells infiltrating into the tubulointerstitial area (data not shown), which is consistent with the previous report of TLR2 activation in circulating monocytes in type 2 diabetic patients.21 Further studies are required to pinpoint the precise role of TLR2 in the pathogenesis of DN.
In noninfectious inflammatory conditions such as immune disease, ischemia-reperfusion injury, and diabetes, TLR4 was reported to be activated by interacting with endogenous ligands including HMGB1 and heat shock protein. HMGB1 was originally identified as a DNA-binding protein that regulates transcription.32 Recently, it has been identified as a TLR4 endogenous ligand activated by the diabetic state21 and also shown to mediate tubular inflammatory response through TLR4 in kidney ischemia-reperfusion injury.11,33 In the current study, we detected an increased tubular expression of HMGB1 in DN biopsies, which supports its role in TLR4 activation in DN. However, in addition to HMGB1, a growing list of TLR4 endogenous ligands might also play a role in TLR4 activation in DN.34
To substantiate a direct tubular contribution to TLR4 overexpression during diabetes, we used a clean human PTEC primary culture system and showed that the HG milieu indeed superinduced TLR4 in tubular cells. Previously, we showed that HG induced CCL-2 and IL-6 via PKC activation,35 and PKC has been reported to mediate TLR4 induction.36,37 In the current study, we demonstrated that PKC activation was required in HG-induced TLR4 overexpression in PTECs, which lends further support to the notion that TLR4 is essential for the downstream proinflammatory events that we recently observed in PTECs exposed to diabetic substrates.22,35 We also showed that HG induced HMGB1 release by PTECs, which was consistent with our finding in renal biopsies and implicated HMGB1 to be an endogenous ligand for HG-induced TLR4 signaling. In addition, recent studies have shown that angiotensin II also induced TLR4 expression in mouse mesangial cells and podocytes38,39 and that blockade of the renin–angiotensin system by candesartan or spironolactone could attenuate TLR4 expression and the associated downstream proinflammatory and apoptotic events,40,41 suggesting that intrarenal renin–angiotensin system activation might be another mechanism of tubular TLR4 activation in DN. Furthermore, various endogenous ligands for TLR4 may act synergistically with HG to promote proinflammatory response through TLR4 activation.21,42
Molecular silencing of TLR4 but not TLR2 significantly attenuated HG-induced CCL-2 and IL-6 upregulation in PTECs and blunted the chemotactic potential of HG-treated PTECs. This adds further evidence to support the essential role of TLR4 in mediating HG-induced tubular inflammation. The important NF-κB–dependent chemokine and cytokine CCL-2 and IL-6, respectively, have been implicated in the progression of DN as demonstrated by our group and others.35,43,44 In vitro and in vivo studies have shown that locally produced CCL-2 not only plays a major role in interstitial recruitment of leukocytes45–47 but also induces inflammation of PTECs by activating the secretion of IL-6, which promotes and sustains inflammation by activating monocytes/macrophages and expression of intercellular adhesion molecule-1.48 Furthermore, we demonstrated that HG-activated PTECs provided a strong chemotactic signal for PBMC and U937 monocyte transmigration across a culture insert and that TLR4 inhibition by either gene knockdown or a neutralizing antibody largely abrogated such phenomenon. Therefore, blockade of TLR4 may potentially interrupt this autocrine/paracrine loop of CCL-2, IL-6 activation and the subsequent interaction between tubular cells and infiltrating monocytes/macrophages. Indeed, preincubation with anti-CCL-2 partially attenuated transmigration of U937 cells (data not shown). In addition to CCL-2, other chemokines and adhesion molecules induced by HG-activated PTECs could also play a role in macrophages chemotaxis.49,50 The precise molecular mechanism through which TLR4 mediates the interaction between PTECs and macrophage chemotaxis warrants further investigation.
It is believed that a complex array of intertwining events including renal parenchymal cell–cell, parenchymal cell–immune cell, and cell–matrix interactions orchestrate the process of tubulointerstitial inflammation, tubular injury, and the ensuing fibrogenic processes in DN. Previous studies showed that endothelial TLR4 contributes to vascular inflammation and endothelial dysfunction in diabetic cardiovascular complication51 and insulin resistance52 and to early acute kidney injury,8 whereas TLR4 in intrarenal myeloid cells and myofibroblasts was not involved in renal postischemic injury7 and fibrogenesis.12 Therefore, in addition to tubular epithelial cell inflammation and infiltrating macrophages, it would be interesting to study whether TLR4 also interacts with other intrinsic renal cells in the progression of DN.
Finally, we explored the role of TLR4 in STZ-induced diabetic mice. Because of the lack of a cell type–specific TLR4 knockout mouse, which would be an ideal model to investigate tubular TLR4 function in vivo, we resorted to studying mice with systemic TLR4 deletion. Because these animals with a C57BL/6 background do not develop lesions of DN readily after the induction of diabetes,53 Unx was performed to hasten the development of DN as shown by our group54,55 and others.56,57 Wild-type animals with DN had increased tubular TLR4 expression, which was in agreement with our findings in human kidney tissues with DN. Mice deficient in the TLR4 gene demonstrated significantly ameliorated albuminuria and renal dysfunction independent of blood glucose levels. Furthermore, this functional improvement was accompanied by substantially decreased tubular CCL-2 expression and macrophage infiltration into the tubulointerstitium. Such renoprotective effects in TLR4−/− animals might be mediated via inhibition of NF-κB activation. Our in vivo results complement our in vitro and human biopsy data and suggest that TLR4 signaling plays a dominant role in mediating kidney injury during DN.
Taken together, our in vitro and in vivo data suggest a novel molecular link between TLR4 activation and diabetic kidney injury, and TLR4 may be a promising therapeutic target in diabetic tubulopathy. At present, several synthetic lipid A analogs have been developed as TLR4 antagonists, and their potential application in the treatment of severe sepsis is under vigorous preclinical and clinical trials.58–60 Whether these compounds also exert effective control over DN definitely deserves further studies in animal models of DN.
CONCISE METHODS
Human Renal Biopsies
Kidney biopsy tissues were obtained from nine subjects with type 2 diabetes and biopsy-proven DN, nine subjects with type 2 diabetes lacking nephropathy, nine normal control subjects, and nine subjects with nondiabetic nephrotic syndrome (MCD in five and MN in four). Their demographic and clinical data are shown in Table 1.
In the DN group, renal biopsy was performed to exclude the coexistence of other types of kidney disease because of the presence of atypical features, which included short duration between the diagnosis of diabetes and the onset of nephropathy (patients 1, 2, 4, 6, 8) or the absence of concomitant diabetic retinopathy (patients 3–5, 7–9) as shown in Table 1. All these nine patients had a final histologic diagnosis of DN with diffuse or nodular diabetic glomerulosclerosis and no other renal pathology.
Subjects with diabetic non-nephropathy (DM-NN) had a spot UACR <30 mg/g or negative dipstick for microalbumin and serum creatinine concentration <1.5 mg/dl in men or <1.3 mg/dl in women without histologic DN and other renal disease. These patients were made available through searching the tumor registry at our hospital for patients who underwent nephrectomy for solitary renal cell carcinoma and had a concomitant diagnosis of type 2 diabetes. Histologic examination of the nephrectomy specimens from these patients revealed no features of DN or other renal disease (except for the solitary renal cell carcinoma).
Nondiabetic normal control renal tissues were also made available through searching the tumor registry for patients without diabetes or renal disease.
Renal tissues from the DM-NN controls and nondiabetic normal controls were obtained from the intact normal pole of nephrectomy specimens of patients with circumscribed solitary renal tumor at the opposite pole who otherwise had no clinical or histologic renal disease. These investigations were conducted in accordance with the principles of the Declaration of Helsinki and were approved by the Research Ethics Committee of The University of Hong Kong after informed consent was obtained from the patients.
Cell Culture
Human PTECs were isolated according to methods that we previously described24 and grown in a 1:1 mixture of DMEM/F12 medium supplemented with 10% FCS, hydrocortisone (40 ng/ml), l-glutamine (2 mM), benzyl penicillin (100 IU/ml), and streptomycin (100 µg/ml) (Invitrogen, Carlsbad, CA). The cells were incubated at 37°C in 5% CO2 and 95% air. In all experiments, there was a “growth arrest” period of 24 hours in serum-free medium before stimulation with normal glucose or HG (15–30 mM). Cell supernatants, lysates, and RNA were collected for subsequent experiments.
PBMCs were isolated from whole blood of normal donors by centrifugation on a Ficoll-Hypaque (GE Healthcare, Little Chalfont, UK) gradient centrifuge. U937 monocytic cells (American Type Culture Collection, Rockville, MD) and PBMCs were cultured in RPMI 1640 medium (Invitrogen) supplemented with 10% FCS for use in subsequent monocyte chemotaxis assays.
Animal Model
This study was approved by the Committee on the Use of Live Animals in Teaching and Research of The University of Hong Kong and was performed in accordance with the National Institutes of Health Guide for the Care and Use of Laboratory Animals. Ten- to 12-week-old male B6.B10ScN-Tlr4lps-del/JthJ mice (TLR4−/−; The Jackson Laboratory, Bar Harbor, ME) and the age-matched littermate (TLR4+/+) on a C57BL/6 background underwent Unx or sham operation. Diabetes was induced by intraperitoneal injections of STZ (50 mg/kg body weight; Sigma, St. Louis, MO) for 5 consecutive days 1 week after Unx. The animals were divided into the following groups: (1) sham-operated TLR4+/+ mice, (2) STZ-induced sham-operated TLR4+/+ mice, (3) Unx-TLR4+/+ mice, (4) STZ-induced Unx-TLR4+/+ mice, (5) sham-operated TLR4−/− mice, (6) STZ-induced sham-operated TLR4−/− mice, (7) Unx-TLR4−/− mice, and (8) STZ-induced Unx-TLR4−/− mice. Diabetes was defined by fasting blood glucose >250 mg/dl 2 weeks after the first STZ injection. Blood glucose was monitored every 4 weeks by glucose meter (Accu-Check Sensor; Roche, Mannheim, Germany). Urinary albumin was measured by ELISA quantitation kit (Bethyl Laboratories, Montgomery, AL), and urine and serum creatinine were determined by enzymatic method (Stanbio Laboratory, Boerne, TX). Twelve weeks after STZ injection, all mice were killed, and the kidneys were obtained for further analyses.
RNA Interference and Blocking Antibody
PTECs were transfected with 30 nM TLR2-, TLR4-specific siRNA or negative control siRNA (Ambion, Austin, TX) using Lipofectamine 2000 (Invitrogen) according to the manufacturer's protocol. The efficacy of knockdown was determined by real-time PCR and Western blot. Ten micrograms per milliliter TLR4-neutralizing antibody and IgG isotype control (eBioscience, San Diego, CA) were added 30 minutes before exposure to HG.
Real-Time PCR
Total RNA was extracted using RNeasy Mini Kit (Qiagen, Valencia, CA), and was reverse transcribed to cDNA with M-MLV reverse transcription (Promega, Madison, WI). Gene expression was analyzed by real-time PCR in an ABI Prism 7500 sequence detection system (Applied Biosystems, Foster City, CA). The TaqMan probe set from Applied Biosystems (IL-6, Hs00985639_m1; CCL-2, Hs00234140_m1; TLR4, Hs00152939_m1; TLR2, Hs00152932_m1; β-actin, Hs03023943_g1) was used for in vitro experiment. The following primers were used for mouse renal cortex mRNA detection—CCL-2: forward 5′-CTC TTC CTC CAC CAC CAT-3′, reverse 5′-CTC TCC AGC CTA CTC ATT G-3′. TLR4: forward 5′-TGT CAT CAG GGA CTT TGC TG-3′, reverse 5′-TGT TCT TCT CCT GCC TGA CA-3′. The relative quantities of amplified cDNAs were analyzed by SDS software (Applied Biosystems), and target values were normalized to β-actin mRNA.
ELISA
IL-6 and CCL-2 protein levels in culture supernatants were determined by commercial kits (Bender MedSystems, Vienna, Austria). HMGB1 protein level was determined by the HMGB1 ELISA Kit II (Shino-test, Tokyo, Japan). The detection sensitivity and the intrabatch coefficient of variation were 0.92 pg/ml ± 6.2% for IL-6, 2.3 pg/ml ± 7.7% for CCL-2, and 1 ng/ml ± 10% for HMGB1.
Western Blot Analysis
Western blot was performed as previously described.35 Primary antibodies for TLR4 (Santa Cruz Biotechnology, Santa Cruz, CA), TLR2 (Abcam, Cambridge, UK), phospho-IκBα (Ser32), IκBα (Ser32) (Cell Signaling, Beverly, CA), and actin (Pierce, Rockford, IL) were used. The membrane was incubated with a horseradish peroxidase–conjugated secondary antibody (Dako, Carpinteria, CA), and the immunoreactive bands were detected with ECLPlus chemiluminescence reagent (Amersham Pharmacia Biotech, Arlington, VA).
Immunofluorescence Staining
PTECs grown on coverslips were fixed with 3% paraformaldehyde, blocked with 2% BSA, and stained with anti–NF-κB p65 antibody (Santa Cruz Biotechnology), followed by FITC-conjugated IgG (BD Pharmingen, San Diego, CA), and then mounted with Vectashield containing 4′,6-diamidino-2-phenylindole (Vector Laboratories, Burlingame, CA). Immunofluorescence was visualized under a Leica fluorescence microscope with the appropriate filters.
Chemotaxis Assay
Chemotaxis assay was performed as described previously.61 Undifferentiated U937 cells or PBMCs labeled by Calcein-AM (5 μg/ml; Invitrogen) were seeded onto the upper chamber of a Transwell insert (5-μm pore size; Corning Life Sciences, Corning, NY). Conditioned media from HG-pretreated PTEC were added to the lower chamber, incubated for 3 hours, and collected to measure the number of transmigrated cells using a Tecan spectrofluorometer (excitation at 480 nm, emission at 530 nm). The efficacy of chemotaxis was presented as the percentage of input cells seeded onto the upper chamber that transmigrated to the lower chamber.
Immunohistochemistry
Immunohistochemistry was performed as described previously in paraffin-embedded tissue sections at a thickness of 4 μm.22 For human biopsy samples, anti-TLR4, anti-CD68 (1:50; Santa Cruz Biotechnology), anti-TLR2 (1:100; Abcam), anti-HMGB1 (1:100; Abnova, Taipei, Taiwan), and anti-HSP70/72 (1:50; Enzo Life Sciences, Ann Arbor, MI) antibodies were used. The primary antibodies used for mouse tissue were as follows: anti–CCL-2 (1:100; Abcam), anti-F4/80 antigen (1:50; Serotec, Oxford, UK), and anti–phospho-NF-κB p65 (Ser276) (1:100; Cell Signaling). Isotype-matched antibodies corresponding with the primary antibodies (Santa Cruz Biotechnology) were used as negative controls. Sections were counterstained with hematoxylin. Positive staining was qualified by using Image Pro Plus Software 5.0 (Media Cybernetics, Silver Spring, MD) and expressed as IOD. The numbers of CD68+ and F4/80+ cells and phospho-p65 staining cells in tubulointerstitium were counted in 15 equivalent high-power cortical fields (HPF × 400) and were expressed as the average number of cells per square millimeter.
The extent of cortical tubular TLR4 and TLR2 staining in human biopsy was also graded semiquantitatively by two independent observers using a 6-point (grades 0–5) method that we recently described24: 0, no staining; 1, 0 to <10% positive; 2, 10% to <20% positive; 3, 20% to <40% positive; 4, 40% to <60% positive; 5, ≥60% positive.
Statistical Analyses
All data were expressed as means ± SD unless otherwise specified. Statistical analysis was performed using unpaired two-tailed t test or one-way ANOVA followed by Bonferroni multiple comparison test by SPSS v15.0 for Windows (SPSS, Chicago, IL). Correlation between tubular TLR4 IOD and the number of interstitial CD68+ cells was tested by Spearman correlation analysis, and P<0.05 was considered statistically significant.
DISCLOSURES
None.
Acknowledgments
We are grateful for the professional assistance provided by Dr. Alfred W.H. Chan.
This study was supported by the General Research Fund of the Research Grants Council of Hong Kong (Grant HKU 7764/07M).
Part of the results from this study was presented in abstract form at the American Society of Nephrology Renal Week, November 18–21, 2010, Denver, Colorado.
Footnotes
Published online ahead of print. Publication date available at www.jasn.org.
REFERENCES
- 1.Zimmet P, Alberti KG, Shaw J: Global and societal implications of the diabetes epidemic. Nature 414: 782–787, 2001 [DOI] [PubMed] [Google Scholar]
- 2.Navarro-González JF, Mora-Fernández C: The role of inflammatory cytokines in diabetic nephropathy. J Am Soc Nephrol 19: 433–442, 2008 [DOI] [PubMed] [Google Scholar]
- 3.Taft JL, Nolan CJ, Yeung SP, Hewitson TD, Martin FI: Clinical and histological correlations of decline in renal function in diabetic patients with proteinuria. Diabetes 43: 1046–1051, 1994 [DOI] [PubMed] [Google Scholar]
- 4.Mackenzie HS, Ziai F, Omer SA, Nadim MK, Taal MW: Angiotensin receptor blockers in chronic renal disease: the promise of a bright clinical future. J Am Soc Nephrol 10[Suppl 12]: S283–S286, 1999 [PubMed] [Google Scholar]
- 5.The GISEN Group (Gruppo Italiano di Studi Epidemiologici in Nefrologia): Randomised placebo-controlled trial of effect of ramipril on decline in glomerular filtration rate and risk of terminal renal failure in proteinuric, non-diabetic nephropathy. Lancet 349: 1857–1863, 1997 [PubMed] [Google Scholar]
- 6.Beutler B: Inferences, questions and possibilities in Toll-like receptor signalling. Nature 430: 257–263, 2004 [DOI] [PubMed] [Google Scholar]
- 7.Wu H, Chen G, Wyburn KR, Yin J, Bertolino P, Eris JM, Alexander SI, Sharland AF, Chadban SJ: TLR4 activation mediates kidney ischemia/reperfusion injury. J Clin Invest 117: 2847–2859, 2007 [DOI] [PMC free article] [PubMed] [Google Scholar]
- 8.Chen J, John R, Richardson JA, Shelton JM, Zhou XJ, Wang Y, Wu QQ, Hartono JR, Winterberg PD, Lu CY: Toll-like receptor 4 regulates early endothelial activation during ischemic acute kidney injury. Kidney Int 79: 288–299, 2011 [DOI] [PMC free article] [PubMed] [Google Scholar]
- 9.Cunningham PN, Wang Y, Guo R, He G, Quigg RJ: Role of Toll-like receptor 4 in endotoxin-induced acute renal failure. J Immunol 172: 2629–2635, 2004 [DOI] [PubMed] [Google Scholar]
- 10.Ducloux D, Deschamps M, Yannaraki M, Ferrand C, Bamoulid J, Saas P, Kazory A, Chalopin JM, Tiberghien P: Relevance of Toll-like receptor-4 polymorphisms in renal transplantation. Kidney Int 67: 2454–2461, 2005 [DOI] [PubMed] [Google Scholar]
- 11.Krüger B, Krick S, Dhillon N, Lerner SM, Ames S, Bromberg JS, Lin M, Walsh L, Vella J, Fischereder M, Krämer BK, Colvin RB, Heeger PS, Murphy BT, Schröppel B: Donor Toll-like receptor 4 contributes to ischemia and reperfusion injury following human kidney transplantation. Proc Natl Acad Sci USA 106: 3390–3395, 2009 [DOI] [PMC free article] [PubMed] [Google Scholar]
- 12.Pulskens WP, Rampanelli E, Teske GJ, Butter LM, Claessen N, Luirink IK, van der Poll T, Florquin S, Leemans JC: TLR4 promotes fibrosis but attenuates tubular damage in progressive renal injury. J Am Soc Nephrol 21: 1299–1308, 2010 [DOI] [PMC free article] [PubMed] [Google Scholar]
- 13.Brown HJ, Lock HR, Wolfs TG, Buurman WA, Sacks SH, Robson MG: Toll-like receptor 4 ligation on intrinsic renal cells contributes to the induction of antibody-mediated glomerulonephritis via CXCL1 and CXCL2. J Am Soc Nephrol 18: 1732–1739, 2007 [DOI] [PubMed] [Google Scholar]
- 14.Summers SA, van der Veen BS, O’Sullivan KM, Gan PY, Ooi JD, Heeringa P, Satchell SC, Mathieson PW, Saleem MA, Visvanathan K, Holdsworth SR, Kitching AR: Intrinsic renal cell and leukocyte-derived TLR4 aggravate experimental anti-MPO glomerulonephritis. Kidney Int 78: 1263–1274, 2010 [DOI] [PubMed] [Google Scholar]
- 15.Patole PS, Gröne HJ, Segerer S, Ciubar R, Belemezova E, Henger A, Kretzler M, Schlöndorff D, Anders HJ: Viral double-stranded RNA aggravates lupus nephritis through Toll-like receptor 3 on glomerular mesangial cells and antigen-presenting cells. J Am Soc Nephrol 16: 1326–1338, 2005 [DOI] [PubMed] [Google Scholar]
- 16.Pawar RD, Patole PS, Ellwart A, Lech M, Segerer S, Schlondorff D, Anders HJ: Ligands to nucleic acid-specific toll-like receptors and the onset of lupus nephritis. J Am Soc Nephrol 17: 3365–3373, 2006 [DOI] [PubMed] [Google Scholar]
- 17.Pawar RD, Patole PS, Zecher D, Segerer S, Kretzler M, Schlöndorff D, Anders HJ: Toll-like receptor-7 modulates immune complex glomerulonephritis. J Am Soc Nephrol 17: 141–149, 2006 [DOI] [PubMed] [Google Scholar]
- 18.Shi H, Kokoeva MV, Inouye K, Tzameli I, Yin H, Flier JS: TLR4 links innate immunity and fatty acid-induced insulin resistance. J Clin Invest 116: 3015–3025, 2006 [DOI] [PMC free article] [PubMed] [Google Scholar]
- 19.Reyna SM, Ghosh S, Tantiwong P, Meka CS, Eagan P, Jenkinson CP, Cersosimo E, Defronzo RA, Coletta DK, Sriwijitkamol A, Musi N: Elevated toll-like receptor 4 expression and signaling in muscle from insulin-resistant subjects. Diabetes 57: 2595–2602, 2008 [DOI] [PMC free article] [PubMed] [Google Scholar]
- 20.Devaraj S, Dasu MR, Park SH, Jialal I: Increased levels of ligands of Toll-like receptors 2 and 4 in type 1 diabetes. Diabetologia 52: 1665–1668, 2009 [DOI] [PMC free article] [PubMed] [Google Scholar]
- 21.Dasu MR, Devaraj S, Park S, Jialal I: Increased toll-like receptor (TLR) activation and TLR ligands in recently diagnosed type 2 diabetic subjects. Diabetes Care 33: 861–868, 2010 [DOI] [PMC free article] [PubMed] [Google Scholar]
- 22.Tang SC, Leung JC, Chan LY, Tsang AW, Lai KN: Activation of tubular epithelial cells in diabetic nephropathy and the role of the peroxisome proliferator-activated receptor-gamma agonist. J Am Soc Nephrol 17: 1633–1643, 2006 [DOI] [PubMed] [Google Scholar]
- 23.Wang J, Tang S, Shen H: Association of genetic polymorphisms in the IL12-IFNG pathway with susceptibility to and prognosis of pulmonary tuberculosis in a Chinese population. Eur J Clin Microbiol Infect Dis 29: 1291–1295, 2010 [DOI] [PubMed] [Google Scholar]
- 24.Tang S, Leung JC, Abe K, Chan KW, Chan LY, Chan TM, Lai KN: Albumin stimulates interleukin-8 expression in proximal tubular epithelial cells in vitro and in vivo. J Clin Invest 111: 515–527, 2003 [DOI] [PMC free article] [PubMed] [Google Scholar]
- 25.Fornoni A, Ijaz A, Tejada T, Lenz O: Role of inflammation in diabetic nephropathy. Curr Diabetes Rev 4: 10–17, 2008 [DOI] [PubMed] [Google Scholar]
- 26.Gilbert RE, Cooper ME: The tubulointerstitium in progressive diabetic kidney disease: more than an aftermath of glomerular injury? Kidney Int 56: 1627–1637, 1999 [DOI] [PubMed] [Google Scholar]
- 27.Akira S, Takeda K, Kaisho T: Toll-like receptors: critical proteins linking innate and acquired immunity. Nat Immunol 2: 675–680, 2001 [DOI] [PubMed] [Google Scholar]
- 28.Brown HJ, Sacks SH, Robson MG: Toll-like receptor 2 agonists exacerbate accelerated nephrotoxic nephritis. J Am Soc Nephrol 17: 1931–1939, 2006 [DOI] [PubMed] [Google Scholar]
- 29.Leemans JC, Stokman G, Claessen N, Rouschop KM, Teske GJD, Kirschning CJ, Akira S, van der Poll T, Weening JJ, Florquin S: Renal-associated TLR2 mediates ischemia/reperfusion injury in the kidney. J Clin Invest 115: 2894–2903, 2005 [DOI] [PMC free article] [PubMed] [Google Scholar]
- 30.Li F, Yang N, Zhang L, Tan H, Huang B, Liang Y, Chen M, Yu X: Increased expression of toll-like receptor 2 in rat diabetic nephropathy. Am J Nephrol 32: 179–186, 2010 [DOI] [PubMed] [Google Scholar]
- 31.Shigeoka AA, Holscher TD, King AJ, Hall FW, Kiosses WB, Tobias PS, Mackman N, McKay DB: TLR2 is constitutively expressed within the kidney and participates in ischemic renal injury through both MyD88-dependent and -independent pathways. J Immunol 178: 6252–6258, 2007 [DOI] [PubMed] [Google Scholar]
- 32.Klune JR, Dhupar R, Cardinal J, Billiar TR, Tsung A: HMGB1: endogenous danger signaling. Mol Med 14: 476–484, 2008 [DOI] [PMC free article] [PubMed] [Google Scholar]
- 33.Wu H, Ma J, Wang P, Corpuz TM, Panchapakesan U, Wyburn KR, Chadban SJ: HMGB1 contributes to kidney ischemia reperfusion injury. J Am Soc Nephrol 21: 1878–1890, 2010 [DOI] [PMC free article] [PubMed] [Google Scholar]
- 34.Erridge C: Endogenous ligands of TLR2 and TLR4: agonists or assistants? J Leukoc Biol 87: 989–999, 2010 [DOI] [PubMed] [Google Scholar]
- 35.Tang SC, Chan LY, Leung JC, Cheng AS, Chan KW, Lan HY, Lai KN: Bradykinin and high glucose promote renal tubular inflammation. Nephrol Dial Transplant 25: 698–710, 2010 [DOI] [PubMed] [Google Scholar]
- 36.Asehnoune K, Strassheim D, Mitra S, Yeol Kim J, Abraham E: Involvement of PKCalpha/beta in TLR4 and TLR2 dependent activation of NF-kappaB. Cell Signal 17: 385–394, 2005 [DOI] [PubMed] [Google Scholar]
- 37.Dasu MR, Devaraj S, Zhao L, Hwang DH, Jialal I: High glucose induces toll-like receptor expression in human monocytes: mechanism of activation. Diabetes 57: 3090–3098, 2008 [DOI] [PMC free article] [PubMed] [Google Scholar]
- 38.Wolf G, Bohlender J, Bondeva T, Roger T, Thaiss F, Wenzel UO: Angiotensin II upregulates toll-like receptor 4 on mesangial cells. J Am Soc Nephrol 17: 1585–1593, 2006 [DOI] [PubMed] [Google Scholar]
- 39.Bondeva T, Roger T, Wolf G: Differential regulation of Toll-like receptor 4 gene expression in renal cells by angiotensin II: dependency on AP1 and PU.1 transcriptional sites. Am J Nephrol 27: 308–314, 2007 [DOI] [PubMed] [Google Scholar]
- 40.Lv J, Jia R, Yang D, Zhu J, Ding G: Candesartan attenuates angiotensin II-induced mesangial cell apoptosis via TLR4/MyD88 pathway. Biochem Biophys Res Commun 380: 81–86, 2009 [DOI] [PubMed] [Google Scholar]
- 41.Liu KH, Zhou QL, Ao X, Tang TF, Hong XM, Bao RL: [Effect of spironolactone on the expression of Toll-like receptor 4 in renal tubular epithelia cells exposed to high glucose]. Zhongguo Dang Dai Er Ke Za Zhi 12: 280–283, 2010 [PubMed] [Google Scholar]
- 42.Dasu MR, Jialal I: Free fatty acids in the presence of high glucose amplify monocyte inflammation via Toll-like receptors. Am J Physiol Endocrinol Metab 300: E145–E154, 2011 [DOI] [PMC free article] [PubMed] [Google Scholar]
- 43.Tesch GH: MCP-1/CCL2: a new diagnostic marker and therapeutic target for progressive renal injury in diabetic nephropathy. Am J Physiol Renal Physiol 294: F697–F701, 2008 [DOI] [PubMed] [Google Scholar]
- 44.Sekizuka K, Tomino Y, Sei C, Kurusu A, Tashiro K, Yamaguchi Y, Kodera S, Hishiki T, Shirato I, Koide H: Detection of serum IL-6 in patients with diabetic nephropathy. Nephron 68: 284–285, 1994 [DOI] [PubMed] [Google Scholar]
- 45.Chow FY, Nikolic-Paterson DJ, Ozols E, Atkins RC, Rollin BJ, Tesch GH: Monocyte chemoattractant protein-1 promotes the development of diabetic renal injury in streptozotocin-treated mice. Kidney Int 69: 73–80, 2006 [DOI] [PubMed] [Google Scholar]
- 46.Chow FY, Nikolic-Paterson DJ, Ma FY, Ozols E, Rollins BJ, Tesch GH: Monocyte chemoattractant protein-1-induced tissue inflammation is critical for the development of renal injury but not type 2 diabetes in obese db/db mice. Diabetologia 50: 471–480, 2007 [DOI] [PubMed] [Google Scholar]
- 47.Prodjosudjadi W, Gerritsma JS, Klar-Mohamad N, Gerritsen AF, Bruijn JA, Daha MR, van Es LA: Production and cytokine-mediated regulation of monocyte chemoattractant protein-1 by human proximal tubular epithelial cells. Kidney Int 48: 1477–1486, 1995 [DOI] [PubMed] [Google Scholar]
- 48.Viedt C, Dechend R, Fei J, Hänsch GM, Kreuzer J, Orth SR: MCP-1 induces inflammatory activation of human tubular epithelial cells: involvement of the transcription factors, nuclear factor-kappaB and activating protein-1. J Am Soc Nephrol 13: 1534–1547, 2002 [DOI] [PubMed] [Google Scholar]
- 49.Hsieh TJ, Chen R, Zhang SL, Liu F, Brezniceanu ML, Whiteside CI, Fantus IG, Ingelfinger JR, Hamet P, Chan JS: Upregulation of osteopontin gene expression in diabetic rat proximal tubular cells revealed by microarray profiling. Kidney Int 69: 1005–1015, 2006 [DOI] [PubMed] [Google Scholar]
- 50.Kelly DJ, Wilkinson-Berka JL, Ricardo SD, Cox AJ, Gilbert RE: Progression of tubulointerstitial injury by osteopontin-induced macrophage recruitment in advanced diabetic nephropathy of transgenic (mRen-2)27 rats. Nephrol Dial Transplant 17: 985–991, 2002 [DOI] [PubMed] [Google Scholar]
- 51.Li J, Jin C, Cleveland JC, Jr, Ao L, Xu D, Fullerton DA, Meng X: Enhanced inflammatory responses to toll-like receptor 2/4 stimulation in type 1 diabetic coronary artery endothelial cells: the effect of insulin. Cardiovasc Diabetol 9: 90, 2010 [DOI] [PMC free article] [PubMed] [Google Scholar]
- 52.Kim F, Pham M, Luttrell I, Bannerman DD, Tupper J, Thaler J, Hawn TR, Raines EW, Schwartz MW: Toll-like receptor-4 mediates vascular inflammation and insulin resistance in diet-induced obesity. Circ Res 100: 1589–1596, 2007 [DOI] [PubMed] [Google Scholar]
- 53.Qi Z, Fujita H, Jin J, Davis LS, Wang Y, Fogo AB, Breyer MD: Characterization of susceptibility of inbred mouse strains to diabetic nephropathy. Diabetes 54: 2628–2637, 2005 [DOI] [PubMed] [Google Scholar]
- 54.Tang SC, Chan LY, Leung JC, Cheng AS, Lan HY, Lai K N: Additive renoprotective effects of B2-kinin receptor blocker and PPAR-γ agonist in uninephrectomized db/db mice. Lab Invest 91: 1351–1362, 2011 [DOI] [PubMed] [Google Scholar]
- 55.Tang SC, Leung JC, Chan LY, Cheng AS, Lan HY, Lai KN: Renoprotection by rosiglitazone in accelerated type 2 diabetic nephropathy: Role of STAT1 inhibition and nephrin restoration. Am J Nephrol 32: 145–155, 2010 [DOI] [PubMed] [Google Scholar]
- 56.Kamijo-Ikemori A, Sugaya T, Sekizuka A, Hirata K, Kimura K: Amelioration of diabetic tubulointerstitial damage in liver-type fatty acid-binding protein transgenic mice. Nephrol Dial Transplant 24: 788–800, 2009 [DOI] [PubMed] [Google Scholar]
- 57.Ninichuk V, Kulkarni O, Clauss S, Anders HJ: Tubular atrophy, interstitial fibrosis, and inflammation in type 2 diabetic db/db mice. An accelerated model of advanced diabetic nephropathy. Eur J Med Res 12: 351–355, 2007 [PubMed] [Google Scholar]
- 58.Leon CG, Tory R, Jia J, Sivak O, Wasan KM: Discovery and development of toll-like receptor 4 (TLR4) antagonists: a new paradigm for treating sepsis and other diseases. Pharm Res 25: 1751–1761, 2008 [DOI] [PMC free article] [PubMed] [Google Scholar]
- 59.Sha T, Sunamoto M, Kitazaki T, Sato J, Ii M, Iizawa Y: Therapeutic effects of TAK-242, a novel selective Toll-like receptor 4 signal transduction inhibitor, in mouse endotoxin shock model. Eur J Pharmacol 571: 231–239, 2007 [DOI] [PubMed] [Google Scholar]
- 60.Lynn M, Rossignol DP, Wheeler JL, Kao RJ, Perdomo CA, Noveck R, Vargas R, D’Angelo T, Gotzkowsky S, McMahon FG: Blocking of responses to endotoxin by E5564 in healthy volunteers with experimental endotoxemia. J Infect Dis 187: 631–639, 2003 [DOI] [PubMed] [Google Scholar]
- 61.Frevert CW, Wong VA, Goodman RB, Goodwin R, Martin TR: Rapid fluorescence-based measurement of neutrophil migration in vitro. J Immunol Methods 213: 41–52, 1998 [DOI] [PubMed] [Google Scholar]
- 62.Levey AS, Bosch JP, Lewis JB, Greene T, Rogers N, Roth D. Modification of Diet in Renal Disease Study Group: A more accurate method to estimate glomerular filtration rate from serum creatinine: a new prediction equation. Ann Intern Med 130: 461–470, 1999 [DOI] [PubMed] [Google Scholar]
- 63.Schwartz GJ, Muñoz A, Schneider MF, Mak RH, Kaskel F, Warady BA, Furth SL: New equations to estimate GFR in children with CKD. J Am Soc Nephrol 20: 629–637, 2009 [DOI] [PMC free article] [PubMed] [Google Scholar]


