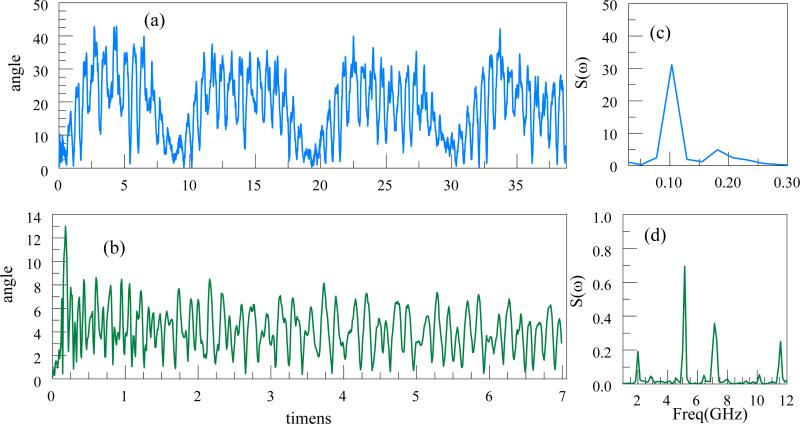
Figure 10.
Shown are the variations with time of the angle of the line connecting the end bases with the z-axis. (a): 15 bases of G, 15A, 15C, 15T. (b): The variation of the angle for an ssDNA with 180 bases (replicated the DNA above 3 times) but with the stretching field. Corresponding power spectral densities are shown at (c) and (d).

