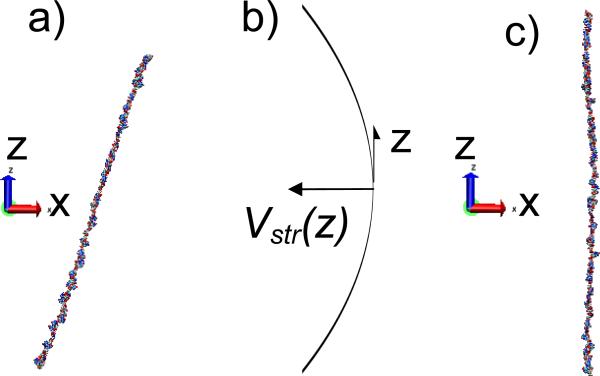
Figure 6.
(a) A snapshot of a 60 G base ssDNA as it oscillates in the trap. The z-axis denotes the trap axis. The DNA remains straight though it undergoes some oscillations and is not parallel to the z-axis. (b) A schematic of a parabolic stretching potential that could be applied in the z-direction to confine the DNA (c) DNA position after stretching potential is applied.

