

Abstract
Background
Existing neuroimaging studies of vagus nerve stimulation (VNS) in treatment resistant major depression (TRMD) suggest that many brain regions (e.g., prefrontal cortex, thalamus, cingulate cortex, insular cortex) associated with mood disorders undergo alterations in blood flow/metabolism.
Objective/Hypothesis
Positron emission tomography (PET oxygen-15 labeled water or PET [15O] H2O) was used to identify changes in regional cerebral blood flow (rCBF) in response to immediate VNS in 13 subjects with TRMD. We hypothesized rCBF changes along the afferent pathway of the vagus and in regions associated with depression (e.g., orbitofrontal cortex, amygdala, insular cortex).
Methods
Six 90-second PET [15O] H2O scans were performed on 13 subjects in a VNS off-on sequence. Following normalization for global uptake and realignment to standard atlas space, statistical t-images (p < 0.005) were used to evaluate rCBF change.
Results
VNS induced significant rCBF decreases in the left and right lateral orbitofrontal cortex and left inferior temporal lobe. Significant increases were found in the right dorsal anterior cingulate, left posterior limb of the internal capsule/medial putamen, the right superior temporal gyrus, and the left cerebellar body. Post-hoc analysis found small to moderate correlations between baseline acute change in rCBF and antidepressant response following 12 months of VNS.
Conclusions
Regions undergoing rCBF change in response to acute VNS are consistent with the known afferent pathway of the vagus nerve and models of brain network in depression. Larger studies assessing the correlation between acute stimulation patterns and antidepressant outcomes with VNS are needed.
Keywords: Vagus nerve stimulation, Depression, Positron emission tomography, Regional blood flow, Treatment-resistant depression
Introduction
Vagus nerve stimulation (VNS; intermittent electrical stimulation of the left cervical vagus via electronic, surgically-implanted generator connected by a lead to the vagus nerve) is approved by the U.S. Food and Drug Administration for adjunctive antidepressant therapy for treatment-resistant major depression (TRMD). A short term (3 month), multi-center, acute study of VNS compared to sham stimulation failed to separate active VNS treatment from placebo in TRMD (1); however, a naturalistic extension of this trial demonstrated a 27% response rate at 1 year (2). Studies assessing long-term efficacy demonstrate that the majority of responders maintain their antidepressant response (46% and 42% at 1 and 2 years respectively, [3,4]). These sustained antidepressant efficacy rates in TRMD are compelling in this highly-resistant population, especially when compared to other favored treatments e.g., electroconvulsive therapy (5).
The primary function of the vagus nerve (VN) is to relay information to and from the central nervous system regarding control of the gastrointestinal, cardiovascular, and respiratory systems. Though it has important efferent functions, most (~80%) of its fibers are afferent (6). Afferent VN fibers enter the medulla at the level of the olive, and travel through the tractus solitarius, terminating primarily in the nucleus tractus solitarius (NTS) (7–10). Each VN synapses bilaterally in the NTS; hence, vagal afferent information is processed bilaterally in the CNS. Ascending efferent fibers from the NTS project most densely to the parabrachial nucleus of the pons (PBN); many fibers from the NTS bypass the PBN and ascend to the taste/visceral thalamic nucleus (11), which also receives input from the PBN. The NTS also projects to other brainstem structures including potentially mood-critical projections to noradrenergic (locus ceruleus) and serotonergic (raphe nuclei) neuromodulatory systems (11–13). From the PBN, vagal information is relayed to a number of structures, including the hypothalamus, the central nucleus of the amygdala, the bed nucleus of the stria terminalis, and the intralaminar thalamic nucleus (7, 14,15). Finally, the visceral thalamic nucleus carries vagal afferent information to the anterior insular cortex (14,16). The insular cortex then communicates with more rostral regions of the cortex (orbital and ventrolateral prefrontal cortex), and also indirectly communicates with the medial prefrontal cortex (17,18).
Little is known regarding VNS mechanism of action in TRMD. Evidence, from both clinical and neuroimaging studies of VNS in TRMD, suggests that the therapeutic and brain effects of VNS are gradual over several months (2,19). Early acute VNS stimulation causes different changes in regional brain activity than later acute stimulation. Nahas et al (19), using a multiple regression model with changes in functional MRI signal as the dependent variable, found several statistically significant regions (including the right insula and right frontal lobe) undergoing activation early in VNS that no longer demonstrated increased BOLD signal after months of VNS.
Current models of major depressive disorder (MDD) hypothesize a dysregulation of several interconnected structures in the frontal and limbic circuitry (20). Key structures in this network include the prefrontal cortex (medial, orbital, and dorsolateral), amygdala, insular cortex, cingulate cortex, hippocampus, striatum, dorsal thalamus, and hypothalamus. Existing knowledge of the upstream projections of the vagus nerve (7) as well as functional neuroimaging studies of VNS in TRMD, have demonstrated that several of these regions (e.g., prefrontal cortex, anterior cingulate cortex, thalamus, insular cortex, amygdala) undergo alterations in blood flow/metabolism in response to VNS (19,21–25).
A pilot PET study of acute VNS in 4 VNS-naive TRMD patients by our group found multiple regions of significant change in rCBF including the orbitofrontal cortex, anterior cingulate, and insular cortices (22). BOLD fMRI studies have found similar acute changes in prefrontal regions (19,21,25). The current study expands on our pilot work (22) using a larger sample (N = 13) and [15O] H2O PET to identify acute VNS-induced rCBF changes in VNS-naïve TRMD patients. We hypothesized VNS-induced rCBF change in regions innervated by the pathway of the afferent vagus nerve, including the insular cortex, amygdala, cerebellum, the anterior cingulate cortex, and the orbitofrontal cortex.
Methods and Materials
Subjects
The institutional review board of Washington University approved the study and written informed consent was obtained. Subjects (N = 14) were recruited from the community (n = 7) or as participants in the VNS dose-finding efficacy trial (n = 7) occurring simultaneously at Saint Louis University (the D-21 study, entitled “Randomized comparison of outcomes in patients with treatment-resistant depression who receive VNS therapy administered at different amounts of electrical charge,” sponsored by Cyberonics, Inc., Houston, Texas, USA). One subject was subsequently determined to have panhypopituitarism and was withdrawn; hence, the final sample size is N = 13. Patients were recruited from local psychiatrists and by web postings. Initial study qualification was made via telephone screening; final qualification determination was made following a live interview and verification of treatment resistance via medical chart review.
For the purposes of this imaging study, treatment-resistant depression was defined as follows: a current diagnosis of major depressive disorder, as defined by DSM-IV and confirmed using the Structured Clinical Interview for DSM-IV (26), a history of at least 2 adequate dose-duration medication trial failures in the current depressive episode and a total of 4 lifetime antidepressant treatment trial failures. Medication treatment failures were defined using a modification of the Antidepressant Treatment History Form (ATHF) (5,27–29). Each medication was scored from 1 to 4 according to the Antidepressant Resistance Rating (ARR) scale of the ATHF form. Each subject had to score a ≥ 3 on the ARR scale for each failed treatment trial and be exposed to this antidepressant dosage for a minimum of eight weeks (the ATHF requires only 4 weeks). Additionally, failed trials of proven antidepressant augmentation agents (aripiprazole, thyroid hormone, and lithium augmentation) were also included. Hence, the treatment classes of failed trials included: heterocyclic/tricyclics, monoamine oxidase inhibitors, buproprion, venlafaxine, duloxetine, mirtazapine, electroconvulsive therapy (ECT), selective serotonin reuptake inhibitors, nefazodone, and lithium, aripriprazole, and thyroid stimulating hormone augmentation. Thus, across all subjects, 12 classes of potential antidepressant treatments could count towards study inclusion criteria.
Additional inclusion criteria included: a baseline score of ≥ 18 on the Hamilton Depression Rating Scale-24 (HDRS-24; 30), male or female, age 18–85, and the absence of any other active axis I diagnosis. Study exclusion criteria included: age less than 18 or greater than 85, pregnancy, previous history of stroke, traumatic/closed head injury or brain malformation, contraindication for MRI (including implanted metal), acute suicidal intention, history of a serious suicide attempt in the past 12 months, history of claustrophobia, history of recent substance abuse diagnosis (12 months), or inability to lie still for > 2 hours.
The study sample is described in Table 1. All subjects received VNS concomitantly with existing pharmacotherapy (Table 1S).
Table 1.
Demographics and illness history of study subjects
| Sample Characteristics | Descriptive Data |
|---|---|
| Age in years, mean (SD) | 42.7 (12.7) |
| Gender, male vs. female, % (n) | 15% vs. 85% (2/11) |
| Race, white vs. non-white, % (n) | 100% vs. 0% (13/0) |
| Depression, age of onset in years, mean (SD) | 17.2 (10.1) |
| Depression, number of episodes, 1–3 vs. >3, % (n) | 69% vs. 33% (9/4) |
| Depression, current episode in years, mean (SD) | 11.9 (13.1) |
| Depression, total years, mean (SD) | 22.7 (15.1) |
| Previous ECT, yes vs. no, % (n) | 77% vs. 23% (10/3) |
| Previous hospitalizations for depression, mean (SD) | 2.5 (5.4) |
| Mood disorder history, primary family, yes vs. no, % (n) | 62% vs. 38% (8/5) |
ECT, electroconvulsive therapy; SD, standard deviation.
Mood Assessments
A HDRS-24 of ≥ 18 was required for TRMD subjects to enter this trial. Although this study focuses on the immediate brain stimulation effects in VNS-naïve subjects, depression and mood assessments were performed at multiple time points, including baseline (within 2 weeks of VNS implantation but prior to initiation of stimulation), 3 months, and 12 months. The HDRS-24 was the primary mood assessment scale of this trial. Other measures of depression and mania done at these same time points included: the Montgomery Asberg Depression Rating Scale (31), the Inventory of Depressive Symptomology-Self Report (32), and the Young Mania Rating Scale (33). To assess the change in the primary depressive measure (HDRS-24) over time, a repeated measures ANOVA with post hoc Bonferonni-adjusted pairwise comparisons of means was performed. Finally, linear correlations were calculated based on percent change in baseline rCBF (VNS “on” versus “off”) and percent change in the primary depression measure (HDRS-24).
Imaging and scan acquisition
Subjects underwent six PET [15O] H2O scans in a single session within 5 days of VNS activation (average days following VNS = 4.5, SD = 1.8; range 1.0–8.0 days). All subjects except two had their scans within 5 days (one subject’s PET scan had to be postponed to day 8 due to PET scanner repairs, another was postponed to day 6 due to illness). We selected to do the PET scans on post-stimulation day five to approximate the VNS-naïve brain state in TRMD. In the design of the study, it was decided that the often-significant psychological stress the recently-implanted VNS patient experiences when the device is first turned on (anticipatory anxiety as well as anxiety on experiencing the novel stimulus for the first time) and the discomfort/pain that might be experienced would potentially create a significant confound (i.e., the regional cerebral blood flow patterns could be altered by this heightened level of anxiety). As a compromise, we chose to select a period very close to the initiation of stimulation (within 5 days of initiation of VNS stimulation). VNS settings were standardized as follows: 0.25mA current, 20 Hz frequency, and 130 μsec pulse width. These low-level settings were selected to accommodate the lowest electrical “dose” blinded arm of the D-21 dose-finding study. Using higher-level settings in the PET study could have compromised the D-21 study subjects regarding their ability to differentiate lower-level from higher-level stimulation. VNS device cycling (30 seconds on, 5 minutes off) was deactivated for 20 minutes prior to scanning. PET-CT scans were obtained using a Siemens Biograph 40 TruePoint PET/CT scanner (Siemens, Berlin) in two-dimensional acquisition mode (e.g., septa in). Subjects were positioned in the scanner with scanning planes oriented to the canthomeatal line. A computed tomography scan was obtained for attenuation correction. Six emission scans were then obtained in a VNS off-on sequence. The scan order for each subject was identical (off-on-off-on-off-on). Following each 90 second PET scan, there was a rest period of 14 minutes in which the VNS device was turned off. For “on” scans, the VNS stimulator was acutely activated to deliver 90 seconds of VNS. Tracer delivery and device “on” were coordinated as follows: immediately prior to IV injection of 50 mCi of [15O]H2O, the VNS device was activated. This was done to ensure blood flow changes would be ongoing prior to tracer arrival. In synchrony with tracer injection, a 90-second scan was obtained. An identical protocol was followed for “off” scans, except VNS was deactivated. Images were re-constructed with the commercial two iteration OS-EM processing method.
Data processing and analysis
Each set of six PET images per subject was corrected for head motion using established methods (34,35). PET data were resampled to Talairach atlas space (36). To achieve scan alignment into common atlas space, the six registered scans per subject were summed to create a single scan with a higher signal-to-noise ratio. Summed scans were then aligned using the full 12-parameter linear affine registration to a pre-existing PET [15O]H2O scan laboratory target (37). Mathematical transforms were then calculated to allow a single resampling of the original reconstructed PET images into Talairach atlas space. Global normalization was accomplished using atlas space pixels containing all data sets. To create the statistical image, the three “on” scans and the three “off” scans per subject were averaged and smoothed using a Gaussian filter (10 mm full-width half-maximum). Pixel-by-pixel calculation of the paired t-test was then performed on the resulting image set and searched for clusters (number of pixels N = 25) with t-scores of 3.43 (p < .005). Note: due to technical problems with isotope delivery, three subjects had only two “on” scans and two “off” scans, this was weight-adjusted in creating the average “on” and average “off” composite images.
Results
Areas of significant immediate rCBF change
As shown in Table 2 and Figure 1, relative to resting state (i.e., VNS “off”), acute VNS was associated with statistically significant rCBF decreases in the left and right lateral orbitofrontal cortex (Brodmann areas [BA] 47/11), and the left inferior temporal region (BA 20). Significant rCBF increases were found in the dorsal anterior cingulate (BA 24), left ventrolateral and ventromedial cerebellum, left posterior limb of internal capsule/medial putamen, and right superior temporal gyrus.
Table 2.
Brain regions with significantly decreased or increased rCBF in response to acute VNS (significance: t = 3.43, p < .005).
| Brain Regions | Side | Voxels | t-Score | BA | Talairach Coordinates
|
||
|---|---|---|---|---|---|---|---|
| X | Y | Z | |||||
| Decreased rCBF | |||||||
| Lateral orbital cortex | L | 84 | 3.78 | 47,11 | −40 | 44 | −10 |
| Lateral orbital cortex | R | 193 | 3.80 | 47,11 | 40 | 48 | −5 |
| Inferior Temporal Gyrus | L | 212 | 3.91 | 20 | −62 | −21 | −29 |
| Increased rCBF | |||||||
| Posterior Limb Internal Capsule/Medial putamen* | L | 266 | 3.88 | n/a | −21 | −20 | 14 |
| Rostral/Dorsal anterior cingulate** | R | 253 | 3.86 | 24 | 8 | 17 | 26 |
| Superior temporal gyrus | R | 100 | 3.55 | 22 | 53 | −43 | 13 |
| Ventromedial cerebellum | L | 63 | 3.65 | n/a | −18 | −83 | −44 |
| Ventrolateral cerebellum | L | 116 | 3.65 | n/a | −48 | −53 | −47 |
Region falls predominantly in white matter. This could represent increased rCBF to the white matter of the internal capsule; however, it more likely increased blood flow to the adjacent medial putamen.
also includes portions of corpus callosum
Figure 1.
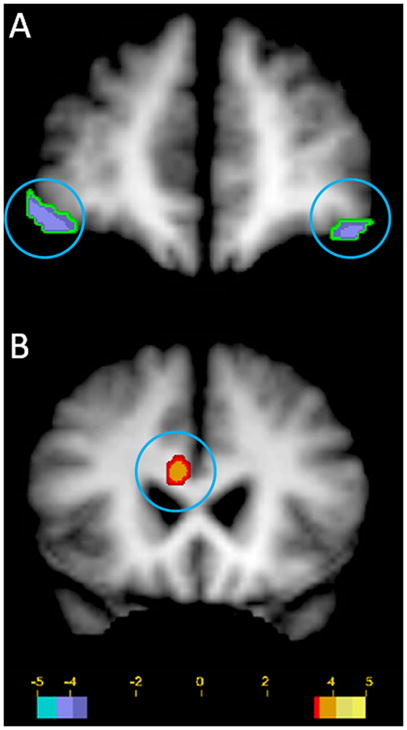
Statistically significant increases and decreases in regional cerebral blood flow (rCBF) in 13 TRMD subjects with acute vagus nerve stimulation (significance: t = 3.43, p < .005). Panel A: decreased bilateral rCBF in the lateral orbital cortex (coronal view; circled). Panel B: increased rCBF in the rostral/dorsal anterior cingulate and portions of the adjacent corpus callosum (coronal view; circled). Images in radiological format (viewer’s left = right side); green to blue = decreased rCBF; red to yellow = increased rCBF.
Mood Assessments
The mean HDRS-24 score of subjects at baseline was 27.6 (SD = 4.5), at 3 months 19.5 (N = 10, 19.5, SD = 9.2), and at 12 months 10.9 (N = 10, SD = 7.8). Change in HDRS-24 score was significant over time. All other depression assessment scales demonstrated equivalent changes. With n = 10 (due to missing mood data at 12 months for three subjects), a repeated measures analysis of variance was significant for change over time, F(2,8) = 17.4, p = .001. Bonferonni-adjusted pairwise comparisons indicated a significant difference between HDRS-24 at baseline vs. 12 months, p < .05. Baseline vs. 3 months and 3 months vs. 12 months comparisons were not significant. No subject developed manic symptomology (mean YMRS score at 3 months 1.0 [N = 10, SD =1.4] and at 12 months 1.6 [N= 10, SD = 2.5])
Correlations were computed between percent change in rCBF with VNS “on” versus “off” and percent change in HDRS-24 from baseline to 12 months (Table 3). With n = 10, a correlation coefficient must be r ≥ .60 for statistical significance to be achieved at p < .05. As shown in Table 3, none of the obtained correlations was statistically significant. Nevertheless, several of the correlations exceeded r = |.20|: left lateral cerebellum, left putamen/internal capsule, and bilateral orbitofrontal cortex) and the correlation for the right dorsal anterior cingulated cortex was r = −.40 (p = .25), a moderately strong relationship. Interpretation of this correlation indicates that the larger the percentage VNS-induced increase in rCBF in the dorsal anterior cingulate, the larger the percentage decrease in HDRS-24 between baseline and 12 months.
Table 3.
Descriptive Data for Changes in rCBF VNS On vs. Off and Correlations of rCBF Change with HDRS-24 Change
| Variable | Mean (SD)
|
Correlation (r) | |
|---|---|---|---|
| % Δ rCBF, VNS (On– Off) | % Δ BL-12 MO | % Δ rCBF, % Δ BL-12 MO | |
| HDRS-24* | — | −60.1 (28.6) | — |
| L Lateral orbital cortex | −8.0 (7.3) | — | .22 |
| R Lateral orbital cortex | −4.9 (8.0) | — | .24 |
| L Inferior temporal gyrus | −4.2 (3.6) | — | −.02 |
| L Posterior Limb Internal Capsule/Medial putamen | 6.3 (7.9) | — | −.21 |
| R Rostral/Dorsal anterior cingulate | 16.8 (21.4) | — | −.40 |
| R Superior temporal gyrus | 7.0 (8.1) | — | .06 |
| L Ventromedial cerebellum | 1.7 (6.9) | — | .03 |
| L Ventrolateral cerebellum | 4.0 (2.5) | — | .23 |
BL > 12 MO by Bonferonni-adjusted pairwise comparison. All other pairwise comparisons were not significant. R = right; L = left.
Discussion
The rCBF changes identified here are consistent with the neuroanatomy of the vagal afferent system (7). The frontal regions with the greatest rCBF decreases were the left and right lateral orbital cortices (OFC; BA 47 & 11). The OFC is a known upstream vagal nerve target (7,17). Similar [15O] H2O PET studies (in epilepsy) have demonstrated significant bilateral OFC acute increases in rCBF (38). In contrast, our findings demonstrated low-dose stimulation provided to VNS-naive TRMD subjects, unlike the epilepsy studies, decreased bilateral OFC rCBF. This trend was consistent: of 13 subjects scanned 92% (12/13) and 77% (10/13) demonstrated decreased rCBF at the left and right orbitofrontal region respectively. Henry et al (38), using a similar PET methodology, assessed acute stimulation on VNS-naïve brains in epilepsy and found high-dose stimulation (average current 0.5mA, 500 μsec pulse width, frequency 30Hz) led to increased rCBF in the bilateral OFC. However, low dose stimulation (average current 0.85mA, 130 μsec pulse width, frequency 1Hz) led to no rCBF change at the bilateral OFC. The OFC findings in this study suggest decreased OFC rCBF in VNS-naïve TRMD subjects may be a disease-specific response unique to depression; however, given that these low-dose stimulations were not identical to those used in the epilepsy studies, definitive conclusions cannot be drawn.
These OFC findings differ from our pilot data (22), where we found increased activation in the left posterior orbital cortex (BA11) and left inferior frontal cortex (BA47). This may be explained by the location of the OFC loci: the earlier findings demonstrated change in more anterior orbitofrontal loci (Talairach coordinates: –33, 23, –12 and –29, 36, −4 versus −40, 44, −10 and 40, 48, −5 for this study). Also, the pilot study used a small sample (N=4) and significantly higher dosing of VNS (average current .625mA, average pulse width > 400 μsec, and high frequency 30Hz).
It may be important to note that fMRI studies of immediate VNS stimulation in TRMD have not emphasized the immediate effects of stimulation on the VNS-naïve brain. Mu et al. (21), using BOLD fMRI while varying the stimulus pulse width (130, 250, or 500 μsec), found increased BOLD signal in the left lateral orbital cortex at all three pulse widths. Importantly, this group assessed acute VNS stimulation response in subjects exposed to prolonged VNS (average VNS exposure = 26.8 months), in contrast to the current study (mean stimulation = 4.5 days).
Acutely altering the neuronal activity of the OFC regions could potentially be critical in influencing major depressive disorder (MDD). Ongur and Price (18) established that the human rostral orbitofrontal region is histologically comparable to the macaque monkey brain regions 47/12r and 11. These lateral orbital regions are in the “orbital network”, which integrates visceral afferents and other modalities (18), and in human neuroimaging studies are associated with decision-making and cognitive control (39). Histological neuronal tracking studies of macaque monkey brains reveal this orbital network to be distinct from, but interconnected with, the medial prefrontal network (including BA 24/25). Studies have demonstrated that the medial network, especially the subgenual cingulate cortex, undergoes metabolic change (primarily increased metabolism) with depression (40). The medial prefrontal cortex appears to undergo significant change with VNS for TRMD. Using FDG-PET in eight TRMD subjects receiving VNS for one year, Pardo et al. (23) found progressive decreases in metabolism in subgenual and ventromedial prefrontal regions; this study did not have an adequate number of responders to study the specific antidepressant effects of sustained VNS. Similarly, Nahas et al. (19), using sequential BOLD fMRI VNS acute stimulation scans in TRMD, demonstrated decreased BOLD signal in the right subgenual cingulate (BA25). Thus, it is possible that sustained VNS may act through the lateral orbital network to affect the subgenual and ventromedial prefrontal regions.
The amygdala is an upstream component of the vagus (7). We had hypothesized this to be a site of rCBF change; however, this region did not experience a statistically significant change in rCBF in the whole brain comparison. Subsequently, we did a regional analysis of rCBF change at the bilateral amygdala. For averaged “on” scans and “off” scans at this region there was no mean change in rCBF (left amygdala: t(12) = 1.2, p = .25; right amygdala: t(12) = −1.1, p = .26), which suggests that acute, low current VNS stimulation in VNS-naïve TRMD does not lead to measurable immediate change in rCBF/activity in amygdala. This is consistent with several other VNS immediate stimulation studies in TRMD (19,21,25). In contrast, Henry et al., (38) did find bilateral decreased amygdalar regional blood flow at baseline in treatment-resistant epilepsy.
Increased rCBF was identified in the dorsal anterior cingulate (BA 24) and adjacent cingulum bundle and corpus callosum (white matter). PET imaging studies assessing antidepressant responses demonstrate increased activation of this region in depression (41). This observation is among the most consistent findings associated with antidepressant response, leading to the hypothesis that change in this region is a “trait phenomenon” correlated with improvement in certain depression dimensions (42). The implications of acute dorsal anterior cingulate increases in rCBF are not yet clear. Similar to pharmacotherapy mechanism of action studies (41), these initial changes of VNS, especially given the long typical time lapse between initiation of VNS and response in TRMD, may represent a “transitory state” as the brain moves to a final response to sustained VNS.
Finally, there were no statistically significant correlations found in the post-hoc correlation of baseline immediate VNS-induced rCBF change and antidepressant change at 12 months. However, there were several regions including the putamen, right dorsal anterior cingulate cortex, and bilateral orbitofrontal cortex that demonstrated correlations which exceeded r = |.20|. It is noteworthy that these regions have previously been identified as important in VNS in TRMD (19,21,22) suggesting that with a higher-powered (larger N) study and greater immediate stimulation parameters, a statistically significant correlation of antidepressant change and acute, baseline rCBF activity change could perhaps be determined.
There are several limitations to this study. These include small sample size, low VNS parameter settings at scanning, the presence of concomitant psychotropic medications, not varying the order of the stimulation sequences, and limited spatial resolution of the PET scans. The small sample size limited statistical power. Because of the necessity of protecting the study blind of the dose finding study (described above), the pulse width and current of this study was exceptionally low. Based on previous findings we anticipate that a higher pulse width of 250 μsec or 500 μsec would markedly alter the activation and deactivation patterns. In particular, we suspect that a higher pulse width would have lead to a greater number of regional activations and deactivations. Mu et al. (21) examined the effects of varying VNS pulse widths (PW; 130 μsec, 250 μsec and 500 μsec) on brain activity in TRMD using BOLD fMRI. Their findings demonstrated that the lower PW (130 μsec) led to predominantly decreased regional activations; more regional activations predominated with increasing pulse widths (250 μsec, 500 μsec). Our findings suggest that this low level of stimulation (130 μsec) lead to equivalent distribution of activations and deactivations. Further, in contrast to Mu et al., in this sample immediate stimulation lead to decreased rCBF in bilateral OFC regions, whereas Mu et al found increased rCBF in the left OFC at 130 μsec and bilateral OFC at 500 μsec. Similarly Mu et al. found deactivations in the anterior cingulate cortex at 130 and 250 μsec, whereas we noted increased rCBF in the dorsal anterior cingulate. These disparities in activation/deactivation may reflect the markedly different VNS exposure times and the average intensity of stimulus. Mu et al were observing the effects of immediate VNS stimulation in TRMD subjects with prolonged prior VNS exposure (average 26.8 ± 12.4 months) with an average current of .80 mA ± .30 mA. The subjects in this trial were relatively VNS-naïve (average 4.5 days of VNS stimulation) and had been exposed to much lower current strengths (0.25mA). The “optimal” amount of current for an effective antidepressant response to VNS is not known; however, we have observed cases of TRMD patients responding to VNS parameters at this very low range (0.25mA and 130 μsec).
Subjects were being treated with psychotropic medications (Table 1S) leaving open the question of interactions between those therapies and VNS regarding observed rCBF changes (43,44), although the FDA indication for VNS in TRMD is as an augmentation agent. Additionally, we believe there is considerable potential dangerousness (worsening depression and emergence of suicidal ideation/intention) of taking TRMD patients off medications.
An additional limitation to this study was the spatial resolution of the identified regions of activation and deactivation. This likely explains rCBF changes identified in the regions of adjacent white matter in the observed findings. Several factors likely contributed to this including: individual differences in anatomy (blurring caused by registering all subjects to each other), slight movement during the scans and/or between scans, and imprecision introduced during image blurring during image processing. Finally, to decrease the potential for confounding brought about by subject awareness of the delivery order of “on” and “off” stimulations, as well as decreasing anxiety/novelty of the stimulus, a randomized ordering of “on” and “off” stimulation patterns would have been preferable.
Future research is needed to generalize these findings to larger TRMD samples and to determine whether VNS-induced brain changes are prospectively associated with VNS antidepressant response.
Supplementary Material
Acknowledgments
The authors thank JoAnn Filla-Taylor, Jon Christensen, Martha Cornell, Betsy Thomas, Lars Couture, and Avi Snyder for their invaluable assistance with this project. This work was supported by funding from the National Institute of Mental Health CRC K08 award (1K08MH078156-01A1) and YIS K24 award (9K24MH07951006), the National Institute of Neurological Disorders and Stroke P30NS048056, as well as funding from CRC’s National Alliance for Research in Schizophrenia and Affective Disorders (NARSAD) Young Investigators Award, and the Sidney R. Baer, Jr. Foundation.
Footnotes
Conflicts of Interest/Financial Disclosures
CRC has received grant funding for research from Cyberonics, the maker of the VNS device. He did not receive any funding from Cyberonics for this study. CRC is on the speaker’s bureau for Pfizer Pharmaceuticals, Merck, and Bristol-Myers Squibb. CRC is receiving research grant funding from Bristol-Myers Squibb. YIS is on the speaker’s bureau for Eli Lilly and Company. MAM is employed at Avid Radiopharmaceuticals. RDB receives royalty interest from Medtronics for licensing intellectual property in the manufacture of the StealthStation. JTC, JLB, and SG have no financial relationships to disclose.
Publisher's Disclaimer: This is a PDF file of an unedited manuscript that has been accepted for publication. As a service to our customers we are providing this early version of the manuscript. The manuscript will undergo copyediting, typesetting, and review of the resulting proof before it is published in its final citable form. Please note that during the production process errors may be discovered which could affect the content, and all legal disclaimers that apply to the journal pertain.
References
- 1.Rush AJ, Marangell LB, Sackeim HA, et al. Vagus nerve stimulation for treatment resistant depression: a randomized, controlled acute phase trial. Biol Psychiatry. 2005a;58(5):347–354. doi: 10.1016/j.biopsych.2005.05.025. [DOI] [PubMed] [Google Scholar]
- 2.Rush AJ, Sackeim HA, Marangell LB, et al. Effects of 12 months of vagus nerve stimulation in treatment- resistant depression: a naturalistic study. Biol Psychiatry. 2005b;58(3):355–363. doi: 10.1016/j.biopsych.2005.05.024. [DOI] [PubMed] [Google Scholar]
- 3.Marangell LB, Rush AJ, George MS, et al. Vagus nerve stimulation (VNS) for major depressive episodes: one year outcomes. Biol Psychiatry. 2002;51(4):280–287. doi: 10.1016/s0006-3223(01)01343-9. [DOI] [PubMed] [Google Scholar]
- 4.Nahas Z, Marangell LB, Husain MM, et al. Two-year outcome of vagus nerve stimulation (VNS) for treatment of major depressive episodes. J Clin Psychiatry. 2005;66(9):1097–1104. doi: 10.4088/jcp.v66n0902. [DOI] [PubMed] [Google Scholar]
- 5.Sackeim HA, Prudic J, Devanand DP, et al. The impact of medication resistance and continuation pharmacotherapy on relapse following response to electroconvulsive therapy in major depression. J Clin Psychopharmacol. 1990;10(2):96–104. doi: 10.1097/00004714-199004000-00004. [DOI] [PubMed] [Google Scholar]
- 6.Foley JO, DuBois F. Quantitative studies of the vagus nerve in the cat. I. The ratio of sensory and motor studies. J Comp Neurol. 1937;67(1):49–67. [Google Scholar]
- 7.Henry TR. Therapeutic mechanism of vagus nerve stimulation. Neurology. 2002;59 (Suppl 4):S3–S14. doi: 10.1212/wnl.59.6_suppl_4.s3. [DOI] [PubMed] [Google Scholar]
- 8.Beckstead RM, Norgren R. An autoradiographic examination of the central distribution of the trigeminal, facial, glossopharyngeal, and vagal nerves in the monkey. J Comp Neurol. 1979;184(3):455–472. doi: 10.1002/cne.901840303. [DOI] [PubMed] [Google Scholar]
- 9.Kalia M, Sullivan JM. Brainstem projections of sensory and motor components of the vagus nerve in the rat. J Comp Neurol. 1982;211(3):248–265. doi: 10.1002/cne.902110304. [DOI] [PubMed] [Google Scholar]
- 10.Rhoton AL, Jr, O'Leary JL, Ferguson JP. The trigeminal, facial, vagal, and glossopharyngeal nerves in the monkey. Afferent connections. Arch Neurol. 1966;14(5):530–540. doi: 10.1001/archneur.1966.00470110074010. [DOI] [PubMed] [Google Scholar]
- 11.Beckstead RM, Morse JR, Norgren R. The nucleus of the solitary tract in the monkey: projections to the thalamus and brain stem nuclei. J Comp Neurol. 1980;190(2):259–282. doi: 10.1002/cne.901900205. [DOI] [PubMed] [Google Scholar]
- 12.Rutecki P. Anatomical, physiological, and theoretical basis for the antiepileptic effect of vagus nerve stimulation. Epilepsia. 1990;31 (Suppl 2):S1–6. doi: 10.1111/j.1528-1157.1990.tb05843.x. [DOI] [PubMed] [Google Scholar]
- 13.Saper CB. Diffuse cortical projection systems: anatomical organization and role in cortical function. In: Plum F, editor. Handbook of physiology: the nervous system. V. Bethesda: American Physiological Society; 1987. pp. 169–210. [Google Scholar]
- 14.Bester H, Bourgeais L, Villanueva L, Besson JM, Bernard JF. Differential projections to the intralaminar and gustatory thalamus from the parabrachial area: a PHA-L study in the rat. J Comp Neurol. 1999;405(4):421–449. [PubMed] [Google Scholar]
- 15.Krout KE, Loewy AD. Parabrachial nucleus projections to midline and intralaminar thalamic nuclei of the rat. J Comp Neurol. 2000;428(3):475–494. doi: 10.1002/1096-9861(20001218)428:3<475::aid-cne6>3.0.co;2-9. [DOI] [PubMed] [Google Scholar]
- 16.Carmichael ST, Price JL. Sensory and premotor connections of the orbital and medial prefrontal cortex. J Comp Neurol. 1995;363(4):642–664. doi: 10.1002/cne.903630409. [DOI] [PubMed] [Google Scholar]
- 17.Saleem KS, Kondo, Price JL. Complementary circuits connecting the orbital and medial prefrontal networks with the temporal, insular, and opercular cortex in the macaque monkey. J Comp Neurol. 2008;506(4):659–693. doi: 10.1002/cne.21577. [DOI] [PubMed] [Google Scholar]
- 18.Ongür D, Price JL. The organization of networks within the orbital and medial prefrontal cortex of rats, monkeys and humans. Cereb Cortex. 2000;10(3):206–219. doi: 10.1093/cercor/10.3.206. [DOI] [PubMed] [Google Scholar]
- 19.Nahas Z, Teneback C, Chae J, et al. Serial vagus nerve stimulation functional MRI in treatment-resistant depression. Neuropsychopharmacology. 2007;32(8):1649–1660. doi: 10.1038/sj.npp.1301288. [DOI] [PubMed] [Google Scholar]
- 20.Price JL, Drevets WL. Neurocircuitry of mood disorders. Neuropsychopharmacology. 2010;35(1):192–216. doi: 10.1038/npp.2009.104. [DOI] [PMC free article] [PubMed] [Google Scholar]
- 21.Mu Q, Bohning DE, Nahas Z, et al. Acute vagus nerve stimulation using different pulse widths produces varying brain effects. Biol Psychiatry. 2004;55(8):816–825. doi: 10.1016/j.biopsych.2003.12.004. [DOI] [PubMed] [Google Scholar]
- 22.Conway CR, Sheline YI, Chibnall JT, et al. Cerebral blood flow changes during vagus nerve stimulation for depression. Psych Res: Neuroimage. 2006;146(2):179–184. doi: 10.1016/j.pscychresns.2005.12.007. [DOI] [PubMed] [Google Scholar]
- 23.Pardo JV, Sheikh SA, Schwindt GC, et al. Chronic vagus nerve stimulation for treatment-resistant depression decreases ventromedial prefrontal glucose metabolism. Neuroimage. 2008;42(2):879–889. doi: 10.1016/j.neuroimage.2008.04.267. [DOI] [PMC free article] [PubMed] [Google Scholar]
- 24.Zobel A, Joe A, Freymann N, et al. Changes in regional cerebral blood flow by therapeutic vagus nerve stimulation in depression: an exploratory approach. Psychiatry Res. 2005;139(3):165–179. doi: 10.1016/j.pscychresns.2005.02.010. [DOI] [PubMed] [Google Scholar]
- 25.Lomarev M, Denslow S, Nahas Z, et al. Vagus nerve stimulation (VNS) synchronized BOLD fMRI suggests that VNS in depressed adults has frequency/dose dependent effects. J Psychiatry Res. 2002;36(4):219–227. doi: 10.1016/s0022-3956(02)00013-4. [DOI] [PubMed] [Google Scholar]
- 26.First MB, Spitzer RL, Gibbon M, Williams JBW. Structured Clinical Interview for DSM-IV Axis I Disorders, Patient Edition (SCID-CV). Version 2. New York: New York State Psychiatric Institute, Biometrics Research; 1995. [Google Scholar]
- 27.Prudic J, Sackeim HA, Devanand DP. Medication resistance and clinical response to electroconvulsive therapy. Psychiatry Res. 1990;31(3):287–296. doi: 10.1016/0165-1781(90)90098-p. [DOI] [PubMed] [Google Scholar]
- 28.Prudic J, Haskett RF, Mulsant B, et al. Resistance to antidepressant medications and short-term clinical response to ECT. Am J Psychiatry. 1996;153(8):985–992. doi: 10.1176/ajp.153.8.985. [DOI] [PubMed] [Google Scholar]
- 29.Sackeim HA. The definition and meaning of treatment-resistant depression. J Clin Psychiatry. 2001;62(Suppl 16):10–7. Review. [PubMed] [Google Scholar]
- 30.Hamilton M. Development of a rating scale for primary depressive illness. Br J Soc Clin Psychol. 1967;6(4):278–296. doi: 10.1111/j.2044-8260.1967.tb00530.x. [DOI] [PubMed] [Google Scholar]
- 31.Montgomery SA, Asberg M. A new depression scale designed to be sensitive to change. Br J Psychiatry. 1979;134:382–389. doi: 10.1192/bjp.134.4.382. [DOI] [PubMed] [Google Scholar]
- 32.Rush AJ, Gullion CM, Basco MR, Jarrett RB, Trivedi MH. The inventory of depressive symptomatology (IDS): psychometric properties. Psychol Med. 1996;26(3):477–486. doi: 10.1017/s0033291700035558. [DOI] [PubMed] [Google Scholar]
- 33.Young RC, Biggs JT, Ziegler VE, Meyer DA. A rating scale for mania: reliability, validity and sensitivity. Br J Psychiatry. 1978;133:429–435. doi: 10.1192/bjp.133.5.429. [DOI] [PubMed] [Google Scholar]
- 34.Snyder AZ. Difference image versus ratio image error functions in PET realignment. In: Myer R, Cunningham VJ, Bailey DL, Jones T, editors. Quantification of brain function using PET. San Diego: Academic; 1996. pp. 131–137. [Google Scholar]
- 35.Woods RP, Cherry SR, Mazziotta JC. Rapid automated algorithm for aligning and reslicing PET images. J Comput Assist Tomogr. 1992;16(4):620–633. doi: 10.1097/00004728-199207000-00024. [DOI] [PubMed] [Google Scholar]
- 36.Talairach J, Tournoux P. Co-Planar Stereotaxic Atlas of the Human Brain. Thieme; New York: 1988. [Google Scholar]
- 37.Woods RP, Grafton ST, Watson JD, Sicotte NL, Mazziotta JC. Automated image registration: II. Intersubject validation of linear and nonlinear models. J Comput Assist Tomogr. 1998;22(1):153–165. doi: 10.1097/00004728-199801000-00028. [DOI] [PubMed] [Google Scholar]
- 38.Henry TR, Bakay RAE, Votaw JR, et al. Brain blood flow alterations induced by therapeutic vagus nerve stimulation in partial epilepsy: I. acute effects at high and low levels of stimulation. Epilepsia. 1998;39(9):983–990. doi: 10.1111/j.1528-1157.1998.tb01448.x. [DOI] [PubMed] [Google Scholar]
- 39.Elliott R, Dolan RJ, Frith CD. Dissociable functions in the medial and lateral orbitofrontal cortex: evidence from human neuroimaging studies. Cereb Cortex. 2000;10(3):308–317. doi: 10.1093/cercor/10.3.308. [DOI] [PubMed] [Google Scholar]
- 40.Drevets WC. Prefrontal cortical-amygdalar metabolism in major depression. Ann NY Acad Sci. 1999;877:614–637. doi: 10.1111/j.1749-6632.1999.tb09292.x. [DOI] [PubMed] [Google Scholar]
- 41.Mayberg HS, Brannan SK, Tekell JL, et al. Regional metabolic effects of fluoxetine in major depression: serial changes and relationship to clinical response. Biol Psychiatry. 2000;48(8):830–843. doi: 10.1016/s0006-3223(00)01036-2. [DOI] [PubMed] [Google Scholar]
- 42.Kennedy SH, Evans KR, Kruger S, et al. Changes in regional brain glucose metabolism with positron emission tomography after paroxetine treatment of major depression. Am J Psychiatry. 2001;158(6):899–905. doi: 10.1176/appi.ajp.158.6.899. [DOI] [PubMed] [Google Scholar]
- 43.Silfverskiöld P, Risberg J. Regional cerebral blood flow in depression and mania. Arch Gen Psychiatry. 1989;46(3):253–259. doi: 10.1001/archpsyc.1989.01810030059008. [DOI] [PubMed] [Google Scholar]
- 44.Lesser IM, Mena I, Boone KB, et al. Reduction of cerebral blood flow in older depressed patients. Arch Gen Psychiatry. 1994;51(9):677–686. doi: 10.1001/archpsyc.1994.03950090009002. [DOI] [PubMed] [Google Scholar]
Associated Data
This section collects any data citations, data availability statements, or supplementary materials included in this article.