Abstract
Accurate measures of liver fat content are essential for investigating the role of hepatic steatosis in the pathophysiology of multiple metabolic disorders. No traditional imaging methods can accurately quantify liver fat content. [1H]-magnetic resonance spectroscopy (MRS) is restricted in large-scale studies because of the practical and technological issues. Previous attempts on computer-aided ultrasound quantification of liver fat content varied in method, and the ultrasound quantitative parameters measured from different ultrasound machines were hardly comparable. We aimed to establish and validate a simple and propagable method for quantitative assessment of liver fat content based on the combination of standardized ultrasound quantitative parameters, using [1H]-MRS as gold standard. Totally 127 participants were examined with both ultrasonography (US) and [1H]-MRS. Ultrasound hepatic/renal echo-intensity ratio (H/R) and ultrasound hepatic echo-intensity attenuation rate (HA) were obtained from ordinary ultrasound images using computer program. Both parameters were standardized using a tissue-mimicking phantom before analysis. Standardized ultrasound H/R and HA were positively correlated with the liver fat content by [1H]-MRS (r = 0.884, P < 0.001 and r = 0.711, P < 0.001, respectively). Linear regression analysis showed ultrasound H/R could modestly predict the amount of liver fat (adjusted explained variance 78.0%, P < 0.001). The addition of ultrasound HA slightly improved the adjusted explained variance to 79.8%. Difference of estimated liver fat contents between different ultrasound machines and operators was reasonably well. Thus, computer-aided US is a valid method to estimate liver fat content and can be applied extensively after standardization of ultrasound quantitative parameters.
Introduction
Nonalcoholic fatty liver disease (NAFLD) is rapidly becoming the most common liver disease worldwide (1). The prevalence of NAFLD in the general population is estimated to be 20–30% in western countries (2,3) and 15% in Asian countries (4,5). Though the prevalence is partly depended on the method used to diagnose NAFLD, NAFLD has been undoubtedly an important global disease burden not only for its high and fast increasing prevalence, but also for its severe metabolic complications. NAFLD associates with insulin resistance, obesity, hypertension, type 2 diabetes mellitus (T2DM), hyperlipidemia (6,7) and may precede T2DM development and cardiovascular disease (CVD (8)). Recently, carotid atherosclerosis has been detected in patients with NAFLD even with no alterations in liver enzyme tests (9). Thus, an accurate assessment of hepatic fat infiltration would have profound significance in the clinical setting.
Liver biopsy is the “gold” standard for quantification of hepatic steatosis. However, it is hard to be accepted by most patients for its invasiveness and a significant degree of sampling error (10). Moreover, most patients with hepatic steatosis are asymptomatic (11), and only 50% of patients with NAFLD (12) will have elevated alanine transaminases. Therefore, an accurate, cost-effective and noninvasive imaging method that can quantitatively measure liver fat content is ideally needed.
[1H]-magnetic resonance spectroscopy (MRS) directly measures protons in acyl groups of liver tissue triglycerides (13), and the values obtained using [1H]-MRS correlate well with the histological liver fat content (14,15,16), which provides an accurate, sensitive, and noninvasive method to quantify liver fat content. Our previous study also showed a close positive correlation between the hepatic triglyceride content by [1H]-MRS and pathological measurements of liver fat content (r = 0.878, P < 0.0001 (17)). The “upper limit of normal” for hepatic triglyceride content by [1H]-MRS was determined to be 5.56% in the Dallas Heart Study (18). However, [1H]-MRS is expensive and far less available than other imaging examinations, which limits its use in clinical practice and large-scale epidemiological studies.
Ultrasonography (US) is an appealing technique to detect fatty infiltration of the liver because of its simplicity, low-cost, noninvasive nature, and widespread availability. However, its application is limited by the interobserver and intraobserver variability (19), poor sensitivity in detecting mild hepatic steatosis (20), and ultimately it is unable to provide an accurate measurement of liver fat content. Recently several attempts have been made to establish methods for quantitative assessment of liver fat content by US. Edens et al. showed the feasibility of ultrasound liver fat content quantification by using a combination of computer-assisted ultrasound measures from routine ultrasound images (21). However, these ultrasound parameters were obtained with specially developed software program and somewhat complex for practical clinical application. Meanwhile, studies by Webb et al. (22) and Mancini et al. (23) reported that computer-aided measurement of US hepatic/renal echo-intensity ratio (H/R) were highly correlated with liver fat content determined by histology and [1H]-MRS, respectively. These two studies indicated US hepatic/renal ratio as a suitable quantitative parameter to quantitatively reflect liver fat content, but the value ranges of the US H/R ratios from the two studies differed greatly, which were totally not comparable. Thus, standardization of the US H/R ratio is necessary before its widespread clinical application. In addition, one recent pilot study also attempted to use phantom-calibrated, computer-measured ultrasound hepatic attenuation coefficients to assess the severity of hepatic steatosis in dairy cattles (24). However, none of these studies has clearly provided a relative accurate, stable, and reproducible US quantitative method for liver fat content yet.
In this study, we improved the method for US H/R ratio and US hepatic echo-intensity attenuation rate (HA) measurement by introducing a tissue-mimicking phantom for standardization to make them more comparable among different ultrasound machines. Furthermore, we also attempted to establish and validate a predictive algorithm for liver fat content with standardized US H/R and HA, using [1H]-MRS as standard.
Methods and Procedures
Subjects
US and [1H]-MRS examinations were performed in 127 participants (age range, 16–75 years; BMI range, 18.2–37.7 kg/m2) who were diagnosed with no or different degrees of hepatic steatosis by routine US examinations from the outpatient department of endocrinology and physical examination center of Zhongshan Hospital, Shanghai, China. Of the 127 participants, 35 were diagnosed with no hepatic steatosis, 64 with mild hepatic steatosis, and 28 with moderate or severe hepatic steatosis. The participants did not have a history, clinical symptoms, or signs of other liver or renal disease; nor did they have history of diabetes or excess alcoholic drinking (≥20 g/day for men and ≥10 g/day for women (25)). They were not taking hypolipidemic drug, liver protectant, or drugs that could cause steatosis. All participants had negative hepatitis B virus surface antigen and hepatitis C virus antibody, normal renal function, and absence of proteinuria in spot urine collection.
The protocol for the study was approved by the ethics committee of Zhongshan Hospital, Shanghai. Written informed consent was obtained from all participants.
Anthropometric, ultrasound, and [1H]-MRS measurements were performed at the same day, and fasting venous blood samples were drawn for determination of blood routine, liver and renal function, and hepatitis virus indication.
Anthropometric measurements
The measurement of height and weight required the subjects wore light clothing without shoes. Body mass index was calculated as weight (kg) divided by height (m) squared. Waist circumference was measured with a soft tape on standing subjects midway between the lowest rib and the iliac crest. Hip circumference was assessed at the level of the greater trochanters. Blood pressure was measured on right arm with subjects in a sitting position after a 5-min rest.
Biochemical analysis
Biochemical tests for liver enzymes, serum lipid profile, and fasting plasma glucose were performed using an autoanalyzer (Hitachi 7300, automatic analyzer, Tokyo, Japan). Serum hepatitis B virus surface antigen and hepatitis C virus antibody were tested by the Enhanced Electrochemiluminescence method.
US
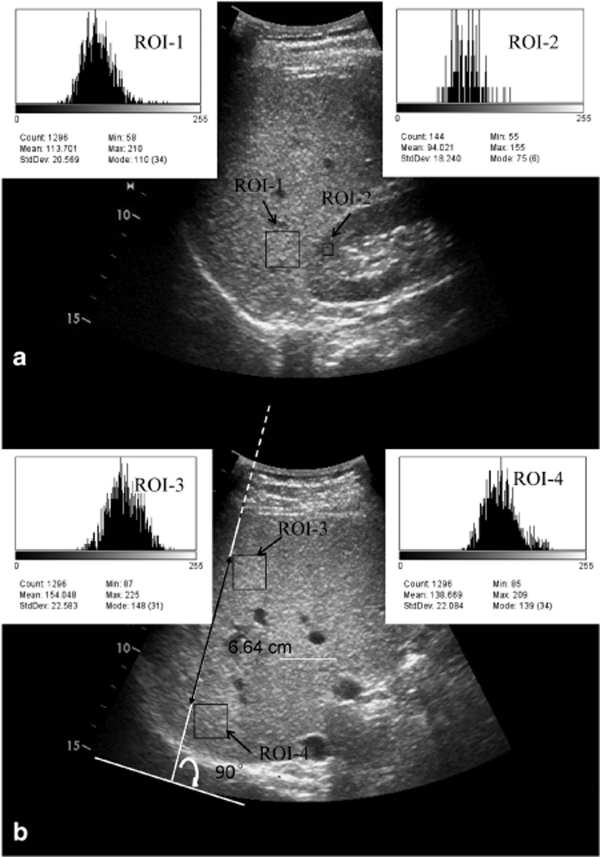
All examinations were performed with a GE Vivid7 ultrasound machine (GE Healthcare, Horten, Norway) equipped with a GE 4C curved array transducer (GE H4904PC). Twenty-six of the subjects also accepted a second US examination within 12 h on another GE Logiq P5 ultrasound machine (GE Healthcare, Milwaukee, WI). US studies were performed by two experienced radiologists (WH and CL) who were unaware of the patient's clinical details and laboratory findings. All the instrument settings, including “gain,” “depth,” and “time-gain compensation,” were fixed for each measurement. For assessment of US H/R ratio, ultrasound images with both liver and right kidney clearly visualized were obtained in the sagittal liver/right kidney view in the lateral position (Figure 1a). US hepatic echo-intensity attenuation rate was assessed in right intercostals view at anterior axilla line in the supine position (Figure 1b).
Figure 1.
Ultrasound images of liver in (a) sagittal liver/right kidney view and (b) right intercostals view in a 53-year-old man show graphic representation of region of interest (ROI) rectangles. ROI-1, ROI-2, ROI-3, and ROI-4 show the gray scale distribution of the pixels in the selected liver, right kidney cortex, liver near-field, and liver far-field region, respectively. The linear distance between the top left corners of near-field and far-field liver ROIs was also measured.
Ultrasound image analysis
All images were transferred to a personal computer and reviewed by one of the two radiologists involved in scanning. Analysis of digitized ultrasound images was performed by using NIHimage software (ImageJ 1.41o, National Institutes of Health, Bethesda, MD).
US hepatic/renal echo-intensity ratio
In sagittal liver/right kidney view, a region of interest (ROI) of 1.5 × 1.5 cm (1,296 pixels) in the liver parenchyma was selected. The ROI had to be as uniform as possible, excluding blood vessels, bile ducts, and other focal hypo/hyperechogenicity. Another ROI of 0.5 × 0.5 cm (144 pixels) was identified in the right renal cortex with no large vessels, renal sinus or medulla. To avoid the interference of depth-depended echo-intensity attenuation and the borderline echo distorting effects, the boundary between liver and right kidney area should be placed near the center of the image, and the liver and right kidney ROIs were selected at the same depth of the ultrasound images. The gray scale mean value of the pixels within the two ROIs was used as measurement of echo intensity (Figure 1a). Then we divided the average hepatic gray scale by the average renal cortex gray scale to calculate the US hepatic/renal ratio.
US hepatic echo-intensity attenuation rate
In right intercostals view at anterior axilla line, a tangent line of the sector ultrasound image was drawn and the ultrasound wave transmission line was determined, starting from the point of tangency and perpendicular to the tangent line. Two ROIs of 1.5 × 1.5 cm (1,296 pixels) were selected in liver homogeneous regions along the ultrasound transmission line near the liver anterior margin (depth 4–6 cm) and the liver posterior margin, respectively. The linear distance between the two ROIs was also measured (Figure 1b).
The echo intensity of ultrasound wave was attenuated exponentially, shown as the following equation (26,27):
Where A0 and Ad are ultrasound echo intensity at the sound source and the liver parenchyma at a specific depth, respectively; a is the attenuation coefficient of the liver parenchyma; f is the frequency of the ultrasound detector; d is the depth of ROI.
The ratio of the average echo intensity in the liver near-field ROI to liver far-field ROI was then calculated based on equation (1):
 |
Where An and Af are average ultrasound echo intensity in the near-field ROI and the far-field ROI, respectively; a and f have been defined in equation (1); dn and df are the depth of liver near-field and far-field ROIs.
Then the formula for ultrasound hepatic echo-intensity attenuation rate was deduced from equation (2):
Where Δd is the distance between the near-field and far-field ROIs, and other parameters are defined in equation (2).
Standardization of ultrasound quantitative parameters
To standardize the measured values of US H/R ratio and hepatic echo-intensity attenuation rate among different ultrasound machines, a 3D abdominal phantom (Model 057; Computerized Imaging Reference Systems, Norfolk, VA), containing mimic abdominal organs, was used for standardization in this research. The ultrasound images of the phantom were obtained under both of the ultrasound machines (GE Vivid7 and GE Logiq P5), and the phantom's H/R ratio and hepatic attenuation rate were measured with the same protocol for ultrasound image analysis described above. Then we divided the measured ultrasound H/R ratios by the phantom's H/R ratio and subtracted the phantom's hepatic attenuation rate from the patients' hepatic attenuation rates to obtain the standardized US H/R ratio and standardized hepatic attenuation rate (Supplementary Figure S1 online).
Validation of ultrasound quantification of liver fat content
To assess the agreement in measuring standardized US H/R and hepatic attenuation rate between different operators and different ultrasound machines, 26 participants accepted US examinations on two different ultrasound machines (GE Vivid7 and GE Logiq P5) by the same radiologist within 12 h, and 23 participants were examined separately by two radiologists within 12 h.
Measurement of hepatic triglyceride content using [1H]-MRS
[1H]-MRS measurements were performed on a 1.5-T magnetic resonance (MR) scanner (Siemens Avanto, Erlangen, Germany) equipped for proton spectroscopy acquisitions. Sagittal, coronal, and axial slices covering the whole liver were preliminarily acquired for positioning of the spectroscopy acquisition voxel. A single voxel of 8 cm3 (2 × 2 × 2 cm) was placed within the right lobe avoiding major vascular structures and subcutaneous fat tissue. The proton spectrum was acquired using the body coil after shimming over the volume of interest by means of a point-resolved spectroscopy (PRESS) sequence with the following parameters: repetition time = 1,500 ms, echo time = 135 ms. Signal intensities of water peak at 4.8 ppm (Sw) and the fat peak at 1.4 ppm(Sf) were measured, and hepatic fat percentage was calculated using the formula 100 × Sf/(Sf + Sw), as described by our group previously (28).
Statistical analysis
All statistical analyses were performed using SPSS software version 13.0 (SPSS, Chicago, IL). The data are presented as mean ± s.d. except for skewed variables, which are presented as median (interquartile range 25–75%). One-way ANOVA was used for comparisons among groups. Multivariate linear stepwise regression analysis was used to establish predictive algorithm for liver fat content with the ultrasonic quantitative parameters, using [1H]-MRS as standard. Receiver operating characteristic curve analysis was used to determine the appropriate cutoff value for ultrasound-estimated liver fat content to diagnose NAFLD. The optimal cutoff values were obtained from the Youden index (maximum (sensitivity + specificity − 1 (29))). Pearson's correlation analysis was used to explore the association of ultrasound liver fat content with all measured metabolism-related parameters. Interobserver variation, as well as the variation between different ultrasound machines, was assessed using intraclass correlation (ICC) coefficient and Bland–Altman statistics (30). Values for P < 0.05 were considered statistically significant for all analyses.
Results
Study population
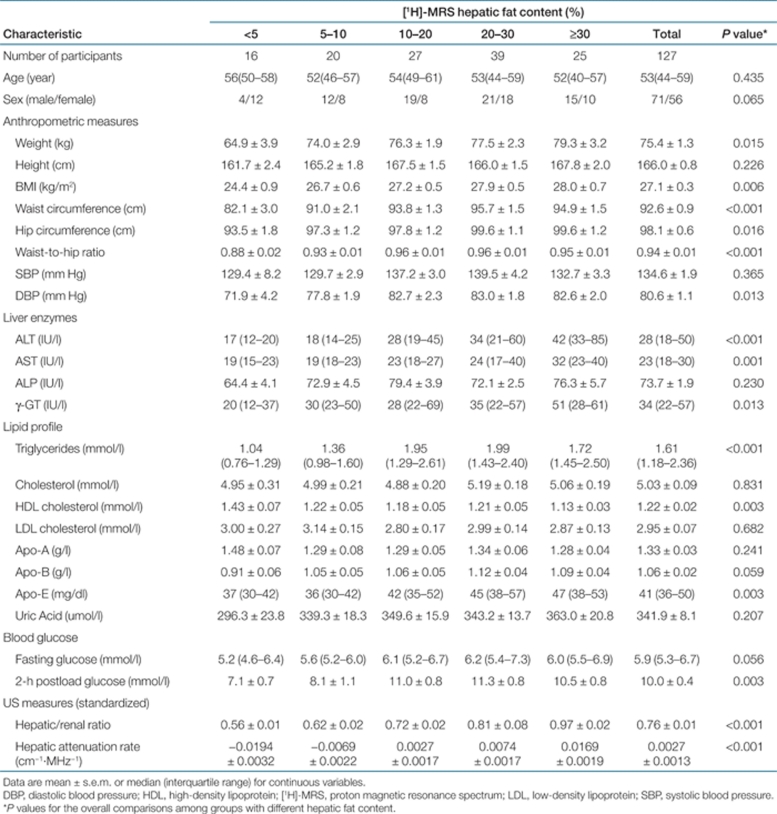
The study population consisted of 71 men and 56 women, with an age range of 16–75 year, BMI of 18.2–37.7 kg/m2, and waist-to-hip ratio of 0.78–1.12. Liver fat content determined by [1H]-MRS analysis ranged from 3.0 to 70.9% (mean 20.2%). By application of the current criteria for diagnosis of steatosis by [1H]-MRS, 81.1% of the subjects (103/127) had a liver fat content exceeding 5.56%. The original ultrasound hepatic/renal ratios and hepatic echo-intensity attenuation rates were 0.88–2.17 (mean 1.39) and −0.0289/MHz/cm–0.0475/MHz/cm (mean 0.0146/MHz/cm), respectively. After standardization, the hepatic/renal ratios were adjusted to be 0.48–1.19, and the adjusted hepatic echo-intensity attenuation rates ranged from −0.0409 to 0.0355/MHz/cm (Table 1).
Table 1. Characteristics of the study patients.
Estimation of liver fat content by [1H]-MRS using US quantitative parameters
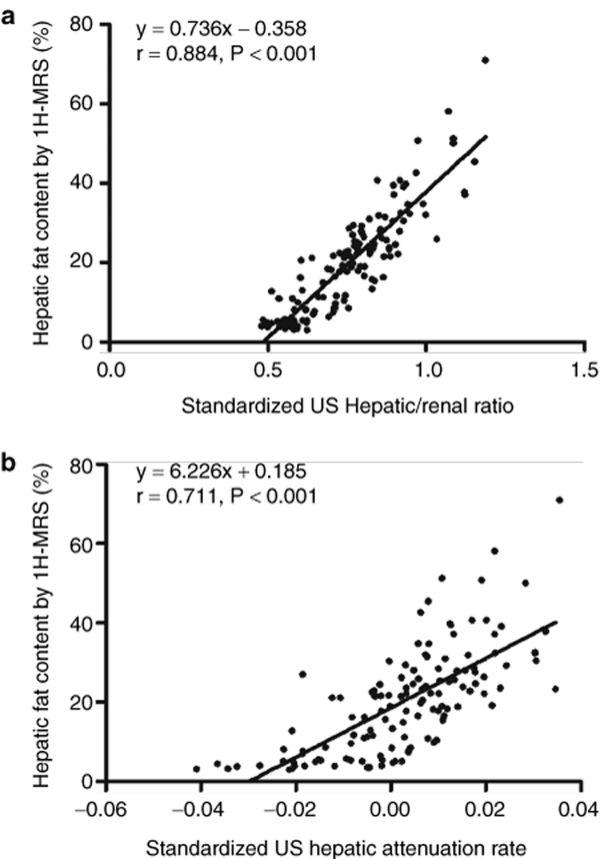
Both US hepatic/renal ratio and US hepatic attenuation rate were highly positively associated with the liver fat content by [1H]-MRS, with r = 0.884, (P < 0.001) and r = 0.711, (P < 0.001), respectively (Figure 2a,b). Multivariate linear regression analysis was performed to investigate main factors associated with liver fat content from all common anthropometric and US quantitative parameters. The greatest contribution to the prediction of liver fat content came from the US H/R ratio, and it could be used independently to calculate liver fat content (adjusted explained variance to 78.0%, P < 0.001). (Model 1, Table 2). The addition of US hepatic attenuation rate to the US hepatic/renal ratio further improved the explained variance in liver fat content from 78.0 to 79.8%. This was reflected in the 4.2% reduction in root mean squared error. (Model 2, Table 2). The algorithm derived from the second predictive model was as follows:
Figure 2.
(a) Linear correlation between liver fat contents by [1H]-MRS and (a) US hepatic/renal ratio (r = 0.884, P < 0.001) and (b) US hepatic attenuation rate (r = 0.711, P < 0.001).
Table 2. Prediction models for hepatic fat content by [1H]-MRS using anthropometric and ultrasound quantitative parametersa.
Liver fat content (%) = 62.592 × US hepatic/renal ratio + 168.076 × US hepatic attenuation rate − 27.863
Quantitative vs. qualitative US
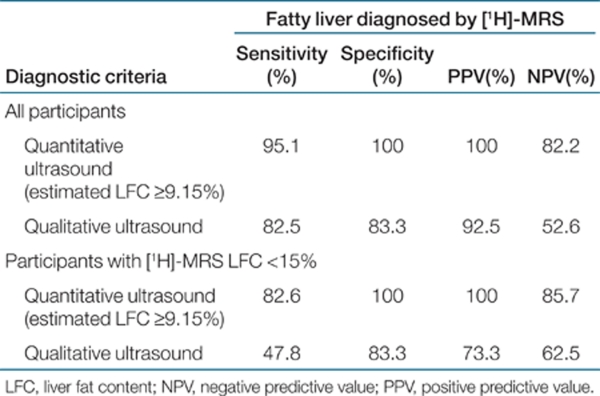
Validity of the above ultrasound quantitative algorithm, in comparison with a qualitative US method used in clinical care, is shown in Table 3. Patients with liver fat content measured by [1H]-MRS of at least 5.56% were diagnosed as hepatic steatosis. Receiver operating characteristic curve analysis showed that the optimal cutoff value for ultrasound-estimated liver fat content to diagnose hepatic steatosis was 9.15%. Using cutoff value of 9.15%, the sensitivity and specificity for quantitative US to diagnose hepatic steatosis were 95.1% and 100%, respectively, better than the qualitative US, whose sensitivity and specificity were 82.5 and 83.3%, respectively. In the 63 subjects with liver fat content by [1H]-MRS less than 15%, the quantitative US also yielded very high sensitivity (82.6%) and specificity (100%), but the sensitivity and specificity of traditional US were only 47.8 and 83.3%, respectively (Table 3).
Table 3. Comparison of diagnostic performance between quantitative and qualitative ultrasound examinations.
Correlation between ultrasound-estimated liver fat content and all other metabolism-related parameters
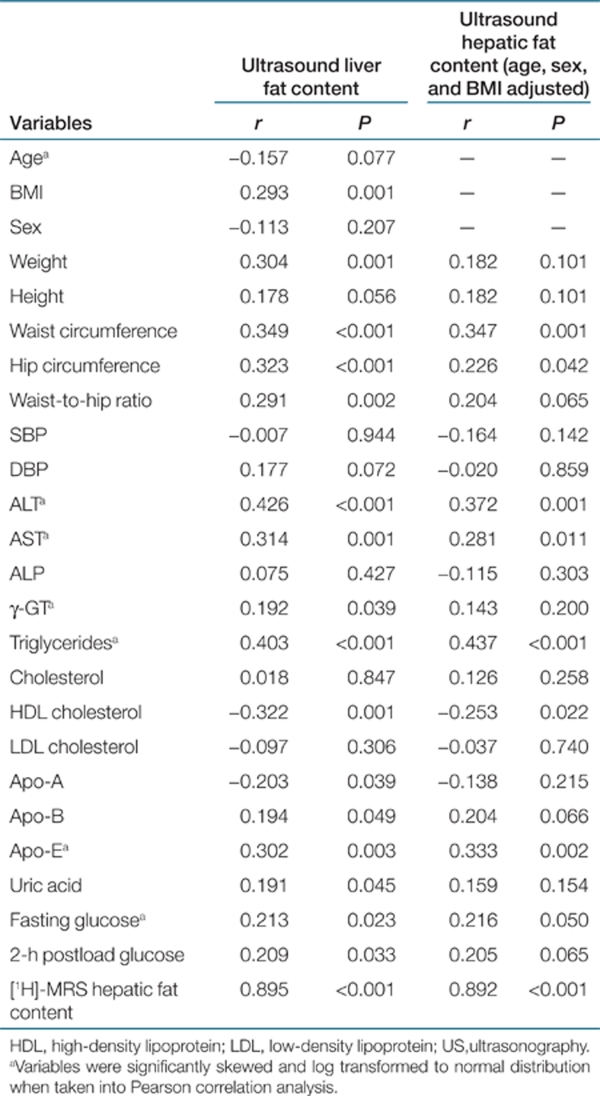
The Pearson correlation coefficients between ultrasound-estimated liver fat content and other common anthropometric and biochemical parameters are given in Table 4. After adjustment for age, sex, and BMI, liver fat content estimated by ultrasound was positively associated with waist circumference, hip circumference, serum ALT, AST, triglycerides, Apo-E, and fasting glucose levels and negatively associated with high-density lipoprotein cholesterol (HDL-C) levels.
Table 4. Correlation of hepatic fat content by improved US with anthropometric, biochemical, and ultrasonic parameters in 127 subjects.
Reliability
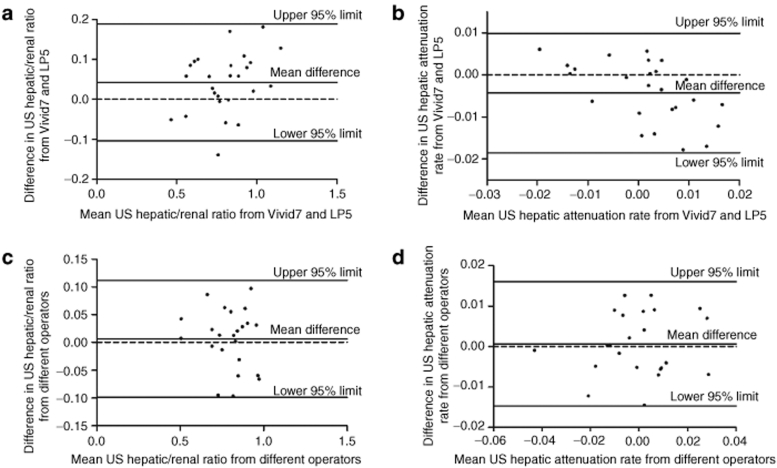
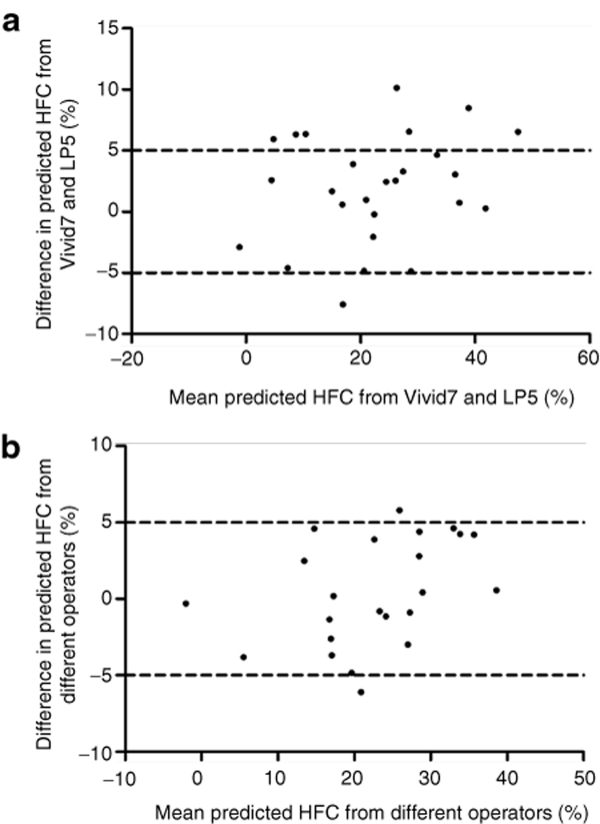
There is “excellent” interobserver agreement for US hepatic/renal ratio and US hepatic attenuation rate (ICC = 0.956 and ICC = 0.942, respectively). “Excellent” agreement between different ultrasound machines was also obtained for US hepatic/renal ratio and US hepatic attenuation rate (ICC = 0.950 and ICC = 0.861, respectively). Bland and Altman analysis suggested that if 95% of the difference were within the “limits of agreement” then this denoted good agreement between the two sets of measurements (Figure 3). According to the Bland–Altman method, the 95% limits of interobserver difference of US hepatic/renal ratio and US attenuation rate were −0.0989–0.1118 (−13.9–15.7% of total US hepatic/renal ratio range) and −0.0147–0.0161/cm/MHz (−19.2–21.1% of total US hepatic attenuation rate range), respectively. The 95% limits of difference between different US machines were −0.1041–0.1878 (−14.7–26.5% of range) for US hepatic/renal ratio, and −0.0185–0.0100/cm/MHz (−24.2–13.1% of range) for US attenuation rate, respectively. If we tolerate a difference smaller than 5% for liver fat content estimation, as shown by the interrupted lines in Figure 4, 21 (91.3%) and 18 (69.2%) patients would have the difference of calculated liver fat contents from different operators or different US machines within the range of ± 5% liver fat content (Figure 4).
Figure 3.
Bland–Altman analysis for agreement of US quantitative parameters between measurements with different ultrasound machines (a,b) and by different operators (c,d). (a) measurement of US hepatic/renal ratio from GE Vivid7 US machine minus measurement from GE Logiq P5 US machine; (b) measurement of US hepatic attenuation rate from GE Vivid7 US machine minus measurement from GE Logiq P5 machine; (c) measurement of US hepatic/renal ratio by operator 1 minus measurement by operator 2; and (d) measurement of US hepatic attenuation rate by operator 1 minus measurement by operator 2. LP5, Logiq P5.
Figure 4.
Bland–Altman analysis for agreement of liver fat content estimated with US quantitative parameters measured from (a) different ultrasound machines and (b) different operators. In a, 18 of 26 (69.2%) points fall within the range of ± 5% liver fat content; in b, 21 of 23 (91.3%) points fall within the range of ± 5% liver fat content.
Discussion
In this study, we found that computer-assisted US hepatic/renal ratio and US hepatic attenuation rate from ordinary US hepatic and right kidney images were highly positively associated with liver fat content by [1H]-MRS. Combination of US hepatic/renal ratio and US hepatic attenuation rate could be used to simply and relative accurately estimate liver fat content, and our improved US quantitative method also showed higher sensitivity than traditional US qualitative method in detecting mild hepatic steatosis. As for the reliability of our improved US quantitative method for liver fat content, the reproducibility between different operators and different US machines was reasonably well after standardization by a tissue-mimicking phantom, as the difference of the US-estimated liver fat content between different operators and different ultrasound machines mostly fell in the range of ± 5% liver fat content.
Hepatic steatosis can be assessed by some characteristics on ultrasound images, including (i) hyperechogenity of liver tissue (“bright liver”) as often compared to hypoechogenity of the kidney cortex, (ii) fall of echo amplitude with depth (posterior beam attenuation), (iii) fine, tightly packed echoes, (iv) loss of echoes from the walls of the portal veins (20). However, these criteria are qualitative, so the traditional US diagnosis of hepatic steatosis was highly depended on the subjective interpretation of the examiner, which can lead to limitation of the method reproducibility, and not least to diagnostic errors. In contrast, the computer-aided measurement of US H/R ratio and US hepatic echo-intensity attenuation rate realized the objective quantification of US image characteristics of hepatic steatosis and showed enormous advantages over traditional qualitative US. Using the ultrasound quantitative parameters, we were able to identify the minimal “bright liver echo” changes on ultrasound images, which were impossible to distinguish by naked eyes. Thus, the low sensitivity of traditional US to detect mild steatosis (20) could be remarkably resolved by the US quantitative method, and in the current study we also confirmed the high sensitivity and specificity of US quantitative method in diagnosing mild hepatic steatosis. On the other hand, the ultrasound quantitative method is objective and less dependent on operators' subjective impression, so it could overcome the subjective error of US examination results to a certain degree. The mean inter- and intraobserver agreement rates for traditional US diagnosis of hepatic steatosis were 72% and 76% (19). In comparison, the interobserver difference of US-quantified liver fat content in our current study is about ± 5% liver fat content, which corresponds to 95.6% agreement rates for the qualitative diagnosis of hepatic steatosis. More importantly, our US quantitative method formulates a relative accurate quantification of the liver fat content, radically changes the qualitative nature of traditional US, and provides an ideal tool for quantification of liver fat content in large-scale clinical studies and determination of treatment efficacy for hepatic steatosis. Therefore, the ultrasound quantitative method for liver fat content based on the combination of US quantitative parameters might be clinically valuable as an easy and relative accurate method to diagnose hepatic steatosis.
On the basis of the previous attempts on ultrasound quantification of liver fat content (22,23,24), we further improved the US quantitative method by taking the difference among different ultrasound machines into consideration and introduced a standardization procedure for the US image analysis. It is noticeable that the original US quantitative parameters measured with different ultrasound machines might vary tremendously. The original hepatic/renal ratio ranged from 0.88 to 2.17 (mean 1.39) in our study, while the US hepatic/renal ratios reported previously were 1.1–10.8 (mean 2.5 (23)) and 0.88–3.78 (mean 1.65 (22)), respectively. The great discrepancy might be caused by the different postprocess when ultrasound scanner automatically translates echo amplitude values to the brightness on the US images. Different US machines have different forms of adaptive contrast or texture enhancement (31,32), so the initial US quantitative parameters from different US machines vary greatly, and this badly restricts its practicality and application forecast. To adjust for the difference among ultrasound devices, we introduced a tissue-mimicking phantom for standardization in the current study, and the standardization procedure remarkably improved the comparability of US quantitative parameters among different US machines and increased the application and extension value of the ultrasound quantitative method for liver fat content.
Our study also showed that the optimal US-estimated liver fat content cutoff of 9.15% yielded very high sensitivity (95.1%) and specificity (100%), enabling us to attain good positive predictive value (PPV) and negative predictive value (NPV) (100% and 82.2%, respectively) for the diagnosis of hepatic steatosis. Noticeably, the cutoff value for US-estimated liver fat content to diagnose hepatic steatosis is higher than that of [1H]-MRS. This result was explicable if we noticed that the liver fat content estimated by US was actually not strictly linearly related to [1H]-MRS liver fat content. When liver fat content by [1H]-MRS was between 5% and 40%, the US-estimated liver fat content agreed well with the liver fat content by [1H]-MRS. However, when the liver fat content by [1H]-MRS decreased approximately below 5%, the US-estimated liver fat content showed a steep decline from 5%–10% to 0%, and when the liver fat content increased over 40%, the US-estimated liver fat content tended to reach a platform. Therefore, the US hepatic fat quantification method might slightly overestimate real liver fat content when the liver fat content is near 5%, and the US-estimated liver fat content cutoff value for hepatic steatosis was also higher than that of [1H]-MRS correspondingly (Supplementary Figure S2 online). Even though it was still an approximate estimation of liver fat content, the US quantitative method is undoubtedly an advance in imaging diagnosis of hepatic steatosis. Because the US quantitative method is easy for operation, sensitive in detection of mild hepatic steatosis, and relatively accurate in reflecting the severity of hepatic steatosis, it is especially suitable for large-scale quantitative study on hepatic steatosis and clinical trials on the follow-up and determination of treatment efficacy for hepatic steatosis.
One limitation of our study is that spectroscopy, rather than histologic examination, was used as the reference. Pathologic examination of biopsied specimens from the liver remains the criterion standard in current clinical practice to establish the diagnosis of steatosis. However, liver biopsy is an invasive procedure with a morbidity rate of 3% and a mortality rate of 0.03% (33). It has been demonstrated that histology correlates well with [1H]-MRS hepatic triglyceride content (15). Several clinical trials (34,35) on NAFLD have used spectroscopic magnetic resonance as an outcome measure. Therefore, spectroscopy may be a more appropriate reference standard than histology in accurately assessing fat content.
In summary, our current improved US quantitative method integrated the merits of previous studies on ultrasound liver fat quantification, established a standardization procedure for measurement of US quantitative parameters, and provided a mathematical algorithm for liver fat content estimation with the US quantitative parameters. Further analysis on the validity of the improved US quantitative method confirmed the accuracy, reproducibility, and popularization value of this method, so this improved ultrasound quantitative method could be considered as a simple, relative accurate, reproducible, and low-cost analytic tool in the clinical evaluation of hepatic steatosis.
Acknowledgments
This work was supported by grants from National Key Technologies R&D Program (grant no. 2008 BAI52B03 and grant no. 2009BAI80B01 to X. G.), the Major Project of Subject Construction of Shanghai Bureau of Health (grant no. 08GWZX0203 to X. G.), the Science and Technology Commission of Shanghai Municipality (grant no.10411956400 to X. G. and grant no. 10411962600 to H.-M. Y.) and the Major Program of Shanghai Municipality for Basic Research (grant no. 08dj1400601 to X. G.).
The authors declared no conflict of interest.
Footnotes
Supplementary material is linked to the online version of the paper at http://www.nature.com/oby
Supplementary Material
REFERENCES
- Clark JM, Brancati FL, Diehl AM. Nonalcoholic fatty liver disease. Gastroenterology. 2002;122:1649–1657. doi: 10.1053/gast.2002.33573. [DOI] [PubMed] [Google Scholar]
- Williams R. Global challenges in liver disease. Hepatology. 2006;44:521–526. doi: 10.1002/hep.21347. [DOI] [PubMed] [Google Scholar]
- Bedogni G, Miglioli L, Masutti F.et al. Prevalence of and risk factors for nonalcoholic fatty liver disease: the Dionysos nutrition and liver study Hepatology 20054244–52. [DOI] [PubMed] [Google Scholar]
- Fan JG, Zhu J, Li XJ.et al. Prevalence of and risk factors for fatty liver in a general population of Shanghai, China J Hepatol 200543508–514. [DOI] [PubMed] [Google Scholar]
- Amarapurkar DN, Hashimoto E, Lesmana LA, Asia-Pacific Working Party on NAFLD et al. How common is non-alcoholic fatty liver disease in the Asia-Pacific region and are there local differences. J Gastroenterol Hepatol. 2007;22:788–793. doi: 10.1111/j.1440-1746.2007.05042.x. [DOI] [PubMed] [Google Scholar]
- Angulo P. Nonalcoholic fatty liver disease. N Engl J Med. 2002;346: 1221–1231. doi: 10.1056/NEJMra011775. [DOI] [PubMed] [Google Scholar]
- Marchesini G, Brizi M, Morselli-Labate AM.et al. Association of nonalcoholic fatty liver disease with insulin resistance Am J Med 1999107450–455. [DOI] [PubMed] [Google Scholar]
- Hamaguchi M, Kojima T, Takeda N.et al. Nonalcoholic fatty liver disease is a novel predictor of cardiovascular disease World J Gastroenterol 2007131579–1584. [DOI] [PMC free article] [PubMed] [Google Scholar]
- Fracanzani AL, Burdick L, Raselli S.et al. Carotid artery intima-media thickness in nonalcoholic fatty liver disease Am J Med 200812172–78. [DOI] [PubMed] [Google Scholar]
- Ratziu V, Charlotte F, Heurtier A, LIDO Study Group et al. Sampling variability of liver biopsy in nonalcoholic fatty liver disease. Gastroenterology. 2005;128:1898–1906. doi: 10.1053/j.gastro.2005.03.084. [DOI] [PubMed] [Google Scholar]
- Syn WK, Nightingale P, Bateman JM. Nonalcoholic fatty liver disease in a district general hospital: clinical presentation and risk factors. Hepatol Int. 2008;2:190–195. doi: 10.1007/s12072-008-9044-7. [DOI] [PMC free article] [PubMed] [Google Scholar]
- Dassanayake AS, Kasturiratne A, Rajindrajith S.et al. Prevalence and risk factors for non-alcoholic fatty liver disease among adults in an urban Sri Lankan population J Gastroenterol Hepatol 2009241284–1288. [DOI] [PubMed] [Google Scholar]
- Browning JD, Szczepaniak LS, Dobbins R.et al. Prevalence of hepatic steatosis in an urban population in the United States: impact of ethnicity Hepatology 2004401387–1395. [DOI] [PubMed] [Google Scholar]
- Thomsen C, Becker U, Winkler K.et al. Quantification of liver fat using magnetic resonance spectroscopy Magn Reson Imaging 199412487–495. [DOI] [PubMed] [Google Scholar]
- McPherson S, Jonsson JR, Cowin GJ.et al. Magnetic resonance imaging and spectroscopy accurately estimate the severity of steatosis provided the stage of fibrosis is considered J Hepatol 200951389–397. [DOI] [PubMed] [Google Scholar]
- Cowin GJ, Jonsson JR, Bauer JD.et al. Magnetic resonance imaging and spectroscopy for monitoring liver steatosis J Magn Reson Imaging 200828937–945. [DOI] [PubMed] [Google Scholar]
- Liu M, Gao X, Rao SX, Wu L, Zeng MS. [Measurement of intrahepatic triglyceride stores by 1H magnetic resonance spectroscopy: study with rat models and in patients] Zhonghua Yi Xue Za Zhi. 2008;88:531–533. [PubMed] [Google Scholar]
- Szczepaniak LS, Nurenberg P, Leonard D.et al. Magnetic resonance spectroscopy to measure hepatic triglyceride content: prevalence of hepatic steatosis in the general population Am J Physiol Endocrinol Metab 2005288E462–E468. [DOI] [PubMed] [Google Scholar]
- Strauss S, Gavish E, Gottlieb P, Katsnelson L. Interobserver and intraobserver variability in the sonographic assessment of fatty liver. AJR Am J Roentgenol. 2007;189:W320–W323. doi: 10.2214/AJR.07.2123. [DOI] [PubMed] [Google Scholar]
- Dasarathy S, Dasarathy J, Khiyami A.et al. Validity of real time ultrasound in the diagnosis of hepatic steatosis: a prospective study J Hepatol 2009511061–1067. [DOI] [PMC free article] [PubMed] [Google Scholar]
- Edens MA, van Ooijen PM, Post WJ.et al. Ultrasonography to quantify hepatic fat content: validation by 1H magnetic resonance spectroscopy Obesity Silver Spring 2009172239–2244. [DOI] [PubMed] [Google Scholar]
- Webb M, Yeshua H, Zelber-Sagi S.et al. Diagnostic value of a computerized hepatorenal index for sonographic quantification of liver steatosis AJR Am J Roentgenol 2009192909–914. [DOI] [PubMed] [Google Scholar]
- Mancini M, Prinster A, Annuzzi G.et al. Sonographic hepatic-renal ratio as indicator of hepatic steatosis: comparison with 1 H magnetic resonance spectroscopy Metab Clin Exp 2009581724–1730. [DOI] [PubMed] [Google Scholar]
- Thijssen JM, Starke A, Weijers G.et al. Computer-aided B-mode ultrasound diagnosis of hepatic steatosis: a feasibility study IEEE Trans Ultrason Ferroelectr Freq Control 2008551343–1354. [DOI] [PubMed] [Google Scholar]
- Farrell GC, Chitturi S, Lau GK, Sollano JD, Asia-Pacific Working Party on NAFLD Guidelines for the assessment and management of non-alcoholic fatty liver disease in the Asia-Pacific region: executive summary. J Gastroenterol Hepatol. 2007;22:775–777. doi: 10.1111/j.1440-1746.2007.05002.x. [DOI] [PubMed] [Google Scholar]
- Langton CM, Njeh CF. The measurement of broadband ultrasonic attenuation in cancellous bone–a review of the science and technology. IEEE Trans Ultrason Ferroelectr Freq Control. 2008;55:1546–1554. doi: 10.1109/TUFFC.2008.831. [DOI] [PubMed] [Google Scholar]
- Umchid S.Frequency dependent ultrasonic attenuation coefficient measurementISBME2008234–238.
- Bian H, Yan H, Zeng M.et al. Increased liver fat content and unfavorable glucose profiles in subjects without diabetes Diabetes Technol Ther 201113149–155. [DOI] [PubMed] [Google Scholar]
- Perkins NJ, Schisterman EF. The inconsistency of “optimal” cutpoints obtained using two criteria based on the receiver operating characteristic curve. Am J Epidemiol. 2006;163:670–675. doi: 10.1093/aje/kwj063. [DOI] [PMC free article] [PubMed] [Google Scholar]
- Cleophas TJ, Droogendijk J, van Ouwerkerk BM. Validating diagnostic tests, correct and incorrect methods, new developments. Curr Clin Pharmacol. 2008;3:70–76. doi: 10.2174/157488408784293697. [DOI] [PubMed] [Google Scholar]
- Stetson PF, Sommer FG, Macovski A. Lesion contrast enhancement in medical ultrasound imaging. IEEE Trans Med Imaging. 1997;16:416–425. doi: 10.1109/42.611351. [DOI] [PubMed] [Google Scholar]
- Stippel G, Philips W, Govaert P. A tissue-specific adaptive texture filter for medical ultrasound images. Ultrasound Med Biol. 2005;31:1211–1223. doi: 10.1016/j.ultrasmedbio.2005.05.008. [DOI] [PubMed] [Google Scholar]
- Gilmore IT, Burroughs A, Murray-Lyon IM.et al. Indications, methods, and outcomes of percutaneous liver biopsy in England and Wales: an audit by the British Society of Gastroenterology and the Royal College of Physicians of London Gut 199536437–441. [DOI] [PMC free article] [PubMed] [Google Scholar]
- Belfort R, Harrison SA, Brown K.et al. A placebo-controlled trial of pioglitazone in subjects with nonalcoholic steatohepatitis N Engl J Med 20063552297–2307. [DOI] [PubMed] [Google Scholar]
- Petersen KF, Dufour S, Befroy D.et al. Reversal of nonalcoholic hepatic steatosis, hepatic insulin resistance, and hyperglycemia by moderate weight reduction in patients with type 2 diabetes Diabetes 200554 603–608. [DOI] [PMC free article] [PubMed] [Google Scholar]
Associated Data
This section collects any data citations, data availability statements, or supplementary materials included in this article.


