Abstract
Study Design
Longitudinal repeated-measures; within-subject control.
Objective
We examined the extent to which an isometric plantar flexion training protocol attenuates bone loss longitudinally after SCI.
Summary of Background Data
After spinal cord injury (SCI), bone mineral density (BMD) of paralyzed extremities rapidly declines, likely because of loss of mechanical loading of bone via muscle contractions.
Methods
Six individuals with complete paralysis began a 3-year unilateral plantar flexor muscle activation program within 4.5 months after SCI. The opposite limb served as a control. Compliance with recommended dose was >80%. Tibia compressive force was >140% of body weight.
Results
Bilateral hip and untrained tibia BMD declined significantly over the course of the training. Lumbar spine BMD showed minimal change. Percent decline in BMD (from the baseline condition) for the trained tibia (~10%) was significantly less than the untrained tibia (~25%) (P < 0.05). Trained limb percent decline in BMD remained steady over the first 1.5 years of the study (P < 0.05).
Conclusions
Compressive loads of ~1 to 2 times body weight, induced by muscle contractions, partially prevent the loss of BMD after SCI. Future studies should establish dose-response curves for attenuation of bone loss after SCI.
Keywords: spine cord injury, osteoporosis, compressive load, electrical stimulation, dose-response
After spinal cord injury (SCI), paralyzed extremities experience a precipitous loss of bone mineral density (BMD). Shortly after SCI, BMD begins to decline at a rate of 2% to 4% per month,1 reaching equilibrium between 12 and 24 months at a level near fracture threshold.2–4 At this stage, fractures can occur with trivial injuries to the limbs, often during routine transfers and activities of daily living.5 Between 1% and 6% of people with SCI will sustain fractures in their paralyzed extremities,6–8 most often at the distal femur and proximal tibia.8
It remains unknown whether bone loss after SCI is due to insufficient osteogenic loads or if it is the result of neurogenic changes. Rehabilitation strategies to preserve BMD after SCI have been elusive. Strategies that involve loading of the extremities, such as electrically stimulated cycling and suspended treadmill walking, have shown limited effects on BMD.9–11 These methods may not deliver a sufficient load to provide an osteogenic stimulus to the skeletal system. Bone is in a state of activity-dependent flux, and biomechanical stresses help determine the shape, size, and composition of bone.12,13 Moreover, in the neurologically intact human model, bone density responds in a dosage-dependent manner to strain magnitude.14 It is plausible that this principle is still in operation after SCI. However, to our knowledge, no previous report has assessed compressive loads placed on bone as part of a long-term intervention to limit bone loss after SCI in humans.
In the paralyzed human model, it is difficult to deliver loads that exceed an osteogenic threshold without the use of electrically elicited muscle contractions. Muscular contractions deliver high compressive loads through bones and across joint surfaces during isometric contractions. Indeed, muscular contraction, not body weight, is responsible for the largest portion of the forces experienced by bone.15 Isometric contractions of muscles that run parallel with the bone (such as soleus) yield high compressive forces, and as such, may be optimal for preventing bone loss.16 Accordingly, the purposes of this study were: 1) to electrically train the plantar flexor muscles in order to optimize compressive loads delivered to the tibia and 2) to determine if these muscle stresses attenuate the normal bone loss after SCI. We hypothesize that tibial compressive forces will increase as a result of the electrical stimulation training program and that tibia BMD decline will be attenuated in the limbs exposed to the muscle training.
Methods and Materials
Subjects
Eight men and one woman gave written informed consent in accordance with the institutional human subjects review board. Inclusion criteria were complete motor and sensory SCI (ASIA score “A”)17 between C5 and T12. Exclusion criteria were musculoskeletal injury to the lower extremities, acute systemic illness, endocrine disorder, antiosteoporosis medications, and lower motor neuron injury to the lumbar-sacral spinal segments. Three subjects did not continue in the study because of increased work commitments, fracture to the untrained limb during a skiing accident, and death due to a respiratory infection. We report results from the cohort of 6 subjects who trained for at least 1.6 years and demonstrated at least 70% compliance with the recommended training protocol (Table 1).
Table 1.
Subject Demographics
| Subject No. | SCI Level | Trained Side | Age (yr) at SCI | Mean % Compliance |
Years Post-SCI at Start of Training |
Training Duration (yr) |
|---|---|---|---|---|---|---|
| 1 | C5 | R | 43 | 84.51 | 0.3507 | 2.3724 |
| 2 | C6 | L | 29 | 93.92 | 0.2603 | 2.3484 |
| 3 | T9 | R | 29 | 70.87 | 0.2959 | 3.0000 |
| 4 | T10 | R | 22 | 93.68 | 0.1562 | 3.0000 |
| 5 | T4 | R | 22 | 84.40 | 0.3507 | 2.5973 |
| 6 | T4 | R | 21 | 76.74 | 0.1616 | 1.6548 |
Compliance is the percentage of the recommended no. of contractions (2400) that a subject completed in a week. Mean percent compliance is the average compliance for the subject across all weeks of participation.
Subjects were enrolled in the study as soon as practical after SCI. Following hospitalization for acute SCI, all subjects enrolled in rehabilitation centers throughout the state. When they returned from rehabilitation, they began the training protocol. All subjects began training within 4.5 months after SCI. Each subject had his/her first DEXA scan before 4 days of training had transpired.
Training Protocol
The subjects performed electrical stimulation of the right or left plantar flexor muscles, while the contralateral leg remained as an untrained within-subject control. Subjects underwent acclimation to the protocol under the supervision of one of the investigators. The ankle was stabilized in a system that measured isometric plantar flexion torque.18–20 The knee was fixed at 90° of flexion and the ankle was secured in a neutral position. In this knee position, the majority of plantar flexion torque can be attributed to the soleus because all other plantar flexors operate at a mechanical disadvantage.21 After the subjects demonstrated proficiency in the program, they received a portable stimulation system to continue the program at home. Subjects returned to the laboratory each week for assessment of plantar flexion torque. During home training bouts, subjects sat in their wheelchairs and placed the “trained” foot onto an immobilization platform. The home training system duplicated the limb position used in the laboratory. Straps placed over the femur prevented the heel from lifting from the platform. The subjects placed reusable adhesive carbon electrodes over the plantar flexor muscles for electrical activation. The custom-designed electrical stimulation system was programmable by laboratory personnel but only had a start or stop button at the subject interface.
The stimulator was programmed to deliver a 10 pulse train (15 Hz; train duration, 667 milliseconds) every 2 seconds. A bout of exercise consisted of 120 trains. Subjects performed 4 bouts per day, with 5 minutes of rest between each bout. We selected this protocol because our goal was to increase muscle strength as well as endurance. We previously established that a 15-Hz train generates approximately 60% of maximal torque output from the plantar flexors in people with SCI.19 To verify compliance with the program, the stimulators were designed to operate when the subject’s skin impedance was recognized (based on a range previously established in the laboratory). Accordingly, the stimulators did not engage unless the electrodes were in place and the skin impedance matched that of the subject. Once activated, the preprogrammed stimulus frequency, intensity, repetitions, and duration were delivered unless the subject aborted the bout. A microprocessor and memory chip within the stimulator recorded the date, time, frequency, and number of stimulus pulses delivered to the subject. These data were downloaded each month during a laboratory session. In this way, we were able to precisely quantify each subject’s compliance with the training protocol to obtain an estimate of the compressive load exerted on the tibia.
DEXA Protocol
Subjects underwent DEXA (Hologic QDR 2000 scanner, Hologic Inc., Waltham, MA) scans of their spine, bilateral hips, and bilateral knees. Subjects underwent 3 scans in year 1 of the study, two scans in year 2, and one scan in year 3. A radiology technician positioned each subject, collected each scan, and conducted hip and spine analyses according to standard clinical protocols. DEXA provided areal BMD in g/cm2. Because the tibia is a nonstandard measurement site, we used a custom protocol to measure tibia BMD (Table 2).
Table 2.
DEXA Tibia Analysis Protocol
| Use Medium Density Spine Analysis protocol |
| Bisect the knee joint space with the top of the region of interest (ROI) |
| Set width of region of interest (ROI) to the width of the tibial plateau. Match the ROI height to the width |
| Shift the ROI 1–2 pixels medially or laterally if necessary to minimize air space |
| Engage the automatic bone detection function |
| Manually highlight missing bone pixels |
| Engage BMD analysis |
| In future scans of a subject, use the same ROI dimensions and placement as the initial scan |
DEXA data were grouped into five time bins, to allow comparisons to be made among subjects (Table 3). One subject’s scans were unusable for all but Bin 1 and a second subject’s baseline scan was missing. Thus, all BMD data are calculated for 4 subjects. The baseline BMD values are presented in Table 4.
Table 3.
Time Bins and Corresponding Chronologic Time After Commencement of Training
| Time Bin | Time After Start of Training | Mean (SE) Time DEXA Scan Was Acquired |
|---|---|---|
| 1 | 0 to 6 wk (0–0.125 yr) | −0.0799 (0.0546) |
| 2 | >6 wk to 6 mo (0.126–0.5 yr) | 0.2740 (0.0469) |
| 3 | >6 mo to 12 mo (0.501–1.0 yr) | 0.6781 (0.0191) |
| 4 | >12 mo to 18 mo (1.01–1.5 yr) | 1.2699 (0.0627) |
| 5 | >18 mo to 36 mo (1.501–3.0 yr) | 2.0764 (0.1408) |
Mean DEXA time is the average time after commencement of training (in years) that DEXA scans were obtained, for each bin. The negative value for Bin 1 indicates that, on average, subjects had their first DEXA shortly before beginning the training protocol.
Table 4.
Mean (SE) BMD Values (in g/cm2) for Time Bin 1 (0–6 Weeks From Start of Training)
| Location | Limb | BMD (SE) |
|---|---|---|
| Tibia | Trained | 0.29 (0.0201) |
| Untrained | 0.31 (0.0256) | |
| Hip | Trained | 0.97 (0.0598) |
| Untrained | 0.96 (0.0554) | |
| Spine | 1.10 (0.0388) |
Biomechanical Model: Calculation of Loading Dose
We chose the method of load delivery used in this study for two reasons. First, the soleus muscle (which in this test position is responsible for most of the torque output) runs virtually parallel with the tibia. Most of the force generated is compressive to the long axis of the tibia. Second, we wanted to target a load of approximately 1.5 times body weight (BW). Similar stresses are purported to be osteogenic in load-bearing bone.22 Based on a biomechanical model, we estimated that soleus activation could elicit compressive loads exceeding 1.5 times BW. Plantar flexion torque was divided by the moment arm of the Achilles tendon (6 cm during maximal voluntary contraction),23,24 yielding soleus contractile force. This force was transmitted as a compressive load to the tibia. All compressive forces were normalized to a body weight of 150 lb.
Calculation of Compliance
Compliance was calculated for each subject according to the following formula: (no. of stimulations received/no. of stimulations prescribed) × 100. All subjects received more than 70% of the prescribed dose of 2,400 contractions per week (4 bouts of 120 contractions per day × 5 days = 2,400) (Table 1). Thus, each subject’s trained soleus performed, on average, 1,680 contractions a week for the duration of the study.
Data Analysis
Because subjects had varied start times after SCI (all within 4.5 months), all BMD data were normalized to the initial assessment to calculate the % decline in BMD according to the following formula: (BMDinitial − BMDbinx)/(BMDinitial) × 100. A repeated-measures analysis of variance was used to determine if tibia compressive forces increased over time and if tibia BMD was different between the trained and untrained conditions across time. A significant interaction between time and training conditions directed us to perform simple effects comparisons at each time bin. We rejected the null hypothesis if the statistical tests supported that the probability of detected differences was less than 5 of 100 times (P < 0.05).
Results
Dose of Loading
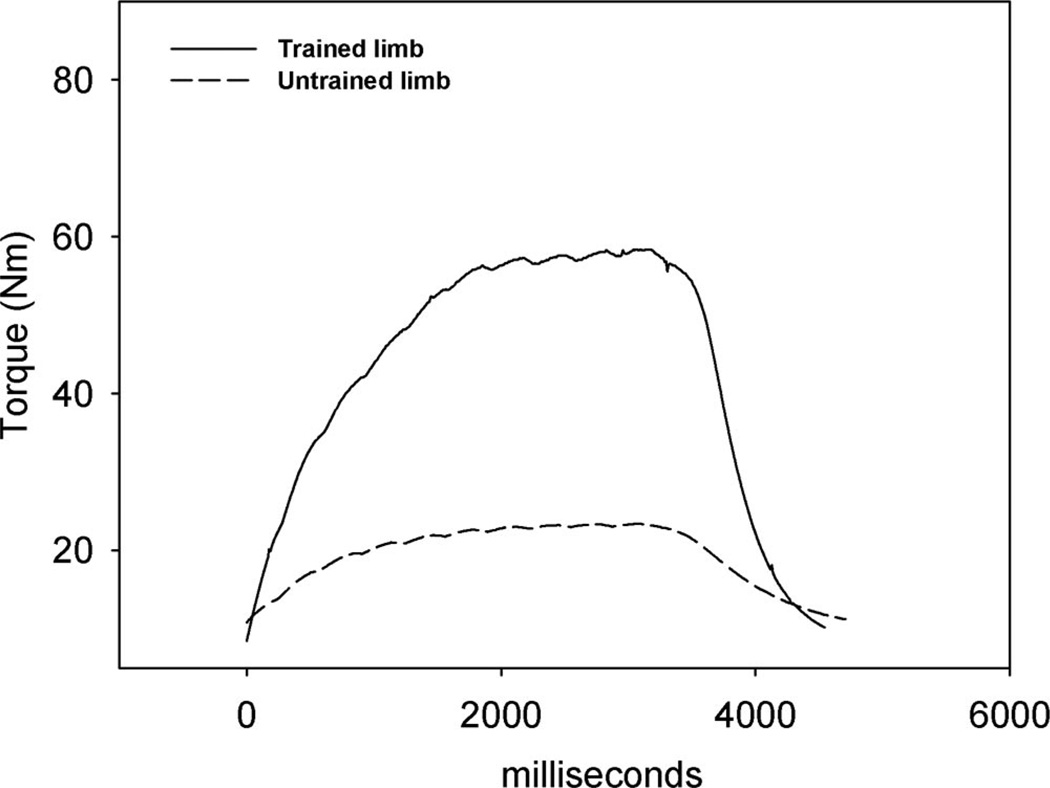
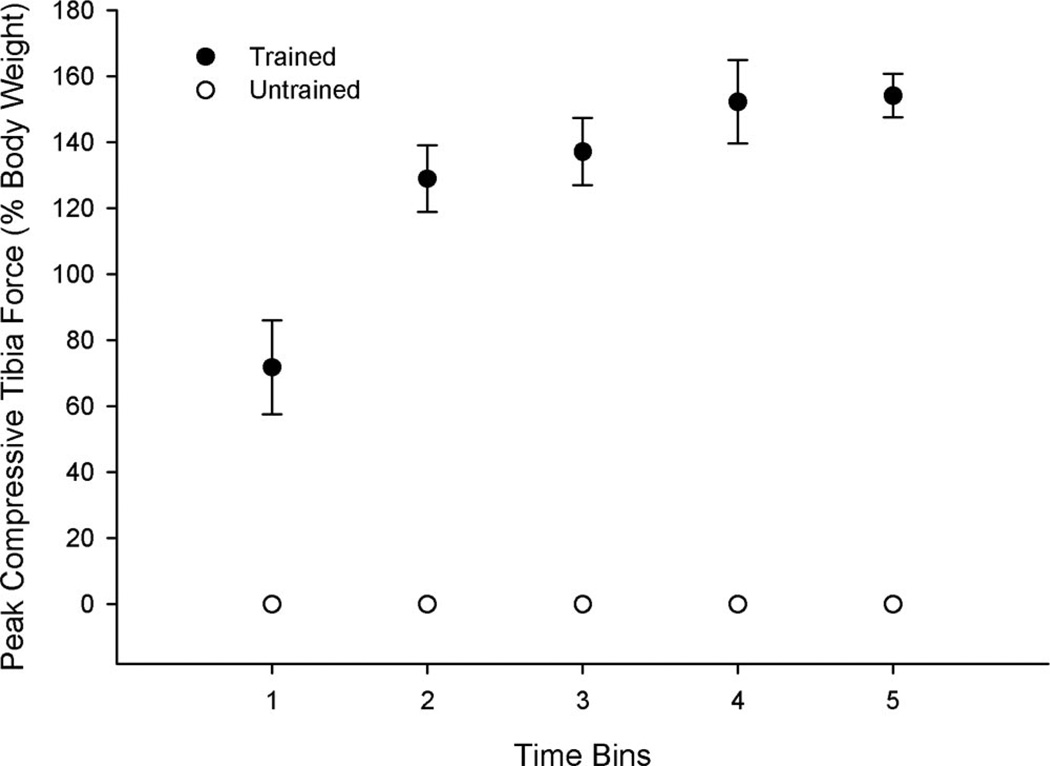
An example of the torque time curves for the trained and untrained limbs after 120 contractions appears in Figure 1. Peak compressive force during a bout of training varied from 301 N (70% BW) at the initial assessment (Bin 1) to 1,107 N (150% BW) by the final assessment (Bin 5) (Figure 2). Force-generating capacity developed rapidly during training; all subjects generated at least 600 N (90% BW) by the second time bin. Mean peak compressive force over Bins 2 to 5 was 810 N (156% BW) for times corresponding to 6 months to 36 months of training. Mean cumulative repetitions completed by Bin 5 was 246,131 for the trained limb.
Figure 1.
Representative plantar flexion torque-time curves for one subject after 2 years of training. The last contraction of a bout of 120 is presented for the trained and untrained limb.
Figure 2.
Mean (SE) peak tibia compressive forces delivered during electrically elicited soleus contractions. Although the untrained limb could generate force (see Figure 1), it did no training and therefore received no routine loading. We have set this value to zero to illustrate the contrasting loads routinely experienced by the two limbs.
DEXA BMD Results
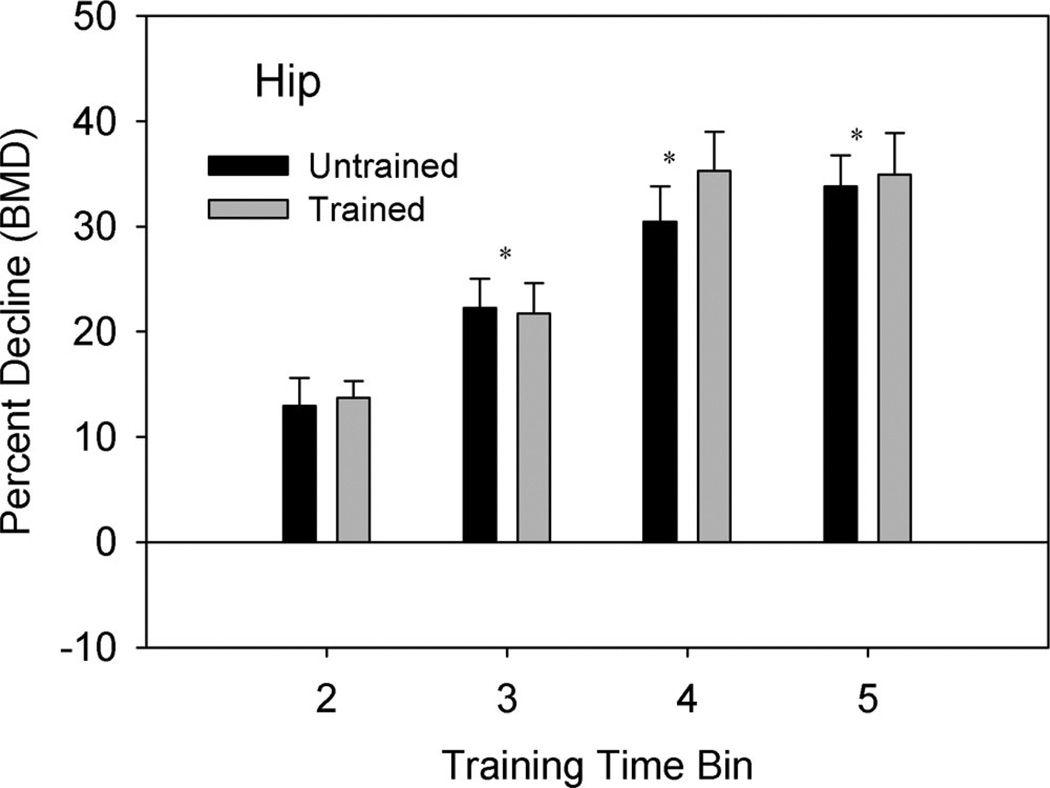
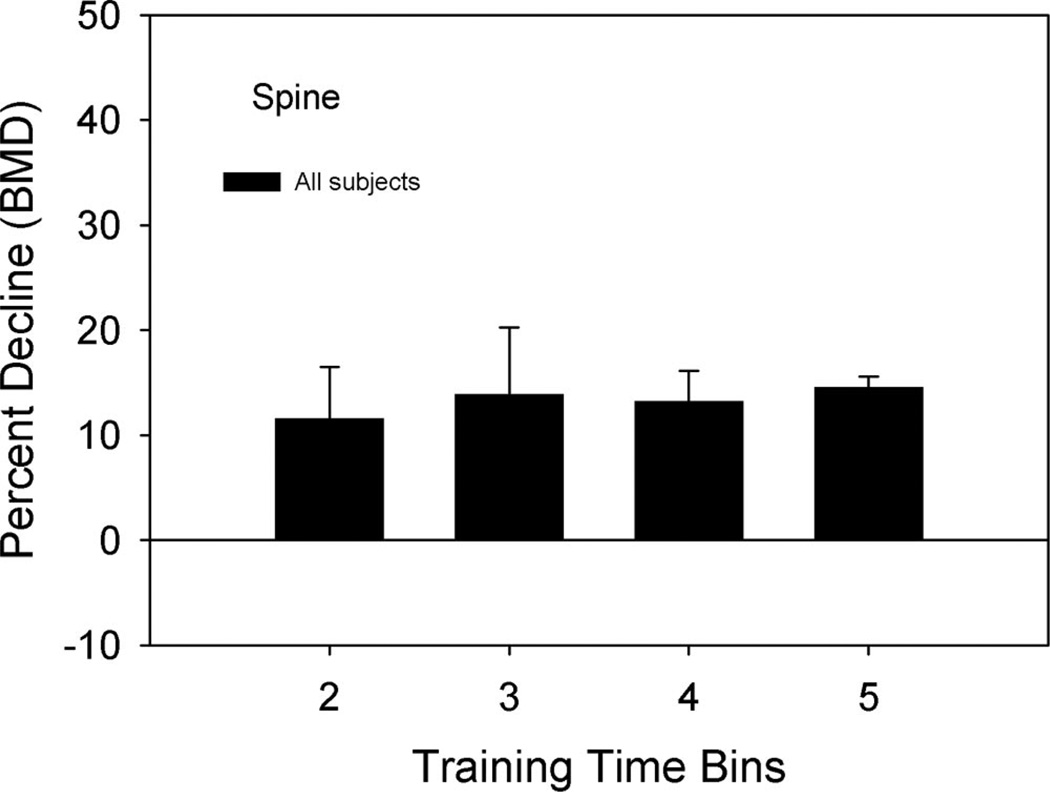
The mean percent decline in the hip BMD was ~12%, 23%, 30%, and 35% for time Bins 2, 3, 4, and 5, respectively. There was no significant difference between the trained and untrained limb hip percent decline in BMD at any time bin (P = 0.34). The percent decline in BMD for the hip was progressively greater at time Bins 3, 4, and 5 compared with time Bin 2 (P < 0.05) (Figure 3). The percent decline in BMD did not change between Bins 4 and 5, indicating that BMD loss reached a plateau (P = 0.13). The lumbar spine percent decline was unchanged during all time bins (Figure 4).
Figure 3.
Mean (SE) percent decline in hip BMD from the baseline (Bin 1) measurement. Percent decline = [(Bin 1 − Bin X)/Bin 1] × 100. Note that neither hip underwent training; the column labels indicate to which tibia (trained or untrained) the hip corresponded. *Both limbs different from time Bin 2 (P < 0.05).
Figure 4.
Mean (SE) percent decline in spine BMD from the baseline (Bin 1) measurement. Percent decline = [(Bin 1−Bin X)/Bin 1]× 100.
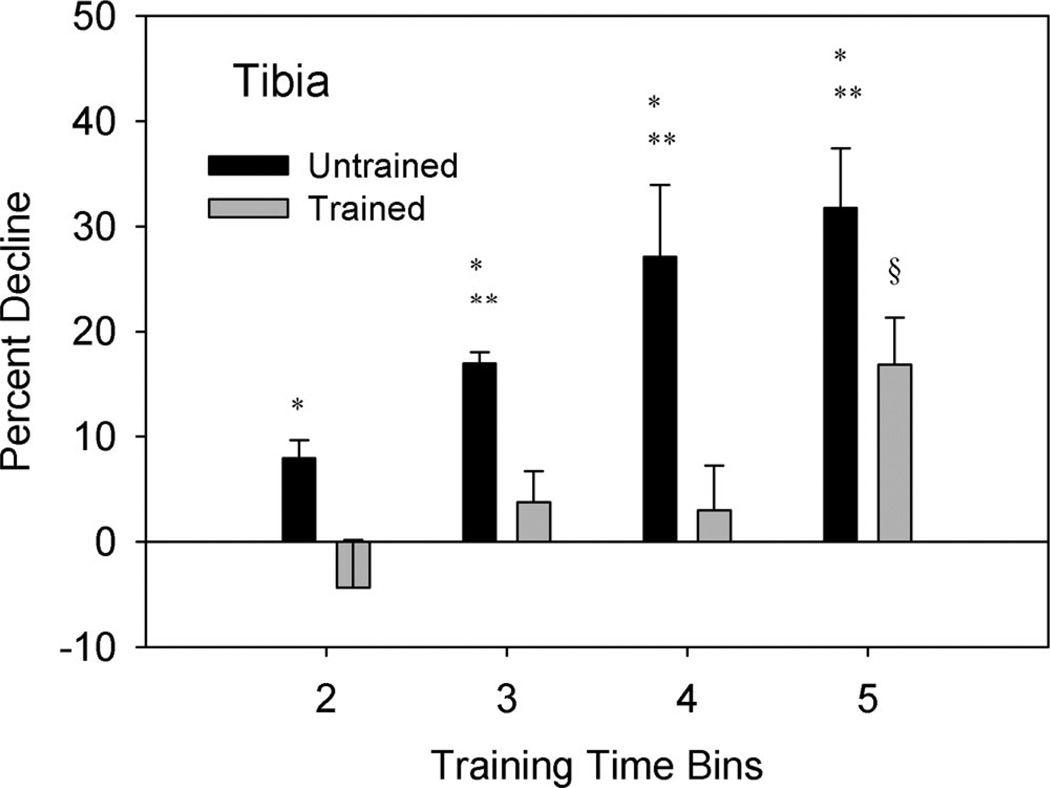
The percent decline in tibia BMD for the untrained limb was 8%, 17%, 27%, and 32% for time Bins 2, 3, 4, and 5, respectively. Conversely, the trained limb percent decline in tibia BMD was −3.8%, 3%, 3.4%, and 16% for time Bins 2, 3, 4, and 5, respectively (Figure 5). A significant interaction (P < 0.05) indicated that BMD for the trained limb changed differently from BMD in the untrained limb across time. Simple effects analysis at each time bin indicated that the untrained limb showed a greater percent decline in BMD than the trained limb (P<0.05). The percent decline in the untrained limb became progressively greater between time Bins 2, 3, and 4 (P < 0.05) but did not differ between Bins 4 and 5 (P = 0.286).
Figure 5.
Mean (SE) percent decline in tibia BMD from the baseline (Bin 1) measurement. Percent decline = [(Bin 1−Bin X)/Bin 1]× 100. *Different from trained limb (P < 0.05). **Different from untrained Bin 2 (P < 0.05). §Different from trained Bins 2, 3, and 4 (P < 0.05).
The percent decline in BMD for the trained limb at Bin 5 was significantly greater than at Bins 2, 3, and 4 (P < 0.05), indicating that the trained limb did not reach a plateau. Closer scrutiny of subject compliance over time revealed that dose of exercise did not decline in Bin 5. Similarly, the percent compliance of the month preceding the date of each DEXA did not correlate with % decline in BMD for Bins 4 and 5 (r2 = 0.0742).
Discussion
Dose of Loading
The soleus training program used in this study delivered high compressive loads to the trained tibia of individuals with SCI. Based on previous reports, we anticipated that high loads could provide an osteogenic stimulus to the skeletal system.16,22,25,26 We wished to determine whether long-duration training with stresses of this magnitude could yield attenuation of BMD loss after SCI.
Subjects quickly developed sufficient force-generating capacity to deliver the required magnitude of load to the tibia. Within 6 weeks after commencement of training, mean peak soleus force exceeded 70% of body weight (Figure 2), which surpasses the load that could be delivered by passive weight bearing. During passive weight bearing, each limb supports approximately one-half the head-arm-trunk segment, which translates into only about 40% of body weight.27 By the end of the first year of training, subjects generated the targeted 150% of body weight load. Because the number of repetitions was high (about 1,680 contractions per week) and the untrained limb received virtually no loading, there was a large difference in the potentially osteogenic stimuli to which the limbs were exposed.
Bone Density
Concurrent with these different stimuli, the trained and untrained limbs demonstrated markedly different patterns of BMD loss after SCI. In the untrained limb, tibia BMD declined precipitously (Figure 5). The pattern of significance mirrors the hip, in which percent decline in BMD is greater in Bins 3 to 5 than in Bin 2 (Figure 3). Because the hip received no compressive load during training, we anticipated no side to side differences at this site. We propose that the similar pattern of BMD decline at the hip and the untrained tibia supports that the untrained tibia did indeed experience no additional osteogenic stimulus as a result of the loading protocol. Indeed, subsequent to this study, we have evaluated tibia BMD in individuals that received no electrical stimulation. Hence, the untrained limb closely mirrors the “typical” bone loss that could be expected in a control group that received no stimulation.
The trained limb demonstrated a markedly different pattern of bone mineral loss than either the untrained limb or the hip. Percent decline in BMD held steady through 1.5 years of training. Moreover, percent decline in BMD for the trained limb was significantly different from the untrained limb through 3 years (Figure 5), demonstrating an attenuation of the normal loss of BMD after SCI. No previous studies of electrically activated loading have demonstrated a training effect of this duration.
The training effect observed in these subjects did not reach a plateau between Bins 4 and 5. This did not appear to be due to faltering compliance. Indeed, percent decline in BMD was only weakly correlated with compliance in these time periods. With a small sample size, it is difficult to speculate on the reason for the diminution of the training effect after 1.5 years. Future studies need to determine whether or not this loading strategy remains effective indefinitely.
Lumbar spine percent decline in BMD did not change during the 3-year protocol. This finding agrees with numerous other published reports.2,28–30 As has been observed elsewhere,2,28,29,30 BMD of the hip declined rapidly after SCI in this cohort of subjects. In this present study, subjects entered time Bin 5 at roughly 1 year and 10 months after SCI (mean time post-SCI at the start of training was 4.5 months; Bin 5 started at 1.5 years of training). Bin 5% decline in hip BMD did not differ from Bin 4 (Figure 3). Thus, as subjects neared 2 years post-SCI, hip BMD began to plateau. Biering-Sorensen and coauthors reported a similar plateau in hip BMD at 2 years postinjury in people with complete SCI.2
No previous studies have longitudinally investigated electrically activated isometric plantar flexor contractions after SCI. Belanger et al investigated electrically activated isokinetic knee extension but did not rigorously control resistance or velocity.31 As such, the load applied to the lower extremity during their training protocol is unclear. Another strategy, electrically stimulated cycling, has not elicited improvements in hip BMD,9,32,33 even after long-duration training.34 Improvements in BMD were noted for the proximal tibia in subjects who cycled 3 times a week, but not for those who cycled only 1 time per week.33 At the distal femur, Bloomfield et al report positive changes in BMD only for subjects who cycled at the highest work intensity (>18 Watts).9 Although these reports serve to underscore the concept of dose-response of BMD, neither offers information on compressive load delivered across the knee. This issue may be critical for the use of electrically stimulated cycling as a rehabilitation strategy. The knee joint forces that occur during electrically activated cycling may constitute a fracture risk for persons with SCI.35 A rehabilitation method that minimizes shear forces across long bones may be a more suitable strategy.27
Future studies need to elucidate whether high-dose compressive loading can be applied to both lower extremities using a feasible method to induce muscle contractions.27 Indeed, studying various doses of compressive load will delineate the optimal dose required to achieve BMD stability. Future studies must also determine whether attenuation of BMD decline can persist beyond 3 years of training. Finally, future studies should investigate the impact of muscular force and/or vibration as osteogenic influences on human skeletal tissue. Most assuredly, maintaining bone integrity will become increasingly important as individuals strive to avoid the secondary complications of SCI.
Conclusion
A program of isometric electrically activated plantar flexor muscle (primarily soleus) contractions attenuated the decline of bone mineral density in the tibias of individuals with SCI. Untrained tibia, hip, and spine BMD declined in the typical fashion. Important features of this program were its early start date (<4.5 months after SCI), high compressive force (>150% body weight), high dose (about 1680 contractions per week), and long duration (average, 2.5 years of training). We advocate further research into the potential for muscular contractions to induce osteogenic loads to bone; however, further studies must precisely quantify dose of load and employ a feasible method to apply load to the whole lower extremities.
Key Points.
Compressive loads delivered via muscle contraction attenuated BMD loss at the tibia in subjects with spinal cord injury.
The contralateral untrained tibia showed a similar loss of BMD as the hip, which received no compressive loads.
Differences between trained and untrained tibias persisted for 3 years of training.
Dose of loading during in-home training (compressive load, number of repetitions, frequency of exercise) was precisely quantified.
Future studies should elucidate the dose-response relationship of compressive loads applied to the entire lower extremity.
Acknowledgment
The authors thank Janet Schlechte, MD, Deanna Frei, RTR, CT, Marta Tullis, RN, and April Miller, RTR.
Supported by an award (R01-HD 39445) from the National Center for Medical Rehabilitation Research (NIH) and the Christopher Reeve and Sam Schmidt Foundations. Shauna Dudley-Javoroski received funding from the Foundation for Physical Therapy.
Federal and Foundation funds were received in support of this work. No benefits in any form have been or will be received from a commercial party related directly or indirectly to the subject of this manuscript.
Footnotes
The manuscript submitted does not contain information about medical device(s)/drug(s).
References
- 1.Wilmet E, Ismail AA, Heilporn A, et al. Longitudinal study of the bone mineral content and of soft tissue composition after spinal cord section. Paraplegia. 1995;33:674–677. doi: 10.1038/sc.1995.141. [DOI] [PubMed] [Google Scholar]
- 2.Biering-Sorensen F, Bohr HH, Schaadt OP. Longitudinal study of bone mineral content in the lumbar spine, the forearm and the lower extremities after spinal cord injury. Eur J Clin Invest. 1990;20:330–335. doi: 10.1111/j.1365-2362.1990.tb01865.x. [DOI] [PubMed] [Google Scholar]
- 3.Garland DE, Stewart CA, Adkins RH, et al. Osteoporosis after spinal cord injury. J Orthop Res. 1992;10:371–378. doi: 10.1002/jor.1100100309. [DOI] [PubMed] [Google Scholar]
- 4.Uebelhart D, Demiaux-Domenech B, Roth M, et al. Bone metabolism in spinal cord injured individuals and in others who have prolonged immobilization: a review. Paraplegia. 1995;33:669–673. doi: 10.1038/sc.1995.140. [DOI] [PubMed] [Google Scholar]
- 5.Keating JF, Kerr M, Delargy M. Minimal trauma causing fractures in patients with spinal cord injury. Disabil Rehabil. 1992;14:108–109. doi: 10.3109/09638289209167081. [DOI] [PubMed] [Google Scholar]
- 6.Comarr AE, Hutchinson RH, Bors E. Extremity fractures in paraplegic patients. Am J Surg. 1962;103:732–739. doi: 10.1016/0002-9610(62)90256-8. [DOI] [PubMed] [Google Scholar]
- 7.Eichenholtz SN. Management of long-bone fractures in paraplegic patients. J Bone Joint Surg Am. 1963;45:299–310. [Google Scholar]
- 8.Ragnarsson KT, Sell GH. Lower extremity fractures after spinal cord injury: a retrospective study. Arch Phys Med Rehabil. 1981;62:418–423. [PubMed] [Google Scholar]
- 9.Bloomfield SA, Mysiw WJ, Jackson RD. Bone mass and endocrine adaptations to training in spinal cord injured individuals. Bone. 1996;19:61–68. doi: 10.1016/8756-3282(96)00109-3. [DOI] [PubMed] [Google Scholar]
- 10.de Bruin ED, Frey-Rindova P, Herzog RE, et al. Changes of tibia bone properties after spinal cord injury: effects of early intervention. Arch Phys Med Rehabil. 1999;80:214–220. doi: 10.1016/s0003-9993(99)90124-7. [DOI] [PubMed] [Google Scholar]
- 11.Eser P, de Bruin ED, Telley I, et al. Effect of electrical stimulation-induced cycling on bone mineral density in spinal cord-injured patients. Eur J Clin Invest. 2003;33:412–419. doi: 10.1046/j.1365-2362.2003.01156.x. [DOI] [PubMed] [Google Scholar]
- 12.Frost HM. Bone ‘mass’ and the ‘mechanostat’: a proposal. Anat Rec. 1987;219:1–9. doi: 10.1002/ar.1092190104. [DOI] [PubMed] [Google Scholar]
- 13.Wolff J. The Law of Bone Remodeling. Berlin: Springer; 1986. [Google Scholar]
- 14.Granhed H, Jonson R, Hansson T. The loads on the lumbar spine during extreme weight lifting. Spine. 1987;12:146–149. doi: 10.1097/00007632-198703000-00010. [DOI] [PubMed] [Google Scholar]
- 15.Lu TW, Taylor SJ, O’Connor JJ, et al. Influence of muscle activity on the forces in the femur: an in vivo study. J Biomech. 1997;30:1101–1106. doi: 10.1016/s0021-9290(97)00090-0. [DOI] [PubMed] [Google Scholar]
- 16.Hsieh YF, Robling AG, Ambrosius WT, et al. Mechanical loading of diaphyseal bone in vivo: the strain threshold for an osteogenic response varies with location. J Bone Miner Res. 2001;16:2291–2297. doi: 10.1359/jbmr.2001.16.12.2291. [DOI] [PubMed] [Google Scholar]
- 17.Association ASI. International Standards for Neurological Classification of SCI. Atlanta, GA: American Spinal Injury Association; 2002. [Google Scholar]
- 18.Shields RK. Fatigability, relaxation properties, and electromyographic responses of the human paralyzed soleus muscle. J Neurophysiol. 1995;73:2195–2206. doi: 10.1152/jn.1995.73.6.2195. [DOI] [PubMed] [Google Scholar]
- 19.Shields RK, Chang Y-J. The effects of fatigue on the torque-frequency curve of the human paralysed soleus muscle. J Electromyogr Kinesiol. 1997;7:3–13. doi: 10.1016/s1050-6411(96)00015-6. [DOI] [PubMed] [Google Scholar]
- 20.Shields RK, Law LF, Reiling B, et al. Effects of electrically induced fatigue on the twitch and tetanus of paralyzed soleus muscle in humans. J Appl Physiol. 1997;82:1499–1507. doi: 10.1152/jappl.1997.82.5.1499. [DOI] [PubMed] [Google Scholar]
- 21.Sale D, Quinlan J, Marsh E, et al. Influence of joint position on ankle plantarflexion in humans. J Appl Physiol. 1982;52:1636–1642. doi: 10.1152/jappl.1982.52.6.1636. [DOI] [PubMed] [Google Scholar]
- 22.Frost HM. Bone’s mechanostat: a 2003 update. Anat Rec. 2003;275A:1081–1101. doi: 10.1002/ar.a.10119. [DOI] [PubMed] [Google Scholar]
- 23.Maganaris CN, Baltzopoulos V, Sargeant AJ. Changes in Achilles tendon moment arm from rest to maximum isometric plantarflexion: in vivo observations in man. J Physiol (Lond) 1998;510:977–985. doi: 10.1111/j.1469-7793.1998.977bj.x. [DOI] [PMC free article] [PubMed] [Google Scholar]
- 24.Maganaris CN, Baltzopoulos V, Sargeant AJ. In vivo measurement-based estimations of the human Achilles tendon moment arm. Eur J Appl Physiol. 2000;83:363–369. doi: 10.1007/s004210000247. [DOI] [PubMed] [Google Scholar]
- 25.Chow JW, Jagger CJ, Chambers TJ. Characterization of osteogenic response to mechanical stimulation in cancellous bone of rat caudal vertebrae. Am J Physiol. 1993;265:E340–E347. doi: 10.1152/ajpendo.1993.265.2.E340. [DOI] [PubMed] [Google Scholar]
- 26.Lee KC, Maxwell A, Lanyon LE. Validation of a technique for studying functional adaptation of the mouse ulna in response to mechanical loading. Bone. 2002;31:407–412. doi: 10.1016/s8756-3282(02)00842-6. [DOI] [PubMed] [Google Scholar]
- 27.Frey Law L, Shields RK. Femoral loads during passive, active, and active-resistive stance after spinal cord injury: a mathematical model. Clin Biomech. 2004;19:313–321. doi: 10.1016/j.clinbiomech.2003.12.005. [DOI] [PMC free article] [PubMed] [Google Scholar]
- 28.Garland DE, Adkins RH, Stewart CA, et al. Regional osteoporosis in women who have a complete spinal cord injury. J Bone Joint Surg Am. 2001;83:1195–1200. doi: 10.2106/00004623-200108000-00009. [DOI] [PubMed] [Google Scholar]
- 29.Leslie WD, Nance PW. Dissociated hip and spine demineralization: a specific finding in spinal cord injury. Arch Phys Med Rehabil. 1993;74:960–964. [PubMed] [Google Scholar]
- 30.Szollar SM, Martin EM, Parthemore JG, et al. Densitometric patterns of spinal cord injury associated bone loss. Spinal Cord. 1997;35:374–382. doi: 10.1038/sj.sc.3100394. [DOI] [PubMed] [Google Scholar]
- 31.Belanger M, Stein RB, Wheeler GD, et al. Electrical stimulation: can it increase muscle strength and reverse osteopenia in spinal cord injured individuals? Arch Phys Med Rehabil. 2000;81:1090–1098. doi: 10.1053/apmr.2000.7170. [DOI] [PubMed] [Google Scholar]
- 32.BeDell KK, Scremin AM, Perell KL, et al. Effects of functional electrical stimulation-induced lower extremity cycling on bone density of spinal cord-injured patients. Am J Phys Med Rehabil. 1996;75:29–34. doi: 10.1097/00002060-199601000-00008. [DOI] [PubMed] [Google Scholar]
- 33.Mohr T, Podenphant J, Biering-Sorensen F, et al. Increased bone mineral density after prolonged electrically induced cycle training of paralyzed limbs in spinal cord injured man. Calcif Tissue Int. 1997;61:22–25. doi: 10.1007/s002239900286. [DOI] [PubMed] [Google Scholar]
- 34.Leeds EM, Klose KJ, Ganz W, et al. Bone mineral density after bicycle ergometry training. Arch Phys Med Rehabil. 1990;71:207–209. [PubMed] [Google Scholar]
- 35.Franco JC, Perell KL, Gregor RJ, et al. Knee kinetics during functional electrical stimulation induced cycling in subjects with spinal cord injury: a preliminary study. J Rehabil Res Dev. 1999;36:207–216. [PubMed] [Google Scholar]


