

Abstract
We have systematically compared copy number variant (CNV) detection on eleven microarrays to evaluate data quality and CNV calling, reproducibility, concordance across array platforms and laboratory sites, breakpoint accuracy and analysis tool variability. Different analytic tools applied to the same raw data typically yield CNV calls with <50% concordance. Moreover, reproducibility in replicate experiments is <70% for most platforms. Nevertheless, these findings should not preclude detection of large CNVs for clinical diagnostic purposes because large CNVs with poor reproducibility are found primarily in complex genomic regions and would typically be removed by standard clinical data curation. The striking differences between CNV calls from different platforms and analytic tools highlight the importance of careful assessment of experimental design in discovery and association studies and of strict data curation and filtering in diagnostics. The CNV resource presented here allows independent data evaluation and provides a means to benchmark new algorithms.
Genomes of healthy individuals vary substantially with respect to structural genomic variation, of which CNVs represent the largest component1–4. The number of identified CNVs has increased dramatically as the resolution of detection technologies has improved, and there are now >15,000 CNV regions reported in the Database of Genomic Variants (DGV, http://projects.tcag.ca/variation/)1,5 Detection of CNVs has become a discipline to itself, and an important part of genetic studies of disease susceptibility, including cancer research6–8, clinical diagnostics9,10 and analysis of data from genome-wide association studies11–14. A recent industry report estimates that in 2010, microarray-based molecular diagnostics was a >$100 million market, primarily representing DNA-based arrays15. Although many methods, including DNA sequencing, can be used for CNV identification16,17, microarray screening remains the primary strategy used in clinical diagnostics and is expected to be the main approach for several years to come18.
The two main types of microarrays used for CNV detection are comparative genomic hybridization (CGH) arrays19 and single nucleotide polymorphism (SNP) arrays20. Multiple commercial arrays, with ever-increasing resolution, have been released in the last few years. However, the lack of standardized reporting of CNVs and of standardized reference samples make comparison of results from different CNV discovery efforts problematic21. The multitude of array types with different genome coverage and resolution further complicate interpretation. Studies that have targeted the same subjects, using standard DNA collections such as the HapMap22, have yielded results with minimal overlap2,11,23–25. CNV calls may also differ substantially depending on the analytic tools employed to identify the CNVs21,26,27. Because of these factors, concerns have been raised regarding the reliability, consistency and potential application of array-based approaches in both research and clinical settings28–31.
A number of studies have evaluated CNV detection abilities across microarray platforms31–38. However, published studies are quickly outdated as new platforms are introduced, and therefore provide little guidance to array users. The performance of CNV calling algorithms has also been investigated26,27,39, but has been analyzed for CGH array and SNP array data separately without an opportunity to compare the two. This dearth of information means that we have a limited understanding of the advantages and disadvantages associated with each platform.
In this study, we perform an exhaustive evaluation of 11 micro-arrays commonly used for CNV analysis in an attempt to understand the advantages and limitations of each platform for detecting CNVs. Six well-characterized control samples were tested in triplicate on each array. Each data set was analyzed with one to five analytic tools, including those recommended by each array producer. This resulted in >30 independent data sets for each sample, which we have compared and analyzed. All the raw data and results are made available to the community, providing an unprecedented reference set for future analysis and tool development.
RESULTS
We processed six samples in triplicate using 11 different array platforms at one or two laboratories. Each data set resulting from these experiments was analyzed by one or more CNV calling algorithms. The DNA samples originate from HapMap lymphoblast cell lines and were selected based on their inclusion in other large-scale projects and their lack of previously detected cell line artifacts or large chromosomal aberrations. An overview of the platforms, laboratories and algorithms is shown in Table 1, with additional details of the arrays and their coverage in Supplementary Tables 1 and 2 and Supplementary Figure 1. We assessed the experimental results at three different levels. First, we obtained measures of array signal variability based on raw data before CNV calling. Then, the data sets were analyzed with one or more CNV calling algorithms to determine the number of calls, between-replicate reproducibility and size distribution. In the third step, we compared the CNV calls to well-characterized and validated sets of variants, in order to examine the propensity for false-positive and false-negative calls and to estimate the accuracy of CNV boundaries.
Table 1.
Microarray platforms and CNV analysis tools
| CNV analysis tool |
|||||||||||||||
|---|---|---|---|---|---|---|---|---|---|---|---|---|---|---|---|
| Platform type |
Platform | No. of probesa |
Avg. probe length (bp) |
Siteb | Birdsuite | cnv Finder |
cnv Partition |
dCHIP | ADM-2 (DNA Analytics) |
Genotyping Console (GTC) |
iPattern | Nexus Copy Number |
Partek Genomics Suite |
PennCNV | QuantiSNP |
| CGH | Sanger WGTP | 29,043 | 170,000 | WTSI | X | X | |||||||||
| Agilent 244K | 236,381 | 60 | TCAG | X | X | ||||||||||
| Agilent 2×244K | 462,609 | 60 | TCAG, WTSI | X | X | ||||||||||
| NimbleGen 720K | 720,412 | 60 | WTSI | X | |||||||||||
| NimbleGen2.1M | 2,161,679 | 60 | HMS, WTSI | X | |||||||||||
|
| |||||||||||||||
| SNP | Affymetrix 500Kc | 500,568 | 25 | TCAG | X | X | X | ||||||||
| Illumina 650Y | 660,918 | 50 | TCAG | X | X | X | |||||||||
|
| |||||||||||||||
| SNP + CNV probes | Affymetrix 6.0 | 1,852,600 | 25 | TCAG, WTSI | X | X | X | X | X | ||||||
| Illumina 1M | 1,072,820 | 50 | HMS, TCAG | X | X | X | X | ||||||||
| Illumina 660W | 657,366 | 50 | HMS, TCAG | X | X | X | X | ||||||||
| Illumina Omni | 1,140,419 | 50 | HMS, TCAG | X | X | X | X | ||||||||
The results for each platform were analyzed by one or more CNV calling algorithms (see Supplementary Methods for more detailed descriptions). Cells with `X' indicate the software used for analysis of results from each array type.
See also Supplementary Methods and Supplementary Tables 1 and 2 for details.
Site where experiment was performed: HMS, Harvard Medical School, Boston; TCAG, The Centre for Applied Genomics, Toronto; WTSI, Wellcome Trust Sanger Institute, Cambridge.
After quality control, only the 250K-NspI array was included in final analysis.
Measures of array variability and signal-to-noise ratio
Before calling CNVs, we performed analyses on the variability in intensities across the probes for each array. This way, we could identify outlier experiments for each platform and also calculate summary measures of variability for the different arrays before CNV calling. We inspected platform-specific quality control measures including (i) mean, median and s.d. of log R ratio and B allele frequency for Illumina arrays, (ii) contrast quality control and median absolute pair-wise differences for Affymetrix arrays and (iii) producer-derived derivative log2 ratio spread for CGH arrays. In addition, measures of variability were calculated on the raw data for all platforms (Supplementary Methods), including the derivative log2 ratio spread and interquartile range (Table 2). The derivative log2 ratio spread statistic describes the absolute value of the log2 ratio variance from each probe to the next, averaged over the entire genome. The interquartile range is a measure of the dispersion of intensities in the center of the distribution, and is therefore less sensitive to outliers. The variability estimates include both biological and technical variability, but the effect of biological variability should be small on global statistics.
Table 2.
Overview of raw data quality measures for all experiments
| Platform | Site | DLRS (avg.) | DLRS (median) | Q1 − 1.5 × IQR | Q3 + 1.5 × IQR | Q3 − Q1 | ROC AUCa |
|---|---|---|---|---|---|---|---|
| Sanger WGTP | WTSI | 0.045 | 0.045 | −0.136 | 0.145 | 0.070 | 0.968 |
| Agilent 244K | TCAG | 0.172 | 0.171 | 0.111 | 0.237 | 0.032 | 0.997 |
| Agilent 2×244K-018897 | TCAG | 0.157 | 0.146 | 0.113 | 0.206 | 0.023 | 0.967 |
| Agilent 2×244K-018898 | TCAG | 0.179 | 0.182 | 0.128 | 0.246 | 0.030 | 0.968 |
| Agilent 2×244K-018897 | WTSI | 0.180 | 0.172 | 0.113 | 0.253 | 0.035 | 0.967 |
| Agilent 2×244K-018898 | WTSI | 0.196 | 0.197 | 0.127 | 0.269 | 0.036 | 0.954 |
| NimbleGen 720K | WTSI | 0.122 | 0.122 | 0.096 | 0.150 | 0.014 | 0.981 |
| NimbleGen 2.1M | HMS | 0.245 | 0.245 | 0.123 | 0.374 | 0.063 | 0.780 |
| NimbleGen 2.1M | WTSI | 0.250 | 0.250 | 0.051 | 0.436 | 0.096 | 0.899 |
| Affymetrix 500K−NspI+StyI | TCAG | 0.175 | 0.175 | 0.123 | 0.224 | 0.025 | 0.710 |
| Affymetrix 6.0 | TCAG | 0.220 | 0.220 | 0.158 | 0.280 | 0.031 | 0.889 |
| Affymetrix 6.0 | WTSI | 0.290 | 0.277 | 0.144 | 0.432 | 0.072 | 0.870 |
| Illumina 650Y | TCAG | 0.194 | 0.193 | 0.128 | 0.260 | 0.033 | 0.922 |
| Illumina 660W | HMS | 0.230 | 0.228 | 0.091 | 0.389 | 0.074 | 0.913 |
| Illumina 660W | TCAG | 0.255 | 0.255 | 0.140 | 0.369 | 0.057 | 0.912 |
| Illumina 1M-single | HMS | 0.224 | 0.222 | 0.173 | 0.271 | 0.024 | 0.956 |
| Illumina 1M-single | TCAG | 0.204 | 0.203 | 0.157 | 0.254 | 0.024 | 0.956 |
| Illumina Omni | HMS | 0.207 | 0.206 | 0.113 | 0.304 | 0.048 | 0.939 |
| Illumina Omni | TCAG | 0.232 | 0.231 | 0.137 | 0.259 | 0.031 | 0.942 |
Measures are based on autosomal probes only. DLRS, derivative log2 ratio spread; IQR, interquartile range; ROC AUC, ROC area under the curve.
ROC AUC measures are based on the comparison between NA15510 versus NA10851 using probes on chromosome 2 versus chromosome X.
The different quality measures were highly correlated. The data show a correlation between probe-length and variability, with longer probes giving less variance in fluorescence intensity. For the SNP platforms, we observed that besides sample-specific variability, systematic effects between a sample and the reference can also greatly inflate per-chip variability estimates, and consequently the ability to make reliable CNV calls. Specifically for Affymetrix results, we found large differences in quality control values depending on the baseline reference library used (Supplementary Fig. 2). Based on these results, subsequent analysis of Affymetrix data from The Centre for Applied Genomics (TCAG) was based on an internal reference library, whereas analysis of Affymetrix 6.0 data produced at the Wellcome Trust Sanger Institute (WTSI) was done using the Affymetrix-supplied reference library (no internal reference was available).
Next, we assessed how well a particular platform can be applied to detect copy number changes as an indication of the signal-to-noise ratio, by comparing the intensity ratios of probe-sets randomly selected from a male sample (NA10851) and a female sample (NA15510) for chromosome 2 versus chromosome X40, based on the assumption of a 2:1 ratio in males compared to females (Supplementary Methods). To estimate the sensitivity and specificity for each platform, we determined true- and false-positive rates and plotted the results as receiver operator characteristic (ROC) curves for CGH and SNP arrays (Supplementary Fig. 3a,b). The area under the curve (AUC) for the ROC analysis for each array (Table 2) shows a strong correlation with the fluorescence intensity variance as measured by derivative log2 ratio spread and interquartile range. CGH arrays generally show better signal-to-noise ratios compared to SNP arrays, probably as a consequence of longer probes on the former platform. Older arrays tend to perform less well than newer arrays from the same producer, with the exception of CNV focused arrays (Illumina 660W and Agilent 2X244K) where the large fraction of probes located in regions deviating from a copy number of two affects the global variance statistic. For all platforms, some hybridizations were discarded under quality control procedures (Supplementary Methods). For the Affymetrix 500K platform, experiments performed for the 250K Sty assay failed quality control, and we therefore used only results from the 250K Nsp assay for further analyses.
CNV calling
There are multiple algorithms that can be used for calling CNVs, and many are specific to certain array types. We decided to perform CNV calling with the algorithms recommended by each array producer, as well as several additional established methods. In total, 11 different algorithms were used to call CNVs for different subsets of the data (Table 1). The settings applied for these algorithms reflect parameters typically used in research laboratories, with a minimum of 5 probes and a minimum size of 1kb to call a CNV (see Supplementary Methods for settings used for each analysis tool).
The platforms with higher resolution, as well as those specifically designed for detection of previously annotated CNVs, identified substantially higher numbers of variants compared to lower resolution arrays. The total set of CNV calls for all platforms and algorithms is given in Supplementary Table 3. To minimize the effects of outlier data on global statistics, we created a set of high-confidence CNV calls for each data set, defined as regions with at least 80% reciprocal overlap identified in at least two of the three replicate experiments for each sample (Supplementary Table 3). The size distribution of high confidence CNVs for each array and algorithm combination is shown in Figure 1 and Supplementary Figure 4a,b. Although the number of variants >50 kb is relatively even across platforms, the fraction of variants 1–50 kb in size for each platform range from >5% for Affymetrix 250K to >95% for Illumina 660W. As the arrays differ substantially in resolution and in distribution of probes, it is also relevant to investigate the distribution of probes within the CNV call made for each platform (Supplementary Fig. 5). This analysis shows that arrays that specifically target CNVs detected in previous studies (e.g., Illumina 660W) have a very uniform distribution of number of probes per CNV call compared to arrays such as Illumina 1M and Affymetrix 6.0. Another aspect of the CNV calls that differ widely between platforms is the ratio of copy number gains to losses. Certain arrays are very biased toward detection of deletions, with the Illumina 660W showing the highest ratio of deletions to duplications (Supplementary Figs. 4 and 5).
Figure 1.
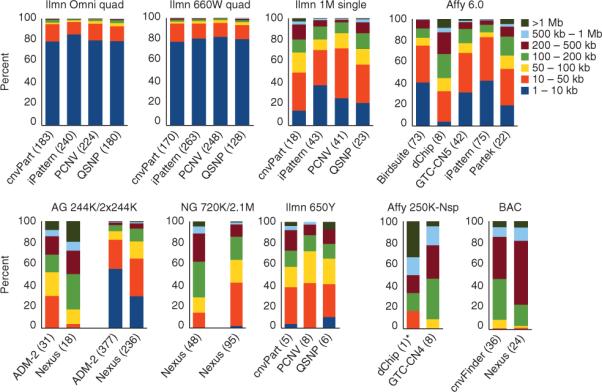
Size distribution of CNV calls. The size distribution for the high-confidence CNV calls (that is, CNV calls made in at least two of three replicates) is shown for all combinations of algorithms (Table 1, CNV analysis tools) and platforms. Each bin represents a different range of CNV lengths and the bars show the percentage of CNVs falling into each size bin. Representative results are shown for one genotyping site only, where the average number of CNVs per sample for that site is given in parentheses. The size distribution is therefore not representative of a sample. Instead, it represents the sizes of CNV calls detected in a total of six samples. Results for all sites and further breakdown into gains-only and losses-only can be found in Supplementary Figure 4. *For Affymetrix 250K-Nsp, dChip detects on average one CNV per sample. Affy, Affymetrix; Ilmn, Illumina; AG, Agilent; BAC, bacterial artificial chromosome; cnvPart, cnvPartition; NG, NimbleGen; PCNV, PennCNV; QSNP, QuantiSNP.
We further investigated the overlap between CNVs and genomic features such as genes and segmental duplications. For platforms with a higher resolution, a lower proportion of CNVs overlap genes (Supplementary Fig. 6a). This effect is likely because lower-resolution platforms primarily detect larger CNVs that are more likely to overlap genes owing to their size (Supplementary Fig. 6b). These results indicate that higher resolution platforms more accurately capture the true proportion of genic CNVs. A similar effect is seen for segmental duplications (SegDups; Supplementary Fig. 7).
Between-replicate CNV reproducibility
The experiments were performed in triplicate for each sample, allowing us to analyze the reproducibility in CNV calling between replicates. A CNV call was considered replicated if there was a reciprocal overlap of at least 80% between CNVs in a pair-wise comparison. Reproducibility was measured by calculating the sample level Jaccard similarity coefficient, defined as the number of replicated calls divided by the total number of nonredundant CNV calls. We first investigated these parameters across the full size range, including all CNVs >1 kb and with a minimum of five probes, representing cut-offs typically used in research projects. The summary data of call reproducibility and the number of calls for each platform and algorithm combination are shown in Figures 2a,b for high-resolution platforms and Supplementary Figure 8a for lower resolution platforms. The reproducibility is found to be <70% for most platform and algorithm combinations. In general, the most recently released arrays perform better, resulting in more CNV calls reproducibly obtained between replicates. Of the CGH arrays, the Agilent (2 × 244K) platform produced the largest number of CNV calls (an average of 377 and 387 calls per individual for the TCAG and WTSI sites, respectively, using the ADM-2 algorithm, Fig. 2b) with a con-comitant high percentage of CNV calls that were reproducible (67% and 62% for the two sites, respectively, Fig. 2a). For SNP arrays, the largest number of CNVs was called for the new CNV-focused Illumina arrays (an average of 263 and 240 calls per individual for Illumina 660W and OMNI, respectively, for the site showing the highest replicate reproducibility). In terms of reproducibility, the Affymetrix 6.0 and the three newest Illumina arrays (1M, 660W and OMNI) showed very similar values, around 80%, when analyzed with the best performing algorithms.
Figure 2.

CNV calling reproducibility. (a–c) Call reproducibility was evaluated by either comparing calls obtained from triplicate experiments (a,b) or by a comparison to various independent reference data sets (c). The percentage of concordant CNV calls between replicates for each combination of array, algorithm and site (a). The corresponding average number of CNVs per sample is given in b. The results for the lower-resolution arrays can be found in Supplementary Figure 8. (c) The percentage of high-confidence CNV calls for each set of results that overlaps (minimum of 50% reciprocal overlap) with data from DGV, and references 11 and 41. The DGV data were divided into array-based CNVs and sequence-based CNVs, and for the reference 11 data we independently considered a set of 8,599 validated variants as well as a subset of 4,978 CNVs that were genotyped. The poor performance of the BAC array is explained by the fact that the DGV data set was filtered so that low-resolution studies (including BAC array data) were removed. Site abbreviations: see Table 1 legend.
We observed that the variability in CNV calls was larger when using different CNV calling algorithms on the same raw data, compared to when the same algorithm is used on the data from different laboratories (Supplementary Figs. 8b,c). We find that results originating from different laboratories tend to cluster together, indicating that the site where the experiment was performed has less effect on resulting data than the choice of platform or algorithm. Interlaboratory variability correlates with reproducibility, and platforms exhibiting high reproducibility in replicates also seem more robust to interlaboratory variability. The exceptions to this are the Affymetrix arrays, where CNV calls are highly dependent on the reference data set used for analysis. We observe that the sample-level concordance of CNV calls between any combinations of two algorithms is typically 25–50% within a platform, and even lower for comparisons across platforms (Supplementary Fig. 9a). Larger CNVs would be expected to show higher concordance and we therefore divided the data into CNVs of 1–50 kb and variants >50 kb. Although we see improvement, the degree of concordance between platforms rarely exceeds 75% (Supplementary Fig. 9b,c).
Although detection of variants in the 1–50 kb range is important for research and discovery projects, clinical laboratories generally remove or disregard smaller variants. To address the question of reproducibility across different size ranges, all CNVs were divided into size bins, and the replicate reproducibility was analyzed in each bin. We performed this analysis separately for the different algorithms, platforms and sites (Supplementary Table 4a–c, respectively). Contrary to our expectations, we found that reproducibility is generally similar for large and small CNVs. We note that the reproducibility of large CNV calls is disproportionally affected by genome complexity as they tend to overlap SegDups to a larger extent than small CNVs: 55% of nonreplicated large calls (>200 kb) have at least 50% overlap with SegDups, compared to 4% for small calls (1–10 kb) (Supplementary Table 5). SegDups tend to complicate probe design, suffer from low probe coverage and cross-hybridization, and they are therefore often refractory to CNV detection using array-based techniques. Indeed, CNVs overlapping SegDups generally have fewer probes supporting them (Supplementary Fig. 7) and their reproducibility is lower compared to CNVs in unique sequence. Another contributing factor influencing the reproducibility of large CNVs is call fragmentation, that is, a single CNV is detected as multiple smaller variants. After lowering the minimum overlap required for a call to be considered replicated from 80% to any overlap, the reproducibility of large calls increases (Supplementary Table 4). Taken together, these factors likely offset the benefit of the increased number of probes in larger CNVs for call reproducibility.
We further investigated to what extent the different platforms detect CNVs >50 kb. Results of each platform were compared at the sample level, one platform at a time, to all variants >50 kb that were identified by the other platforms. We also performed the same comparison to variants detected by at least two other platforms (Supplementary Table 6). The results of the latter analysis show that the fraction of calls missed by each platform (of the regions detected by at least two other arrays), ranges from 15% for Agilent 2×244K to ~73–77% for Illumina SNP arrays. These differences between platforms may to some extent be explained by overlap with SegDups. The Agilent 2×244K data set has a larger fraction of calls >50 kb as well as a larger fraction of calls overlapping SegDups, compared to results from the Illumina SNP arrays. Indeed, we find that 80–85% of such missing Illumina calls overlap with SegDups (Supplementary Methods). We also find that many of the calls missed by SNP arrays but detected by CGH arrays are duplications. We ascribe this effect to a combination of differences in probe coverage and the type of reference used. Whereas SNP arrays use a population reference, CGH arrays use a single sample reference. The CGH arrays therefore have greater sensitivity to detect small differences in copy number (e.g., four versus five copies).
Comparison to independent CNV data sets
To estimate the accuracy of CNV calls, we compared the variants from each array and algorithm to existing CNV maps (Fig. 2c). We used four different `gold standard' data sets for comparison to minimize potential biases (Supplementary Fig. 10). The first data set is based on the Database of Genomic Variants (DGV v.9). We downloaded all variants in DGV and filtered the data to yield a high-quality gold standard data set (Supplementary Methods). The second data set we used was 8,599 validated CNV calls from a tiling-oligo CGH array from the Genome Structural Variation consortium11. The same study also produced CNV genotype data for 4,978 variants in 450 HapMap samples, including five of the six samples used in the present study (for sample-level comparisons, see Supplementary Fig. 11). Finally, we also used data from paired-end mapping based on fosmid end sequencing41.
The overlap analysis with these gold standard data sets was performed using the high-confidence CNV calls for each platform and algorithm combination. CNVs with a reciprocal overlap of at least 50% with gold standard variants were considered validated (Fig. 2c). For most platforms, at least 50% of the variants have been previously reported. There is better overlap with regions previously reported by array studies than regions originating from sequencing studies, which might be expected as all our CNV data stems from arrays. The overlap with CNVs identified by fosmid-end sequencing41 is low as most CNVs called in this work are below the detection limit of the fosmid-based approach . It is important to note that all samples included in the current study have also been interrogated in other studies represented in DGV using different platforms. This likely contributes to a higher overlap than what would be found with previously uncharacterized samples.
Estimation of breakpoint accuracy
Another aspect of CNV accuracy is how well the reported start and end coordinates correlate with the actual breakpoints, and how reproducible the breakpoint estimates are. To analyze breakpoints, we first investigated reproducibility in the triplicate experiments. For every CNV call set generated, we took the regions called in at least two of the three replicate experiments for each sample and calculated the distance between the breakpoints on the left and right side of the CNV call, respectively. The distribution of differences in breakpoint estimates between replicate experiments reflects, in part, the resolution of the platform and the reproducibility of the data (Fig. 3). To normalize for variable probe density between platforms, we performed the same analysis based on the number of probes that differed between replicate CNV calls, and the results are very similar (data not shown). One observation from these analyses is that there are clear differences between analytic tools when applied to the same raw data. Algorithms with predefined variant sets (e.g., Birdsuite42) and algorithms searching for clustering across samples (such as iPattern13) show substantially better reproducibility in breakpoint estimation for common CNVs than do algorithms treating each sample as an independent analysis.
Figure 3.

Reproducibility of CNV breakpoint assignments. The distances between the breakpoints for replicated CNV calls were divided into size bins for each platform, and the proportion of CNVs in each bin are plotted separately for the start (red, left) and end (blue, right) coordinates. The total number of breakpoints is given in parentheses. The data show that high-resolution platforms are highly consistent in the assignment of start and end coordinates for CNVs called across replicate experiments. Affy, Affymetrix; BAC, bacterial artificial chromosome; brkpt, breakpoint; HMS, Harvard Medical School; Ilmn, Illumina; TCAG, The Centre for Applied Genomics; WTSI, Wellcome Trust Sanger Institute.
In addition to reproducibility, we also sought to measure the accuracy of the breakpoints called by each platform. To perform this analysis, we used two data sets providing well-defined breakpoint information. First, we created a data set with nucleotide resolution breakpoints by combining data from capture and sequencing of CNV breakpoints43 with breakpoints collated44 from personal sequencing projects (Supplementary Fig. 12). The distance between the sequenced breakpoints and the CNV call coordinates in the present study was binned and plotted (Fig. 4a and Supplementary Methods). Only the more recent high-resolution arrays had enough CNV calls to yield meaningful results for this analysis (Supplementary Fig. 13). The data show that all platforms tend to underestimate the size of CNVs. This might be expected as the results reported for each algorithm correspond to the last probes within the variant showing evidence of a copy number difference. Arrays targeting known CNVs show the highest accuracy, as a result of their high probe density at these loci.
Figure 4.

CNV breakpoint accuracy. (a,b) The breakpoint accuracy for CNV deletions on each platform was assessed in a comparison to published sequencing data sets of nucleotide-resolution breakpoints compiled from various studies43,44 (a), or detected in the 1000 Genomes Project45,46 (b). Only a subset of platforms is included in this figure, as the lower resolution arrays did not have enough overlapping variants to make the comparison meaningful. In b, a total of 3,544 deletion breakpoints for sample NA18517 were collected from the 1000 Genomes Project and compared to the CNVs detected in each of the analyses in this study. Every row in the diagram corresponds to one of the 3,544 deletions and the color indicates whether that deletion was detected in the present study. Each row represents the distance between array versus sequencing-based breakpoints (`left' + `right' breakpoints for the same event are listed in adjacent rows). Schematic below shows sample-based comparisons between deletion breakpoints obtained with array versus sequencing methods. Gray means the deletion was not detected, whereas a color on the red-green scale is indicative of the accuracy of detected breakpoints. 1000G, 1000 Genomes Project.
We also measured breakpoint accuracy at the sample level by comparing deletion calls in this study with deletions from the 1000 Genomes Project45,46. Four of the samples used in this study were sequenced by that project, and those samples had 3,124–4,200 breakpoints annotated. The data were compared at the sample level for each combination of platform and algorithm. The results for a representative sample (NA18517) are displayed in Figure 4b (remaining samples in Supplementary Fig. 14), showing the overlap and breakpoint distance for each breakpoint from the 1000 Genomes Project. The results of these analyses are similar to those above, where all platforms show underestimation of the variable regions. Compared to other platforms the CNV-enriched SNP arrays (Illumina 660W and Omni) detect a substantially larger number of variants, which are present in the data from the 1000 Genomes Project. The Agilent 2×244k array, which also targets known CNVs, performs extremely well in relation to its probe density, especially when analyzed with the ADM-2 algorithm.
DISCUSSION
To our knowledge, this study represents the most comprehensive analysis of arrays and algorithms for CNV calling performed to date. The results provide insight into platform and algorithm performance, and the data should be a resource for the community that may be used as a benchmark for further comparisons and algorithm development. Our study differs from previous studies in that we have explored the full size spectrum of CNVs in healthy controls, rather than relying on large chromosomal aberrations or creating bacterial artificial chromosome (BAC) clone spike-in samples. As a result, we think this study provides better benchmarks for research aimed at CNV discovery and association, while still providing important insight for data interpretation in clinical laboratories.
As expected, the newer arrays, with a subset of probes specifically targeting CNVs, outperformed older arrays both in terms of the number of calls and the reproducibility of those calls. Analysis of the deviation in breakpoint estimates (based on number of probes) shows that this difference is not only due to an increased resolution, but is also consistent with increased individual probe performance in the newer arrays. These results highlight that newer arrays provide more accurate data, whether the focus is on smaller or larger variants.
We investigated the effects of using different CNV calling algorithms and found that the choice of analysis tool can be as important as the choice of array for accurate CNV detection. Different algorithms give substantially different quantity and quality of CNV calls, even when identical raw data are used as the input. This has important implications both for CNV-based, genome-wide association studies and for the genetic diagnostics field. We show that algorithms developed specifically for a certain data type (e.g., Birdsuite for Affymetrix 6.0 and DNA Analytics for Agilent data) generally perform better than platform-independent algorithms (e.g., Nexus Copy Number) or tools that have been readapted for newer versions of an array (e.g., dCHIP on Affymetrix 6.0 data).
Given the obvious variability between calling algorithms, we and others13,47,48 have found that using multiple algorithms minimizes the number of false discoveries. Based on our experience this scheme allows for greater experimental validation by qPCR, which are typically >95% for variants >30 kb13. Because the algorithms use different strategies for CNV calling, their strengths can be leveraged to ensure maximum specificity. Nevertheless, we still observe that up to 50% of the calls detected by only one of two algorithms can be validated when compared to sample-level CNVs11 (Supplementary Fig. 15), indicating that CNVs may be missed in this stringent approach and that merging call sets from multiple methods could improve sensitivity. Our results also show that one single tool is not always best for each array, but that the optimal algorithm for a data set is dependent upon the noise specific to that experiment. As an example, iPattern was one of the best performing algorithms for high-quality data from Affymetrix 6.0, but would not work properly for noisier Affymetrix 6.0 data.
There are limitations to our analysis that could be improved in future studies. The current lack of a gold standard for CNVs across the entire size spectrum makes it difficult to accurately assess the false-discovery rate. We consider the `gold standard' data sets used in the current analysis to be the best available to date, but the analysis should be updated once higher quality sequence-based data for both deletions and duplications exist. Another limitation of the data analysis is that we have not tested every algorithm across a large range of parameters. Our settings are based on substantial experience analyzing the same type of data from the same laboratories and on previous studies where optimal parameters have been established. We note that Birdsuite (and possibly other algorithms) have been trained on HapMap samples, raising the possibility of biased results. However, we see no clear evidence of this in comparison of the HapMap and non-HapMap samples in our study. Not all experiments passed quality control thresholds, but this was mainly the case for the lower resolution platforms (Affymetrix 250K, Illumina 650Y). The quality control steps also highlighted the problems of using an external reference set for analysis of Affymetrix data. Both for the 250K array run at TCAG and the Affymetrix 6.0 arrays run at WTSI, the lack of an internal reference led to poor signal-to-noise ratios. Finally, the different laboratories involved may be more experienced processing certain array types, leading to relatively better results, and the data inevitably contain subtle batch effects across sites and time points that is present in all data sets49. Nevertheless, we believe that the current study is representative of the results being obtained at different laboratories processing these arrays.
Our data highlight a number of factors that should be considered when designing array studies. For large cohort studies, it is important that all experiments are processed in one facility. Even though the data from different sites can be quite similar, they still differ enough to create problems in association analyses. It is also clear that comparison of data sets resulting from different platforms and/or different analytic tools will cause problems in association analyses and may create false association signals.
Our results are also important for the clinical diagnostics field. Typically, the assessment of data in clinical laboratories is focused on larger CNVs (different thresholds are used in different laboratories). We therefore performed a more detailed analysis of CNVs >50 kb. To our surprise, we found that the lack of overlap between platforms, algorithms and replicates that was found in the full data set similarly applied to large CNVs. A closer look at these regions indicates that most can be explained by overlap with complex regions and call fragmentation. In standard clinical assessment of patient data, curation of results and filtering of polymorphic regions would lead to removal of these variants. We therefore do not think that our data contradict previous reports of high accuracy in detecting clinically significant rearrangements in patients across different laboratories and array types. However, our results bring light to the problems of clinical interpretation of variants in complex regions and highlight the risks of incorporating less stringent filtering of data in diagnostics.
We expect that the use of microarrays will continue to grow over the next few years and that they will be a mainstay in genome-wide diagnostics for some time. Our study represents a comprehensive assessment of the capabilities of current technologies for research and diagnostic use. By making these data sets available to the research community, we anticipate that they will be a valuable resource for further analyses and development of CNV calling algorithms and as test data for comparison with additional current and future platforms.
METhODS
Methods and any associated references are available in the online version of the paper at http://www.nature.com/nbt/index.html.
Supplementary Material
ACKNoWLEDGMENTS
We thank J. Rickaby and M. Lee for excellent technical assistance. We thank colleagues at Affymetrix, Agilent, Illumina and NimbleGen, and Biodiscovery for sharing data, sharing software and technical assistance. The Toronto Centre for Applied Genomics at the Hospital for Sick Children is acknowledged for database, technical assistance and bioinformatics support. This work was supported by funding from the Genome Canada/Ontario Genomics Institute, the Canadian Institutes of Health Research (CIHR), the McLaughlin Centre, the Canadian Institute of Advanced Research, the Hospital for Sick Children (SickKids) Foundation, a Broad SPARC Project award to P.K.D. and C.L., US National Institutes of Health (NIH) grant HD055150 to P.K.D., and the Department of Pathology at Brigham and Women's Hospital in Boston and NIH grants HG005209, HG004221 and CA111560 to C.L. N.P.C., D. Rajan, D. Rigler, T.F., S.G. and E.P. are supported by the Wellcome Trust (grant no. WT077008). D.P. is supported by fellowships from the Canadian Institutes of Health Research (no. 213997) and the Netherlands Organization for Scientific Research (Rubicon 825.06.031). X.S. is supported by a T32 Harvard Medical School training grant, and K.N. is supported by a T32 institutional training grant (HD007396). S.W.S. holds the GlaxoSmithKline-CIHR Pathfinder Chair in Genetics and Genomics at the University of Toronto and the Hospital for Sick Children (Canada). L.F. is supported by the Göran Gustafsson Foundation and the Swedish Foundation for Strategic Research.
Footnotes
Accession codes. Array data are available at GEO under accession no. GSE25893. CNV locations are reported in Supplementary Table 3, and will be displayed at the Database of Genomic Variants (http://projects.tcag.ca/variation/).
Note: Supplementary information is available on the Nature Biotechnology website.
AUTHOR CONTRIBUTIONS D.P., C.L., N.P.C., M.E.H., S.W.S. and L.F. conceived and designed the study. D.P. and L.F. coordinated sample distribution, experiments and analysis. K.D. managed the experiments conceived at the Harvard Medical School and performed the Nexus analysis. R.S.S., D. Rajan, D. Rigler, T.F., J.H.P., K.N., S.G. and E.P. performed the experiments. Data analyses were performed by D.P., K.D., R.S.S., D. Rajan, T.F., A.C.L., B.T., J.R.M., R.M., A.P., K.N., X.S., P.K.D. and L.F. All authors participated in discussions of different parts of the study. D.P., C.L., S.W.S. and L.F. wrote the manuscript. All authors read and approved the manuscript.
COMPETING FINANCIAL INTERESTS The authors declare competing financial interests: details accompany the full-text HTML version of the paper at http://www.nature.com/nbt/index.html.
References
- 1.Iafrate AJ, et al. Detection of large-scale variation in the human genome. Nat. Genet. 2004;36:949–951. doi: 10.1038/ng1416. [DOI] [PubMed] [Google Scholar]
- 2.Redon R, et al. Global variation in copy number in the human genome. Nature. 2006;444:444–454. doi: 10.1038/nature05329. [DOI] [PMC free article] [PubMed] [Google Scholar]
- 3.Sebat J, et al. Large-scale copy number polymorphism in the human genome. Science. 2004;305:525–528. doi: 10.1126/science.1098918. [DOI] [PubMed] [Google Scholar]
- 4.Tuzun E, et al. Fine-scale structural variation of the human genome. Nat. Genet. 2005;37:727–732. doi: 10.1038/ng1562. [DOI] [PubMed] [Google Scholar]
- 5.Zhang J, Feuk L, Duggan GE, Khaja R, Scherer SW. Development of bioinformatics resources for display and analysis of copy number and other structural variants in the human genome. Cytogenet. Genome Res. 2006;115:205–214. doi: 10.1159/000095916. [DOI] [PubMed] [Google Scholar]
- 6.Cho EK, et al. Array-based comparative genomic hybridization and copy number variation in cancer research. Cytogenet. Genome Res. 2006;115:262–272. doi: 10.1159/000095923. [DOI] [PubMed] [Google Scholar]
- 7.Diskin SJ, et al. Copy number variation at 1q21.1 associated with neuroblastoma. Nature. 2009;459:987–991. doi: 10.1038/nature08035. [DOI] [PMC free article] [PubMed] [Google Scholar]
- 8.Shlien A, et al. Excessive genomic DNA copy number variation in the Li-Fraumeni cancer predisposition syndrome. Proc. Natl. Acad. Sci. USA. 2008;105:11264–11269. doi: 10.1073/pnas.0802970105. [DOI] [PMC free article] [PubMed] [Google Scholar]
- 9.Beaudet AL, Belmont JW. Array-based DNA diagnostics: let the revolution begin. Annu. Rev. Med. 2008;59:113–129. doi: 10.1146/annurev.med.59.012907.101800. [DOI] [PubMed] [Google Scholar]
- 10.Lee C, Iafrate AJ, Brothman AR. Copy number variations and clinical cytogenetic diagnosis of constitutional disorders. Nat. Genet. 2007;39:S48–S54. doi: 10.1038/ng2092. [DOI] [PubMed] [Google Scholar]
- 11.Conrad DF, et al. Origins and functional impact of copy number variation in the human genome. Nature. 2010;464:704–712. doi: 10.1038/nature08516. [DOI] [PMC free article] [PubMed] [Google Scholar]
- 12.McCarroll SA, et al. Deletion polymorphism upstream of IRGM associated with altered IRGM expression and Crohn's disease. Nat. Genet. 2008;40:1107–1112. doi: 10.1038/ng.215. [DOI] [PMC free article] [PubMed] [Google Scholar]
- 13.Pinto D, et al. Functional impact of global rare copy number variation in autism spectrum disorders. Nature. 2010;466:368–372. doi: 10.1038/nature09146. [DOI] [PMC free article] [PubMed] [Google Scholar]
- 14.Wellcome Trust Case Control Consortium Genome-wide association study of CNVs in 16,000 cases of eight common diseases and 3,000 shared controls. Nature. 2010;464:713–720. doi: 10.1038/nature08979. [DOI] [PMC free article] [PubMed] [Google Scholar]
- 15.The DNA microarray market. UBS Investment Research Q-Series. 2006 [Google Scholar]
- 16.Carson AR, Feuk L, Mohammed M, Scherer SW. Strategies for the detection of copy number and other structural variants in the human genome. Hum. Genomics. 2006;2:403–414. doi: 10.1186/1479-7364-2-6-403. [DOI] [PMC free article] [PubMed] [Google Scholar]
- 17.Pang AW, et al. Towards a comprehensive structural variation map of an individual human genome. Genome Biol. 2010;11:R52. doi: 10.1186/gb-2010-11-5-r52. [DOI] [PMC free article] [PubMed] [Google Scholar]
- 18.Miller DT, et al. Consensus statement: chromosomal microarray is a first-tier clinical diagnostic test for individuals with developmental disabilities or congenital anomalies. Am. J. Hum. Genet. 2010;86:749–764. doi: 10.1016/j.ajhg.2010.04.006. [DOI] [PMC free article] [PubMed] [Google Scholar]
- 19.Pinkel D, et al. High resolution analysis of DNA copy number variation using comparative genomic hybridization to microarrays. Nat. Genet. 1998;20:207–211. doi: 10.1038/2524. [DOI] [PubMed] [Google Scholar]
- 20.Huang J, et al. Whole genome DNA copy number changes identified by high density oligonucleotide arrays. Hum. Genomics. 2004;1:287–299. doi: 10.1186/1479-7364-1-4-287. [DOI] [PMC free article] [PubMed] [Google Scholar]
- 21.Scherer SW, et al. Challenges and standards in integrating surveys of structural variation. Nat. Genet. 2007;39:S7–S15. doi: 10.1038/ng2093. [DOI] [PMC free article] [PubMed] [Google Scholar]
- 22.The International HapMap Consortium The International HapMap Project. Nature. 2003;426:789–796. doi: 10.1038/nature02168. [DOI] [PubMed] [Google Scholar]
- 23.Eichler EE. Widening the spectrum of human genetic variation. Nat. Genet. 2006;38:9–11. doi: 10.1038/ng0106-9. [DOI] [PubMed] [Google Scholar]
- 24.Locke DP, et al. Linkage disequilibrium and heritability of copy-number polymorphisms within duplicated regions of the human genome. Am. J. Hum. Genet. 2006;79:275–290. doi: 10.1086/505653. [DOI] [PMC free article] [PubMed] [Google Scholar]
- 25.Pinto D, Marshall C, Feuk L, Scherer SW. Copy-number variation in control population cohorts. Hum. Mol. Genet. 2007;16:R168–R173. doi: 10.1093/hmg/ddm241. [DOI] [PubMed] [Google Scholar]
- 26.Lai WR, Johnson MD, Kucherlapati R, Park PJ. Comparative analysis of algorithms for identifying amplifications and deletions in array CGH data. Bioinformatics. 2005;21:3763–3770. doi: 10.1093/bioinformatics/bti611. [DOI] [PMC free article] [PubMed] [Google Scholar]
- 27.Winchester L, Yau C, Ragoussis J. Comparing CNV detection methods for SNP arrays. Brief. Funct. Genomics. 2009;8:353–366. doi: 10.1093/bfgp/elp017. [DOI] [PubMed] [Google Scholar]
- 28.Irizarry RA, et al. Multiple-laboratory comparison of microarray platforms. Nat. Methods. 2005;2:345–350. doi: 10.1038/nmeth756. [DOI] [PubMed] [Google Scholar]
- 29.Kothapalli R, Yoder SJ, Mane S, Loughran TP., Jr. Microarray results: how accurate are they? BMC Bioinformatics. 2002;3:22. doi: 10.1186/1471-2105-3-22. [DOI] [PMC free article] [PubMed] [Google Scholar]
- 30.Tan PK, et al. Evaluation of gene expression measurements from commercial microarray platforms. Nucleic Acids Res. 2003;31:5676–5684. doi: 10.1093/nar/gkg763. [DOI] [PMC free article] [PubMed] [Google Scholar]
- 31.Zhang ZF, et al. Detection of submicroscopic constitutional chromosome aberrations in clinical diagnostics: a validation of the practical performance of different array platforms. Eur. J. Hum. Genet. 2008;16:786–792. doi: 10.1038/ejhg.2008.14. [DOI] [PubMed] [Google Scholar]
- 32.Baumbusch LO, et al. Comparison of the Agilent, ROMA/NimbleGen and Illumina platforms for classification of copy number alterations in human breast tumors. BMC Genomics. 2008;9:379. doi: 10.1186/1471-2164-9-379. [DOI] [PMC free article] [PubMed] [Google Scholar]
- 33.Curtis C, et al. The pitfalls of platform comparison: DNA copy number array technologies assessed. BMC Genomics. 2009;10:588. doi: 10.1186/1471-2164-10-588. [DOI] [PMC free article] [PubMed] [Google Scholar]
- 34.Coe BP, et al. Resolving the resolution of array CGH. Genomics. 2007;89:647–653. doi: 10.1016/j.ygeno.2006.12.012. [DOI] [PubMed] [Google Scholar]
- 35.Greshock J, et al. A comparison of DNA copy number profiling platforms. Cancer Res. 2007;67:10173–10180. doi: 10.1158/0008-5472.CAN-07-2102. [DOI] [PubMed] [Google Scholar]
- 36.Hehir-Kwa JY, et al. Genome-wide copy number profiling on high-density bacterial artificial chromosomes, single-nucleotide polymorphisms, and oligonucleotide microarrays: a platform comparison based on statistical power analysis. DNA Res. 2007;14:1–11. doi: 10.1093/dnares/dsm002. [DOI] [PMC free article] [PubMed] [Google Scholar]
- 37.Hester SD, et al. Comparison of comparative genomic hybridization technologies across microarray platforms. J. Biomol. Tech. 2009;20:135–151. [PMC free article] [PubMed] [Google Scholar]
- 38.Wicker N, et al. A new look towards BAC-based array CGH through a comprehensive comparison with oligo-based array CGH. BMC Genomics. 2007;8:84. doi: 10.1186/1471-2164-8-84. [DOI] [PMC free article] [PubMed] [Google Scholar]
- 39.Dellinger AE, et al. Comparative analyses of seven algorithms for copy number variant identification from single nucleotide polymorphism arrays. Nucleic Acids Res. 2010;38:e105. doi: 10.1093/nar/gkq040. [DOI] [PMC free article] [PubMed] [Google Scholar]
- 40.Matsuzaki H, Wang PH, Hu J, Rava R, Fu GK. High resolution discovery and confirmation of copy number variants in 90 Yoruba Nigerians. Genome Biol. 2009;10:R125. doi: 10.1186/gb-2009-10-11-r125. [DOI] [PMC free article] [PubMed] [Google Scholar]
- 41.Kidd JM, et al. Mapping and sequencing of structural variation from eight human genomes. Nature. 2008;453:56–64. doi: 10.1038/nature06862. [DOI] [PMC free article] [PubMed] [Google Scholar]
- 42.Korn JM, et al. Integrated genotype calling and association analysis of SNPs, common copy number polymorphisms and rare CNVs. Nat. Genet. 2008;40:1253–1260. doi: 10.1038/ng.237. [DOI] [PMC free article] [PubMed] [Google Scholar]
- 43.Conrad DF, et al. Mutation spectrum revealed by breakpoint sequencing of human germline CNVs. Nat. Genet. 2010;42:385–391. doi: 10.1038/ng.564. [DOI] [PMC free article] [PubMed] [Google Scholar]
- 44.Lam HY, et al. Nucleotide-resolution analysis of structural variants using BreakSeq and a breakpoint library. Nat. Biotechnol. 2010;28:47–55. doi: 10.1038/nbt.1600. [DOI] [PMC free article] [PubMed] [Google Scholar]
- 45.The 1000 Genomes Project Consortium A map of human genome variation from population-scale sequencing. Nature. 2010;467:1061–1073. doi: 10.1038/nature09534. [DOI] [PMC free article] [PubMed] [Google Scholar]
- 46.Mills RE, et al. Mapping copy number variation by population-scale genome sequencing. Nature. 2011;470:59–65. doi: 10.1038/nature09708. [DOI] [PMC free article] [PubMed] [Google Scholar]
- 47.Marshall CR, et al. Structural variation of chromosomes in autism spectrum disorder. Am. J. Hum. Genet. 2008;82:477–488. doi: 10.1016/j.ajhg.2007.12.009. [DOI] [PMC free article] [PubMed] [Google Scholar]
- 48.Xu B, et al. Strong association of de novo copy number mutations with sporadic schizophrenia. Nat. Genet. 2008;40:880–885. doi: 10.1038/ng.162. [DOI] [PubMed] [Google Scholar]
- 49.Leek JT, et al. Tackling the widespread and critical impact of batch effects in high-throughput data. Nat. Rev. Genet. 2010;11:733–739. doi: 10.1038/nrg2825. [DOI] [PMC free article] [PubMed] [Google Scholar]
Associated Data
This section collects any data citations, data availability statements, or supplementary materials included in this article.