Background: Six mammalian ceramide synthases (CerS) each use acyl-CoAs of defined chain length for N-acylation of the sphingoid base.
Results: A series of chimeric CerS proteins was generated and examined for specificity.
Conclusion: A minimal region of 150 amino acid residues is required for specificity.
Significance: The study paves the way for further structure-function analyses of the CerS.
Keywords: Ceramide, Lipids, Membrane Enzymes, Membrane Lipids, Sphingolipid
Abstract
In mammals, ceramides are synthesized by a family of six ceramide synthases (CerS), transmembrane proteins located in the endoplasmic reticulum, where each use fatty acyl-CoAs of defined chain length for ceramide synthesis. Little is known about the molecular features of the CerS that determine acyl-CoA selectivity. We now explore CerS structure-function relationships by constructing chimeric proteins combining sequences from CerS2, which uses C22-CoA for ceramide synthesis, and CerS5, which uses C16-CoA. CerS2 and -5 are 41% identical and 63% similar. Chimeras containing approximately half of CerS5 (from the N terminus) and half of CerS2 (from the C terminus) were catalytically inactive. However, the first 158 residues of CerS5 could be replaced with the equivalent region of CerS2 without affecting specificity of CerS5 toward C16-CoA; likewise, the putative sixth transmembrane domain (at the C terminus) of CerS5 could be replaced with the corresponding sequence of CerS2 without affecting CerS5 specificity. Remarkably, a chimeric CerS5/2 protein containing the first 158 residues and the last 83 residues of CerS2 displayed specificity toward C16-CoA, and a chimeric CerS2/5 protein containing the first 150 residues and the last 79 residues of CerS5 displayed specificity toward C22-CoA, demonstrating that a minimal region of 150 residues is sufficient for retaining CerS specificity.
Introduction
Ceramide, a bioactive sphingolipid and an important intermediate in the sphingolipid biosynthetic pathway (1–3), consists of a sphingoid long chain base to which a fatty acid is attached via an amide bond (4–6). In mammals, ceramide is synthesized by a family of six ceramide synthases (CerS)2 (7, 8), each of which utilizes a restricted subset of fatty acyl-CoAs to synthesize ceramides with defined acyl chains (9, 10). For example, CerS5 uses C16-CoA (9, 11), and CerS2 uses mainly C22-C24-CoAs (12) to generate C-16- and C22/24-ceramides, respectively.
All mammalian CerS share a distinct domain, the Tram-Lag-CLN8 (TLC) domain, a region of ∼200 residues also found in other proteins (13). The Lag1p motif, which is found within the TLC domain, is a conserved stretch of 52 amino acids (14, 15) and is not found in the two other TLC domain-containing families (TRAM and CLN8). The Lag1p motif has been suggested to be essential for CerS activity (16, 17) and contains a number of residues, including two conserved histidines, which may be involved in catalysis or substrate binding (13). An additional feature shared by mammalian CerS (with the exception of CerS1) is the homeobox (Hox)-like domain, of which the last 12 residues are critical for activity. However, the precise function of the Hox-like domain is not known (15, 18).
Despite their crucial roles in sphingolipid synthesis, the CerS have not been fully characterized, with little information available about the substrate binding sites and mode of selectivity toward different acyl-CoAs. Previous studies have focused on the effect of point mutations, with a number of critical residues identified, such as six conserved residues in the Lag1p motif of CerS1 and CerS5 (16) and a number of critical residues in the yeast homolog, Lag1p (17) (Fig. 1).
FIGURE 1.
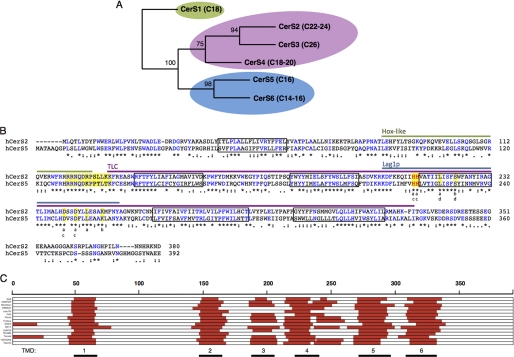
CerS phylogeny, sequence comparison, and topology. A, shown is a phylogenetic tree of the six human CerS. Bootstrap values (of 100) are indicated. Acyl CoA specificity is shown in parenthesis. Sequences were aligned with ClustalW, and phylogenetic analysis was performed with Maximum likelihood (proml, from the phylip package); similar results were obtained with Neighbor Joining and both phylogenetic algorithms on a Muscle alignment. B, shown is a comparison of hCerS2 and hCerS5 sequences by ClustalW multiple alignments. The asterisks (*) indicate identical residues (in blue), colons (:), and periods (.) indicate similar residues, with colons indicating more similarity than periods. The two conserved histidine residues are in red, and predicted transmembrane domains are in boxes. The lines above the sequences indicate the three major domains: Hox-like domain (green), TLC domain (purple), and Lag1p-motif (blue). Residues highlighted in yellow at the border of the TLC domain indicate 12 residues shown to be important for activity (18); residues highlighted in yellow in the Lag1p motif indicate equivalent residues to those previously mutated in either CerS1 or CerS5 or in yeast Lag1p: a, mutated in mouse CerS resulting in loss of activity; b, mutated in mouse CerS without affecting activity (16); c, mutated in yeast Lag1 resulting in loss of activity; d, mutated in yeast Lag1 without affecting activity (17). C, shown are transmembrane predictions of hCerS5 performed with DAS TMfilter, HMMTOP, MemBrain, MEMSAT, oreinTM, PHD, Philius, Phobius, SOSUI, Split 4.0, SVMTM, TMHMM, Tmpred, TOPCONS, and Toppred. The red lines indicate a putative transmembrane domain suggested by each of the prediction programs. The numbered black lines indicating membrane-spanning domains are taken from the PHD prediction, which is used throughout the study. TMD, transmembrane domain.
In this study we explore structure-function relationships of CerS by generating chimeric proteins containing different regions of CerS5 and CerS2 and determine a minimal region of 150 residues required for CerS specificity toward acyl-CoAs. This is the first study to directly address the mode of acyl-CoA selectivity of CerS rather than their catalytic activity and paves the way for future studies investigating the structural features required to determine specificity.
EXPERIMENTAL PROCEDURES
Materials
d-erythro-[4,5-3H]Sphinganine was synthesized as described (19). Fatty acyl-CoAs were from Avanti Polar Lipids (Alabaster, AL). Defatted bovine serum albumin and an anti-FLAG antibody were from Sigma. An anti-glyceraldehyde-3-phosphate dehydrogenase (GAPDH) antibody was from Millipore. Horseradish peroxidase was from The Jackson Laboratory (Bar Harbor, ME). An ECL detection system was from Amersham Biosciences. Cycloheximide was from Sigma. Silica gel 60 thin layer chromatography plates were from Merck. Restriction enzymes and reagents were from New England Biolabs. All solvents were of analytical grade and were purchased from Bio-Lab (Jerusalem, Israel).
Cloning CerS Chimeras
ClustalW multiple alignment was performed to compare CerS2 and CerS5 sequences. After designing the chimeras, sequences were generated using a computer algorithm to produce the constructs and primers. CerS5 and CerS2 were used as templates for elongation of the desired region from each protein, and PCR amplification of the products was performed and executed automatically by programmable robots under computer control (20). PCR products were cloned into a pCMV-Tag2B (EcoR1/Xho1) vector carrying an N-terminal FLAG tag. Constructs C2:C5152–309:C2 and C2:C5159–309:C2 (for terminology, see Fig. 2) were subcloned from C2:C5152–392, C2:C5159–392, and C51–309:C2, and C5:C2144–332:C5 and C5:C2151–301:C5 were subcloned from CerS5 and CerS2, all using restriction-free cloning (21). Primers are given in Table 1. The sequences of all chimeras were confirmed before use.
FIGURE 2.
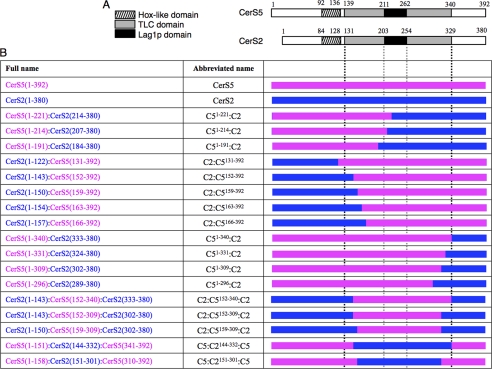
Chimeras of CerS2 and CerS5. A, shown is a schematic representation of the three distinguishing domains of mammalian CerS5 and CerS2: Hox-like domain (stripes), TLC domain (gray), Lag1p motif (black). B, shown is a schematic representation of the 17 chimeras used in this study. The left column gives the name of the protein and the amino acid residues used; for instance, CerS2(1–143):CerS5(152–392) consists of the first 143 residues of CerS2 (in blue) and residues 152–392 of CerS5 (in pink); note the discrepancy in the numbering of CerS5 and CerS2, as CerS2 contains 12 residues less than CerS5. The abbreviated names used throughout the text are shown in the middle column. The right column shows a schematic representation of the chimeric proteins with CerS5 in pink and CerS2 in blue. The black vertical dotted lines indicate the beginning and end of the TLC domain, and the gray dotted vertical lines indicate the boundaries of the Lag1p motif.
TABLE 1.
Primers used in this study
F, forward; R, reverse.
| Constructa | Primers | |
|---|---|---|
| CerS2 | F | 5′- CCGAATTCCTCCAGACCTTGTATGATTACTTCTGb |
| R | 5′- CCCTCGAGTCAGTCATTCTTACGATGGTTGTTATTGAGGATGGGGb | |
| CerS5 | F | 5′- CCGAATTCGCGACAGCAGCGCAGGGACCCb |
| R | 5′- CCCTCGAGTTACTCTTCAGCCCAGTAGCTGCCTCCCATb | |
| C51–221:C2 | F | 5′- TGTTTGTGCATCACGTGGCCACCATCATTCTCb |
| R | 5′- TGGTGGCCACGTGATGCACAAACATGATCAGGAAGb | |
| C51–214:C2 | F | 5′- CAGTTTACAGACATTAAAAGAAAGGACTTCAAGGAACAGATCATCCACb |
| R | 5′- GTTCCTTGAAGTCCTTTCTTTTAATGTCTGTAAACb | |
| C51–191:C2 | F | 5′- TTCAAGTGGGCTTTATCACTATTATATGATTGAACTTTCCTTCTACTGGTCCb |
| R | 5′- AAGTTCAATCATATAATAGTGATAAAGCCCACTTb | |
| C2:C5131–392 | F | 5′- TCGCCGCCGCAATCAGGACAAGCCCCCAACGCb |
| R | 5′- GTTGGGGGCTTGTCCTGATTGCGGCGGCGACGGb | |
| C2:C5152–392 | F | 5′- AGCCAGCTGGAGATTCACATTTTACTTATGTATATTCTGCTATGGAATTAGAb |
| R | 5′- ATATACATAAGTAAAATGTGAATCTCCAGCTGGCTTCb | |
| C2:C5159–392 | F | 5′- GCCTTCATTGCCGGCATTAGATTTCTCTGGTCGTCACCTTb |
| R | 5′- CCAGAGAAATCTAATGCCGGCAATGAAGGCb | |
| C2:C5163–392 | F | 5′- TCGTCACCTTGGTTCTGGGAb |
| R | 5′- CTGTCGGATGTCCCAGAACCAAGGTGACGACCAAATGACGGCCATGCCGGCAAb | |
| C2:C5166–392 | F | 5′- CATTGTGGATAAACCTTGGTTCTGGGACATCCGACAb |
| R | 5′- ATGTCCCAGAACCAAGGTTTATCCACAATGACGGCCATGb | |
| C51–340:C2 | F | 5′- TTTGAAAGCCTTGATCGGAAAGCTGGTAGAAGATGAACGb |
| R | 5′- TCTACCAGCTTTCCGATCAAGGCTTTCAAAGCAATCCGb | |
| C51–331:C2 | F | 5′- GCGCATGGCCCACAAGb |
| R | 5′-TTTCCAGTTATGAACTTGTGGGCCATGCGCAAAATTAGGTAGGACCAGATGACATGCAb | |
| C51–309:C2 | F | 5′- CGGGCCTTATGCTTCATATTACTTCTTCAATTCCATGATGGGAb |
| R | 5′- TTGAAGAAGTAATATGAAGCATAAGGCCCGATTATCb | |
| C51–296:C2 | F | 5′- ACGACCCTGGTGTACCCACTGGAb |
| R | 5′- ATAGAGCTCCAGTGGGTACACCAGGGTCGTGTTCAGAATCCAGAATGb | |
| C2:C5152–340:C2 | F | 5′- GATTCACATTTTACTTATGTATATTCTGCTAT |
| R | 5′- AGCAGAATATACATAAGTAAAATGTGAATCTCCAGCTGGC | |
| C2:C5152–309:C2 and C2:C5159–309:C2 | F | 5′- GATAATCGGGCCTTATGCTTCATATTACTTCTTCAATTCCATGc |
| R | 5′- GGTACCGGGCCCCCCCTCGAGTCc | |
| C5:C2144–332:C5 | F | 5′- GAAAGCATGTGGAGATTCACATTTTATCTGATTGCCTTCATTGCCGGCd |
| R | 5′-GATCATCCTTCGATACCTTTCCCCTAGTTATGAACTTGTGGGCCATGCd | |
| C5:C2151–301:C5 | F | 5′- CATTTTATTTATGTATATTCTGCTATGGAATGGCCGTCATTGTGGATAAACCd |
| R | 5′- GCAGGCCATTGAGGAGCCACCAGCCAAAGAAGGCAGGATAGAGCd |
a The terminology used for each construct is given in Fig. 2.
b External and matching internal primers were used to amplify the desired regions from CerS2 or CerS5 templates.
c Used to amplify desired regions from C51–309:C2 and subsequently inserted into C2:C5152–392 or C2:C5159–392 by restriction free cloning.
d Used to amplify regions from CerS2 and subsequently inserted into CerS5 by restriction free cloning.
Cell Culture and Transfection
Human embryonic kidney (HEK) 293T cells were cultured in Dulbecco's modified Eagle's medium supplemented with 10% fetal calf serum, 100 IU/ml penicillin, and 100 μg/ml streptomycin. Transfection of HEK 293T cells was performed by the calcium phosphate method using 0.25 μg of plasmid per cm2 of culture dish.
Ceramide Synthase Assays
Thirty-six hours after transfection, HEK 293T cells were removed from culture dishes and washed twice with phosphate-buffered saline. Cells were homogenized in 20 mm HEPES-KOH, pH 7.2, 25 mm KCl, 250 mm sucrose, and 2 mm MgCl2 containing a protease inhibitor mixture (Sigma). Protein was determined using the Bradford reagent (Bio-Rad). Homogenates (100 μg of protein in 250 μl of buffer) were incubated with 0.25 μCi of [4,5-3H]sphinganine, 15 μm sphinganine (Matreya, Pleasant Gap, PA), 20 μm defatted bovine serum albumin, and 50 μm fatty acyl-CoA for 20 min at 37 °C. Lipids were extracted and separated by thin layer chromatography using chloroform, methanol, and 2 m NH4OH (40:10:1, v/v/v) as the developing solvent. 3H-Labeled lipids were visualized using a phosphorimaging screen (Fuji, Tokyo, Japan), recovered from the thin layer chromatography plates by scraping the silica directly into scintillation vials, and quantified by liquid scintillation counting. Levels of expression of each chimeric protein were confirmed by Western blotting.
Cycloheximide Chase
Twenty-four hours after transfection of HEK cells with various FLAG-tagged CerS constructs, cells were resuspended in phosphate-buffered saline and treated with cycloheximide (65 μg/ml) (22, 23) for 0, 1, 2, or 4 h, harvested, and analyzed by Western blotting.
Western Blotting
Proteins were separated by SDS-PAGE and transferred to nitrocellulose membranes. FLAG-tagged constructs were identified using a mouse anti-FLAG antibody (1:10,000 dilution) and goat anti-mouse horseradish peroxidase (1:10,000 dilution) as a secondary antibody. Equal loading was confirmed using a mouse anti-GAPDH antibody. Detection was performed using the ECL detection system.
Bioinformatics
Homology profiling of human CerS2 and CerS5 was performed using Geneious Version 5.3.6 for Mac (24). A sliding window alignment was performed with parameters of an identity of 20 and height of 95. Alignment of all the human CerS (CerS1, NP_067090.1; CerS2, NP_071358.1; CerS3, NP_849164.2; CerS4, NP_078828.2; CerS5, NP_671723.1; CerS6, NP_982288.1) was performed using ClustalW Version 2.0.12 and Muscle Version 3.8.31 (25, 26). Phylogenetic analysis was performed using Neighbor-Joining in the ClustalW package and Proml in the Phylip package (Version 3.69) (27). Similar results were obtained with all combinations of alignment and tree algorithms. The trees were visualized with FigTree 1.3.1. Transmembrane prediction was performed with the following programs using default parameters unless otherwise noted: DAS TMfilter (TM-library size 8, 16) (28), HMMTOP (29), MemBrain (30), MEMSAT (31), oreinTM (pred-tmr2) (32), PHD (33), Philius (34), Phobius (35), SOSUI (36), Split 4.0 (37), SVMTM (38), TMHMM (39), Tmpred (40), TOPCONS (41), and Toppred (-e, Kyte-Doolittle hydropathy) (41).
Electrospray Ionization-Tandem Mass Spectrometry (MS/MS)
Sphingolipid analyses by electrospray ionization-MS/MS were conducted using a PE-Sciex API 3000 triple quadrupole mass spectrometer and an ABI 4000 quadrupole-linear ion trap mass spectrometer (7, 42–44).
Statistics
Statistical significance was assessed using an unpaired one-tailed Student's t test, with a p value of <0.05 considered statistically significant.
RESULTS
Comparison of CerS2 and CerS5
The six mammalian CerS are homologous transmembrane proteins with sequence similarity between 30 and 80%. Phylogenetic analysis reveals that the Hox-like domain-containing family members divide into two distinct branches, CerS2, -3, and -4 and CerS5 and -6 (Fig. 1A), with the former using mainly very long chain acyl-CoAs (C18–26) and the latter using long chain (C14–16) CoAs. To attempt to delineate regions determining acyl-CoA specificity, one representative member of each branch was chosen, namely CerS2 and CerS5. Human CerS2 (hCerS2) contains 380 residues, whereas CerS5 contains 392 residues, with the additional residues located at both the N and C termini, resulting in a discrepancy in the numbering of equivalent residues in each protein. A comparison of the sequences of CerS2 and CerS5 along with other important features is illustrated in Fig. 1B.
Mammalian CerSs are located in the endoplasmic reticulum with their active site probably facing the cytosol (19). Because the transmembrane topology of the mammalian CerS has not been resolved experimentally, we compared several prediction programs to assess topology (Fig. 1C). Most programs suggest that the CerS have six membrane-spanning domains (10, 33). However, significant disagreement between the various prediction programs was noted for the fourth putative transmembrane domain, in which the Lag1p motif is located, with some programs suggesting one membrane-spanning domain in this region and others, two. Although the transmembrane topology of the CerS does not have direct bearing on the experimental results presented herein, we nevertheless depict the CerS as having six transmembrane domains, based on the results of the PHD program.
We next performed multiple alignment analysis of CerS2 and CerS5 from different species, and chose various regions for generation of chimeric proteins, such as the area adjacent to the TLC domain, the Lag1p motif, and putative transmembrane domains. Additional chimeras were subsequently prepared based on results of the initial analyses to give a total of 17 chimeric proteins (Fig. 2). Similar levels of transfection were obtained for most chimeric proteins (Fig. 3), and in those cases where differences in expression were observed, no correlation with activity (see below) was detected. The specific activity of each construct was compared with the specific activity of CerS5 (using C16-CoA as substrate) and of CerS2 (using C22-CoA).
FIGURE 3.
Expression levels of chimeric proteins. Levels of expression of the FLAG-tagged constructs ascertained by Western blotting using an anti-FLAG antibody. An anti-GAPDH antibody was used as loading control. Molecular weight markers are shown. The Western blot is a typical experiment repeated between two-four times.
Preliminary Analysis of CerS2 and CerS5 Chimeras
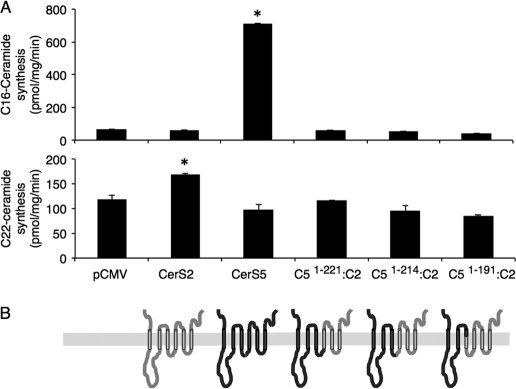
Initial studies were performed in which large sequences were exchanged between CerS5 and CerS2. The initial construct contained the first 221 residues of CerS5 attached to the C-terminal sequence of CerS2; residue 221 in CerS5 is one of the two conserved histidines within the Lag1p motif (Figs. 1 and 2). Two additional constructs, with the first 214 and 191 residues of CerS5, respectively, attached to the C terminus of CerS2, were also generated; in the latter, all of the Lag1p motif was provided by CerS2 (Fig. 2). None of the three chimeras displayed any activity toward C16- or C22-CoA (Fig. 4). This suggests that (i) the first 221 residues of CerS5 are not sufficient for its activity or specificity when attached to the C terminus of CerS2 and (ii) the last 196 residues of CerS2 are not sufficient for activity toward C22-CoA even when the entire Lag1p motif is provided by CerS2. Together, the data demonstrate that appropriate interactions between the N and C termini of CerS proteins are essential for their activity.
FIGURE 4.
CerS5 and CerS 2 activity in chimeras containing the N terminus of CerS5 and the C terminus of CerS2. A, homogenates (100 μg of protein) were prepared from cells overexpressing the indicated constructs (for terminology, see Fig. 2). CerS5 activity was assayed using C16-CoA (upper panel) and CerS2 using C22-CoA (lower panel). Results are the means ± S.D. of a typical experiment repeated three times with similar results. *, p < 0.05. B, putative membrane topology of each construct is shown. The topology is based on six predicted transmembrane domains (Fig. 1); regions provided by CerS5 are shown in dark gray and CerS2 are in light gray.
Chimeras Containing the C Terminus of CerS5
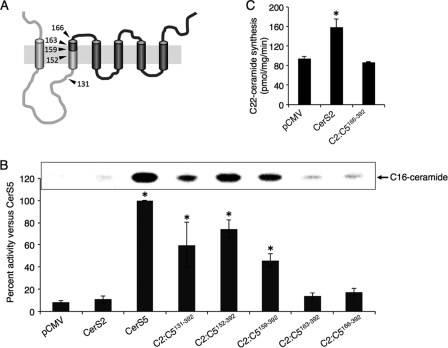
We next generated chimeras in which the N terminus was provided by CerS2 and the C terminus by CerS5. Five constructs were prepared in which 131, 152, 159, 163, or 166 N-terminal residues of CerS5 were replaced by the corresponding residues of CerS2 (Figs. 2 and 5A). Levels of C16-ceramide synthesis by C2:C5131–392, C2:C5152–392, and C2:C5159–392 were similar to native CerS5 (Fig. 5B). No activity toward C16-CoA was displayed by chimeras containing more than 159 residues provided by the N terminus of CerS2 (Fig. 5B). None of the chimeric proteins displayed any activity using C22-CoA (Fig. 5C and data not shown). These results demonstrate that (i) the 158 N-terminal residues (including the first putative transmembrane domain and most of the second putative transmembrane domain) of CerS5 are not required for its specificity as they can be replaced by the corresponding residues from CerS2 and (ii) the Hox-like domain (including the 12 amino acid domain at the border of the Hox-like and TLC domains that were shown to be essential for activity (18)) is not required for specificity.
FIGURE 5.
CerS5 and 2 activity in chimeras containing the N terminus of CerS2 and the C terminus of CerS5. A, putative membrane topology of construct C2:C5159–392 with the CerS2 sequence is in light gray, and CerS5 is in dark gray; arrowheads mark the positions of the other chimeras presented in this figure. B, homogenates (100 μg of protein) were prepared from cells overexpressing the indicated constructs and activity assayed using C16-CoA. Results are the means ± S.E. for 3–8 individual experiments performed in duplicate and are expressed as percent of the activity of native CerS5. *, p < 0.05. The upper panel shows part of a thin layer chromatography plate illustrating levels of C16-[3H]dihydroceramide synthesis for each construct in a typical experiment. C, shown is activity of C2:C5166–392 using C22-CoA compared with native CerS2. Results are the means ± S.D. of a typical experiment repeated 3 times with similar results. *, p < 0.05.
Chimeras Containing the C Terminus of CerS2
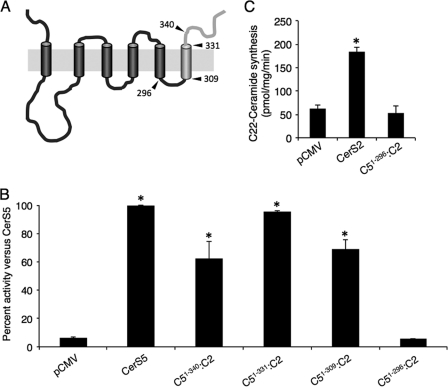
We examined the role of the C terminus in determining specificity. Chimeras were generated containing 296, 309, 331, or 340 N-terminal residues of CerS5 with the remaining C-terminal residues provided by CerS2 (Figs. 2 and 6A). In chimeras containing >309 residues from CerS5, significant activity using C16-CoA was detected, but no activity was detected in a chimeric protein containing only 296 residues of CerS5 (Fig. 6B). C51–296:C2 did not display any activity using C22-CoA (Fig. 6C). We, therefore, conclude that the 83 C-terminal residues of CerS5, which contain the putative sixth transmembrane domain, are not required for specificity and that a region containing 13 residues (residues 296–309, a putative loop between transmembrane domains 5 and 6) is essential for activity.
FIGURE 6.
CerS activity in chimeras containing the C terminus of CerS2. A, shown is the putative membrane topology of construct C51–309:C2, with the CerS2 sequence in light gray and CerS5 in dark gray; arrowheads mark the positions of the other chimeras presented in this figure. B, homogenates (100 μg of protein) were prepared from cells overexpressing the indicated constructs and CerS5 activity assayed using C16-CoA. Results are the means ± S.D. for two individual experiments performed in duplicate and are expressed as percent of the activity of native CerS5. *, p < 0.05. C, shown is activity of C51–296:C2 using C22-CoA compared with native CerS2. Results are the means ± S.D. *, p < 0.05.
To test the possibility that the lack of activity of some of the constructs was due to misfolding or instability of the chimeric proteins, we examined the stability of various chimeras after blocking de novo protein synthesis using cycloheximide. There was no difference in stability of any of the constructs after 2 h, with small changes in stability 4 h after the addition of cycloheximide (Fig. 7). However, there was no correlation between stability and activity. For instance, C51–331:C2 gives high levels of activity, whereas C51–296:C2 did not display any activity (Fig. 6), although both appeared equally stable (Fig. 7). It should be noted that the half-life of CerS2 and CerS5 and the CerS2/5 chimeras is considerably longer than another CerS, CerS1 (23).
FIGURE 7.
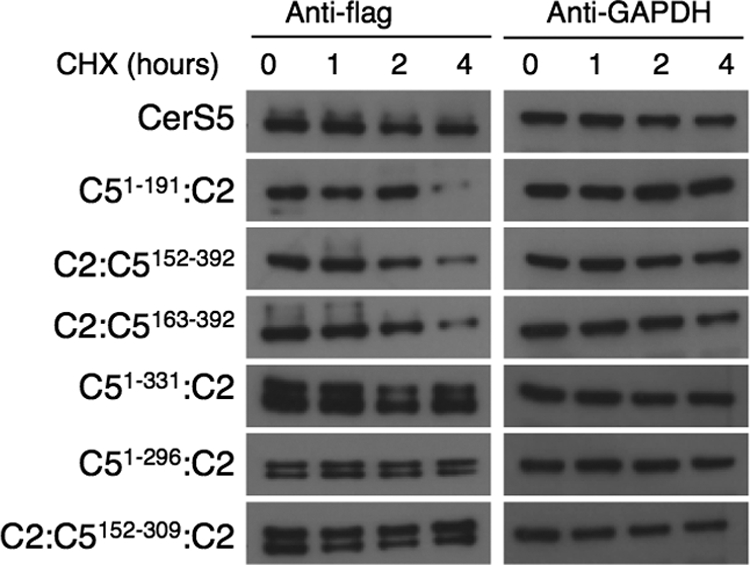
Protein stability after cycloheximide treatment. Western blotting of chimeric proteins was performed at various times after addition of cycloheximide. GAPDH was used as a loading control. The Western blot is a typical experiment repeated up to three times.
The Minimal Region of CerS5 and CerS2 Required for Specificity
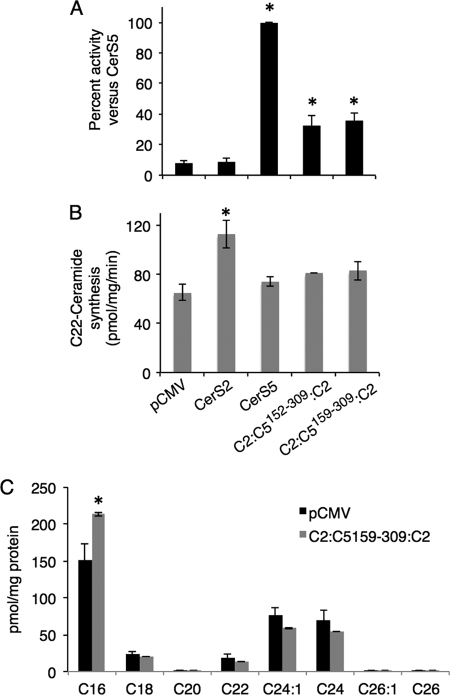
We combined some of the constructs generated above to determine the minimal region of CerS5 required for specificity. Three chimeras were prepared in which the N and C termini were provided by CerS2 and the middle portion by CerS5. C2:C5152–340:C2 displayed essentially the same activity as native CerS5 using C16-CoA as substrate even though 47% of the protein sequence was provided by CerS2 (Fig. 8). Two additional chimeras, C2:C5152–309:C2 and C2:C5159–309:C2, were also able to utilize C16-CoA as substrate, exhibiting 30–40% of the activity of native CerS5 (Fig. 9A). Remarkably, C2:C5159–309:C2 (see Fig. 11), which only contains ∼40% of the CerS5 sequence, was still able to use C16-CoA as substrate, albeit at lower levels than native CerS5. None of the three constructs displayed any activity toward C22-CoA (Fig. 9B and data not shown). The stability of C2:C5159–309:C2 was similar to that of CerS5 (Fig. 7). The ability of C2:C5159–309:C2 to generate C16-ceramide was confirmed by electrospray ionization-MS/MS in which there was a significant increase in C16-ceramide in cells overexpressing C2:C5159–309:C2 (Fig. 9C). These results demonstrate that large areas from the N and C termini of CerS5 can be replaced with the homologous residues in CerS2 without affecting the specificity of CerS5 toward C16-CoA.
FIGURE 8.

CerS activity in chimera C2:C5152–340:C2. A, homogenates (100 μg of protein) were prepared from cells overexpressing C2:C5152–340:C2, and activity was assayed using C16-CoA. Results are the means ± S.D. for two individual experiments performed in duplicate and are expressed as percent of CerS5 activity. B, putative membrane topology of the constructs with the CerS2 sequence in light gray and CerS5 in dark gray.
FIGURE 9.
CerS5 specificity of constructs containing the N and C termini of CerS2. A, homogenates (100 μg of protein) were prepared from cells overexpressing the indicated constructs and CerS5 activity assayed using C16-CoA. Results are the means ± S.E. for seven-eight individual experiments performed in duplicate and are expressed as percent of CerS5 activity. *, p < 0.01. B, homogenates (100 μg of protein) were prepared from cells overexpressing the indicated constructs, and CerS2 activity was assayed using C22-CoA. Results are the means ± S.D., n = 2. *, p < 0.05. C, the fatty acid composition of ceramide was determined by electrospray ionization-MS/MS in pCMV- and C2:C5159–309:C2-overexpressing cells. *, p < 0.05.
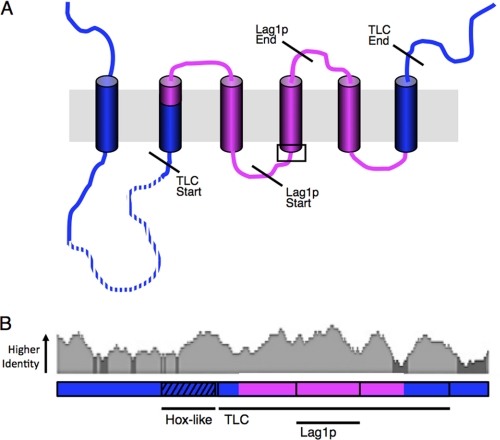
FIGURE 11.
CerS specificity resides within 150 residues in the TLC domain. A, shown is putative membrane topology of CerS. Regions in blue are not involved in specificity, whereas the regions in pink are involved in specificity. The dotted line indicates the Hox-like domain; diagonal lines indicate the beginning and end of the TLC domain and the Lag1p motif. The area in the box indicates the location of the conserved histidine residues. B, human CerS5 and CerS2 homology patterns are presented as a sliding window identity alignment, indicating areas of <30% identity (dark gray) and >30% identity (light gray). A linear diagram of CerS is shown below, indicating areas involved in specificity (pink) and areas not required for specificity (blue).
Finally, we generated two additional chimeras in which the N and C termini were provided by CerS5 and the middle portion by CerS2. C5:C2144–332:C5 and C5:C2151–301:C5 (Fig. 10C) displayed similar activity to CerS2 using C22-CoA as substrate (Fig. 10B) with no activity using C16-CoA (Fig. 10A). C5:C2151–301:C5 contains only ∼40% of the CerS2 sequence, similar to the amount of the CerS5 sequence remaining in C2:C5159–309:C2, indicating that the specificity of both CerS2 and CerS5 is determined within a region of 150 amino acids.
FIGURE 10.
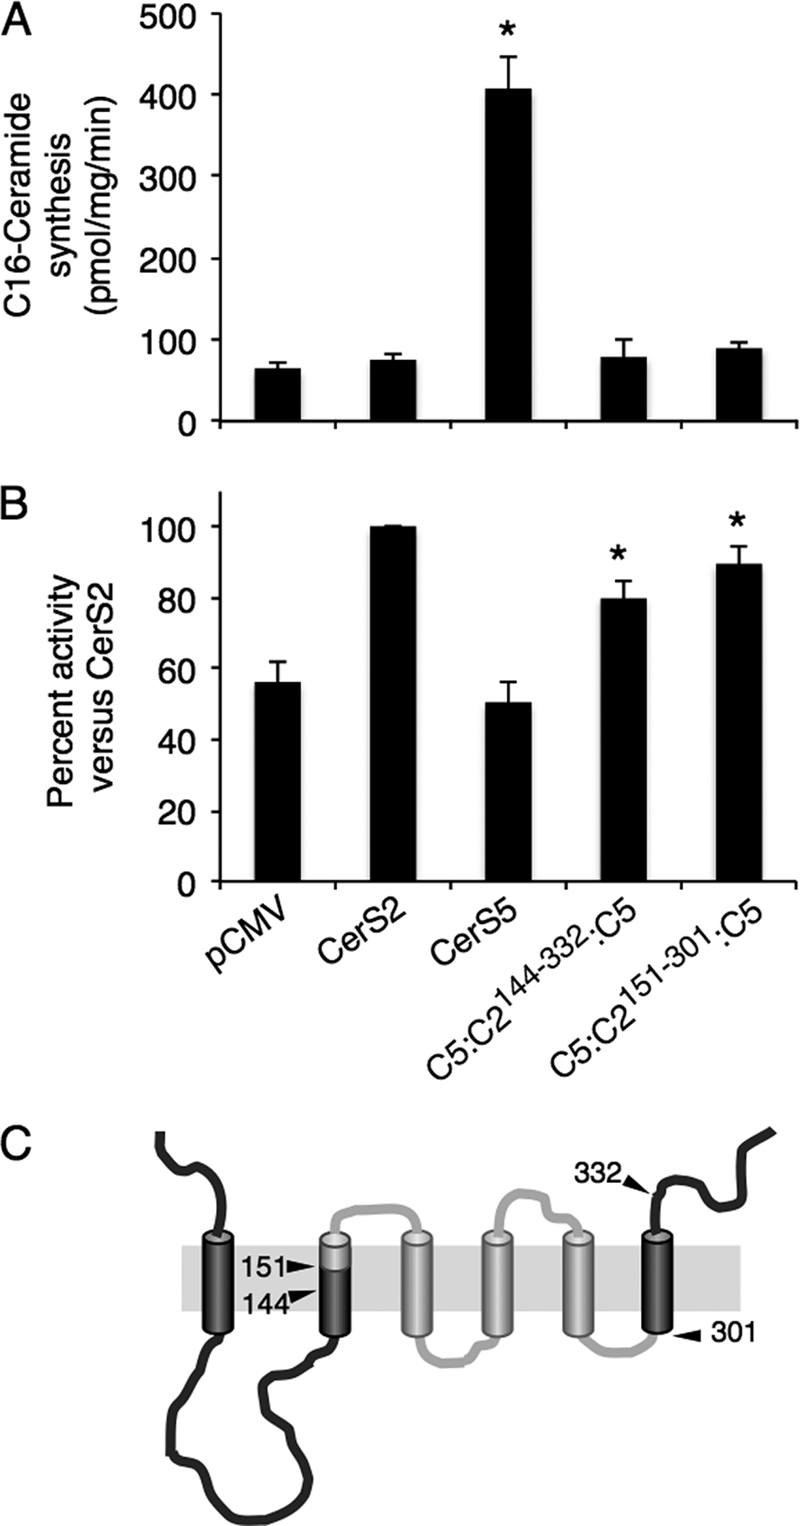
CerS2 specificity of constructs containing the N and C termini of CerS5. A, homogenates (100 μg of protein) were prepared from cells overexpressing the indicated constructs, and CerS5 activity was assayed using C16-CoA. Results are the means ± S.D. *, p < 0.05. B, homogenates (100 μg of protein) were prepared from cells overexpressing the indicated constructs, and CerS2 activity was assayed using C22-CoA. Results are the means ± S.E. for three individual experiments performed in duplicate and are expressed as percent of CerS2 activity. *, p < 0.05. C, shown is putative membrane topology of construct C5:C2151–301:C5 with the CerS2 sequence in light gray and CerS5 in dark gray.
DISCUSSION
In this study we undertook a systematic analysis of structure-function relationships of CerS proteins. Unfortunately, no three-dimensional structures of the CerS are available due to difficulties in crystallizing multi membrane-spanning proteins, so approaches to determine structure-function relationships, such as membrane topology and characterization of the active site, currently rely on manipulation of the primary sequence. To this end we generated a series of chimeric proteins composed of different regions of CerS5 and CerS2. These proteins were chosen because they have widely different acyl-CoA specificities, allowing easy determination of the substrate preferences of the chimeric proteins. Other structure-function studies of the CerS are quite limited (16–18), with two studies attempting to determine membrane topology (9, 17) and other studies using site-directed mutagenesis to determine residues required for activity (16, 17). Our approach differs from these previous studies inasmuch as we exchanged regions and motifs between CerS5 and CerS2.
The main finding of our study is that a minimal region of 150 residues within the TLC domain is sufficient for maintaining specificity (Fig. 11A). In CerS5 this region is composed of residues 159–309 and is sufficient for maintaining specificity toward C16-CoA, whereas the equivalent region in CerS2 is composed of residues 151–301, which is sufficient to maintain C22-CoA specificity.
Mammalian CerS share significant sequence homology, with hCerS5 and hCerS2 41% identical and 63% similar. Interestingly, the middle region of the proteins (residues 159–309 in CerS5 and residues 151–301 in CerS2) is more conserved than the N- and C-terminal portions (Fig. 11B). This result is somewhat surprising because we assumed that the acyl chain specificity would be determined in areas of lower conservation.
A number of additional conclusions can be extrapolated from our data. First, residues 159–309 in CerS5 and 151–301 in CerS2 are involved in determining specificity, whereas the conserved TLC domain extends from residues 139–340 in CerS5 and 131–329 in CerS2, suggesting that the initial 20 and last 31 residues of the TLC domain have a function other than determining specificity. Of these 51 residues, 25 differ between CerS2 and CerS5 but do not play any role in the acyl-CoA specificity of the two proteins.
Second, although the precise membrane topology of the CerS is not known, our data provide hints about possible modes of interaction between different regions of the proteins. For instance, the data suggest an interaction between the beginning of putative transmembrane domain 2 and residues before residue 131, either at the end of first putative transmembrane domain or in the loop between them, as C2:C5131–392 has less activity than C2:C5152–392.
Third, the end of the second putative transmembrane domain (from residue 159 in CerS5, Fig. 11) plays a key role in activity. Residues toward the C terminus of this domain differ significantly between CerS5 and CerS2, with the former containing more bulky and polar residues. Specifically, residue 160 of CerS5 is an arginine, whereas the equivalent residue in CerS2 (residue 152) is alanine; site-directed mutagenesis of this residue in CerS2 (CerS2A152R) had no effect on its activity or specificity (not shown). Fourth, the first putative transmembrane domain, part of the second transmembrane domain, and the sixth transmembrane domain are not involved in acyl-CoA specificity. Finally, the loop between the putative fifth and sixth transmembrane domains appears important for specificity and activity (compare the activities of C51–309:C2 and C51–296:C2) and is worthy of further investigation (Fig. 11). Interestingly, the beginning of this putative loop is the equivalent location of two spontaneous mutations in mouse CerS1 that causes loss of activity (45). Finally, although only 150 residues are needed for specificity, it is clear that the remainder of the protein is required to maintain the three-dimensional structure of the enzyme and presumably to hold the region required for specificity in the right conformation.
In summary, our results indicate that less than 40% of the CerS sequence is involved in determining substrate specificity. These findings pave the way for studies to attempt to reveal the precise role of these 150 residues and the mechanism by which they determine substrate specificity.
Acknowledgments
We thank Prof. Ehud Shapiro (Department of Biological Chemistry, Weizmann Institute of Science) and members of his laboratory for generation of primers and PCR products and Dr. Rotem Sertchook (Department of Biological Services, Weizmann Institute of Science) for help with the transmembrane topology predictions in Fig. 1C.
This work was supported, in whole or in part, by National Institutes of Health Grant GM076217, and by the Israel Science Foundation (1404/07) and the Minerva Foundation.
- CerS
- ceramide synthase
- TLC
- Tram-Lag-CLN8
- h
- human.
REFERENCES
- 1. Kolesnick R. (2002) The therapeutic potential of modulating the ceramide/sphingomyelin pathway. J. Clin. Invest. 110, 3–8 [DOI] [PMC free article] [PubMed] [Google Scholar]
- 2. Hannun Y. A., Obeid L. M. (2002) The ceramide-centric universe of lipid-mediated cell regulation. Stress encounters of the lipid kind. J. Biol. Chem. 277, 25847–25850 [DOI] [PubMed] [Google Scholar]
- 3. Futerman A. H., Riezman H. (2005) The ins and outs of sphingolipid synthesis. Trends Cell Biol. 15, 312–318 [DOI] [PubMed] [Google Scholar]
- 4. Hannun Y. A., Obeid L. M. (2011) Many ceramides. J. Biol. Chem. 286, 27855–27862 [DOI] [PMC free article] [PubMed] [Google Scholar]
- 5. Pewzner-Jung Y., Ben-Dor S., Futerman A. H. (2006) When do Lasses (longevity assurance genes) become CerS (ceramide synthases)? Insights into the regulation of ceramide synthesis. J. Biol. Chem. 281, 25001–25005 [DOI] [PubMed] [Google Scholar]
- 6. Lahiri S., Futerman A. H. (2007) The metabolism and function of sphingolipids and glycosphingolipids. Cell. Mol. Life Sci. 64, 2270–2284 [DOI] [PMC free article] [PubMed] [Google Scholar]
- 7. Riebeling C., Allegood J. C., Wang E., Merrill A. H., Jr., Futerman A. H. (2003) Two mammalian longevity assurance gene (LAG1) family members, trh1 and trh4, regulate dihydroceramide synthesis using different fatty acyl-CoA donors. J. Biol. Chem. 278, 43452–43459 [DOI] [PubMed] [Google Scholar]
- 8. Levy M., Futerman A. H. (2010) Mammalian ceramide synthases. IUBMB Life 62, 347–356 [DOI] [PMC free article] [PubMed] [Google Scholar]
- 9. Mizutani Y., Kihara A., Igarashi Y. (2005) Mammalian Lass6 and its related family members regulate synthesis of specific ceramides. Biochem. J. 390, 263–271 [DOI] [PMC free article] [PubMed] [Google Scholar]
- 10. Stiban J., Tidhar R., Futerman A. H. (2010) Ceramide synthases. Roles in cell physiology and signaling. Adv. Exp. Med. Biol. 688, 60–71 [DOI] [PubMed] [Google Scholar]
- 11. Lahiri S., Futerman A. H. (2005) LASS5 is a bona fide dihydroceramide synthase that selectively utilizes palmitoyl-CoA as acyl donor. J. Biol. Chem. 280, 33735–33738 [DOI] [PubMed] [Google Scholar]
- 12. Laviad E. L., Albee L., Pankova-Kholmyansky I., Epstein S., Park H., Merrill A. H., Jr., Futerman A. H. (2008) Characterization of ceramide synthase 2. Tissue distribution, substrate specificity, and inhibition by sphingosine 1-phosphate. J. Biol. Chem. 283, 5677–5684 [DOI] [PubMed] [Google Scholar]
- 13. Winter E., Ponting C. P. (2002) TRAM, LAG1, and CLN8. Members of a novel family of lipid-sensing domains? Trends Biochem. Sci. 27, 381–383 [DOI] [PubMed] [Google Scholar]
- 14. Jiang J. C., Kirchman P. A., Zagulski M., Hunt J., Jazwinski S. M. (1998) Homologs of the yeast longevity gene LAG1 in Caenorhabditis elegans and human. Genome Res. 8, 1259–1272 [DOI] [PubMed] [Google Scholar]
- 15. Venkataraman K., Futerman A. H. (2002) Do longevity assurance genes containing Hox domains regulate cell development via ceramide synthesis? FEBS Lett. 528, 3–4 [DOI] [PubMed] [Google Scholar]
- 16. Spassieva S., Seo J. G., Jiang J. C., Bielawski J., Alvarez-Vasquez F., Jazwinski S. M., Hannun Y. A., Obeid L. M. (2006) Necessary role for the Lag1p motif in (dihydro)ceramide synthase activity. J. Biol. Chem. 281, 33931–33938 [DOI] [PubMed] [Google Scholar]
- 17. Kageyama-Yahara N., Riezman H. (2006) Transmembrane topology of ceramide synthase in yeast. Biochem. J. 398, 585–593 [DOI] [PMC free article] [PubMed] [Google Scholar]
- 18. Mesika A., Ben-Dor S., Laviad E. L., Futerman A. H. (2007) A new functional motif in Hox domain-containing ceramide synthases. Identification of a novel region flanking the Hox and TLC domains essential for activity. J. Biol. Chem. 282, 27366–27373 [DOI] [PubMed] [Google Scholar]
- 19. Hirschberg K., Rodger J., Futerman A. H. (1993) The long-chain sphingoid base of sphingolipids is acylated at the cytosolic surface of the endoplasmic reticulum in rat liver. Biochem. J. 290, 751–757 [DOI] [PMC free article] [PubMed] [Google Scholar]
- 20. Shabi U., Kaplan S., Linshiz G., Benyehezkel T., Buaron H., Mazor Y., Shapiro E. (2010) Processing DNA molecules as text. Syst. Synth. Biol. 4, 227–236 [DOI] [PMC free article] [PubMed] [Google Scholar]
- 21. van den Ent F., Löwe J. (2006) RF cloning. A restriction-free method for inserting target genes into plasmids. J. Biochem. Biophys. Methods 67, 67–74 [DOI] [PubMed] [Google Scholar]
- 22. Goldfinger M., Laviad E. L., Hadar R., Shmuel M., Dagan A., Park H., Merrill A. H., Jr., Ringel I., Futerman A. H., Tirosh B. (2009) De novo ceramide synthesis is required for N-linked glycosylation in plasma cells. J. Immunol. 182, 7038–7047 [DOI] [PubMed] [Google Scholar]
- 23. Sridevi P., Alexander H., Laviad E. L., Pewzner-Jung Y., Hannink M., Futerman A. H., Alexander S. (2009) Ceramide synthase 1 is regulated by proteasomal mediated turnover. Biochim. Biophys. Acta 1793, 1218–1227 [DOI] [PMC free article] [PubMed] [Google Scholar]
- 24. Drummond A., Ashton B., Buxton S., Cheung M., Cooper A., Duran C., Field M., Heled J., Kearse M., Markowitz S., Moir R., Stones-Havas S., Sturrock S., Thierer T., Wilson A. (2010) Geneious v5.3 [Google Scholar]
- 25. Edgar R. C. (2004) MUSCLE, multiple sequence alignment with high accuracy and high throughput. Nucleic Acids Res. 32, 1792–1797 [DOI] [PMC free article] [PubMed] [Google Scholar]
- 26. Larkin M. A., Blackshields G., Brown N. P., Chenna R., McGettigan P. A., McWilliam H., Valentin F., Wallace I. M., Wilm A., Lopez R., Thompson J. D., Gibson T. J., Higgins D. G. (2007) ClustalW and ClustalX version 2.0. Bioinformatics 23, 2947–2948 [DOI] [PubMed] [Google Scholar]
- 27. Felsenstein J. (1989) PHYLIP-Phylogeny Inference Package (Version 3.2). Cladistics 5, 164–166 [Google Scholar]
- 28. Cserzö M., Eisenhaber F., Eisenhaber B., Simon I. (2002) On filtering false positive transmembrane protein predictions. Protein Eng. 15, 745–752 [DOI] [PubMed] [Google Scholar]
- 29. Tusnády G. E., Simon I. (2001) The HMMTOP transmembrane topology prediction server. Bioinformatics 17, 849–850 [DOI] [PubMed] [Google Scholar]
- 30. Shen H., Chou J. J. (2008) MemBrain, improving the accuracy of predicting transmembrane helices. PLoS One 3, e2399. [DOI] [PMC free article] [PubMed] [Google Scholar]
- 31. Jones D. T. (2007) Improving the accuracy of transmembrane protein topology prediction using evolutionary information. Bioinformatics 23, 538–544 [DOI] [PubMed] [Google Scholar]
- 32. Pasquier C., Hamodrakas S. J. (1999) An hierarchical artificial neural network system for the classification of transmembrane proteins. Protein Eng. 12, 631–634 [DOI] [PubMed] [Google Scholar]
- 33. Rost B. (1996) PHD, predicting one-dimensional protein structure by profile-based neural networks. Methods Enzymol. 266, 525–539 [DOI] [PubMed] [Google Scholar]
- 34. Reynolds S. M., Käll L., Riffle M. E., Bilmes J. A., Noble W. S. (2008) Transmembrane topology and signal peptide prediction using dynamic bayesian networks. PLoS Comput. Biol. 4, e1000213. [DOI] [PMC free article] [PubMed] [Google Scholar]
- 35. Käll L., Krogh A., Sonnhammer E. L. (2007) Advantages of combined transmembrane topology and signal peptide prediction. The Phobius web server. Nucleic Acids Res. 35, W429–W432 [DOI] [PMC free article] [PubMed] [Google Scholar]
- 36. Hirokawa T., Boon-Chieng S., Mitaku S. (1998) SOSUI, classification and secondary structure prediction system for membrane proteins. Bioinformatics 14, 378–379 [DOI] [PubMed] [Google Scholar]
- 37. Jureti D., Zorani L., Zuci D. (2002) Basic charge clusters and predictions of membrane protein topology. J. Chem. Inf. Comput. Sci. 42, 620–632 [DOI] [PubMed] [Google Scholar]
- 38. Yuan Z., Mattick J. S., Teasdale R. D. (2004) SVMtm, support vector machines to predict transmembrane segments. J. Comput. Chem. 25, 632–636 [DOI] [PubMed] [Google Scholar]
- 39. Krogh A., Larsson B., von Heijne G., Sonnhammer E. L. (2001) Predicting transmembrane protein topology with a hidden Markov model. Application to complete genomes. J. Mol. Biol. 305, 567–580 [DOI] [PubMed] [Google Scholar]
- 40. Hofmann K., Stoffel W. (1993) TMbase-A database of membrane spanning protein segments. Biol. Chem. Hoppe-Seyler 374, 166 [Google Scholar]
- 41. Bernsel A., Viklund H., Hennerdal A., Elofsson A. (2009) TOPCONS. consensus prediction of membrane protein topology. Nucleic Acids Res. 37, W465–W468 [DOI] [PMC free article] [PubMed] [Google Scholar]
- 42. Venkataraman K., Riebeling C., Bodennec J., Riezman H., Allegood J. C., Sullards M. C., Merrill A. H., Jr., Futerman A. H. (2002) Upstream of growth and differentiation factor 1 (uog1), a mammalian homolog of the yeast longevity assurance gene 1 (LAG1), regulates N-stearoyl-sphinganine (C18-(dihydro)ceramide) synthesis in a fumonisin B1-independent manner in mammalian cells. J. Biol. Chem. 277, 35642–35649 [DOI] [PubMed] [Google Scholar]
- 43. Sullards M. C., Merrill A. H., Jr. (2001) Analysis of sphingosine 1-phosphate, ceramides, and other bioactive sphingolipids by high-performance liquid chromatography-tandem mass spectrometry. Sci. STKE 2001, pl1. [DOI] [PubMed] [Google Scholar]
- 44. Merrill A. H., Jr., Sullards M. C., Allegood J. C., Kelly S., Wang E. (2005) Sphingolipidomics, high throughput, structure-specific, and quantitative analysis of sphingolipids by liquid chromatography tandem mass spectrometry. Methods 36, 207–224 [DOI] [PubMed] [Google Scholar]
- 45. Zhao L., Spassieva S. D., Jucius T. J., Shultz L. D., Shick H. E., Macklin W. B., Hannun Y. A., Obeid L. M., Ackerman S. L. (2011) A deficiency of ceramide biosynthesis causes cerebellar purkinje cell neurodegeneration and lipofuscin accumulation. PLoS Genet. 7, e1002063. [DOI] [PMC free article] [PubMed] [Google Scholar]


