Background: Dynamic protein-protein interactions play a pivotal role in Kai protein-based circadian oscillations.
Results: The cyclic complex formation of KaiB and its response to a temperature pulse were automatically and noninvasively monitored with fluorescence correlation spectroscopy (FCS).
Conclusion: FCS is a versatile tool to analyze the protein-based circadian system.
Significance: FCS is suitable for the monitoring of biological systems with dynamic protein-protein interactions.
Keywords: ATPases, Circadian clock, Cyanobacteria, Fluorescence correlation spectroscopy, Protein phosphorylation, Protein-protein interactions
Abstract
Dynamic protein-protein interactions play an essential role in cellular regulatory systems. The cyanobacterial circadian clock is an oscillatory system that can be reconstituted in vitro by mixing ATP and three clock proteins: KaiA, KaiB, and KaiC. Association and dissociation of KaiB from KaiC-containing complexes are critical to circadian phosphorylation and dephosphorylation of KaiC. We developed an automated and noninvasive method to monitor dynamic complex formation in real time using confocal fluorescence correlation spectroscopy (FCS) and uniformly labeled KaiB as a probe. A nanomolar concentration of the labeled KaiB for FCS measurement did not interfere with the oscillatory system but behaved similarly to the wild-type one during the measurement period (>5 days). The fluorescent probe was stable against repeated laser exposure. As an application, we show that this detection system allowed analysis of the dynamics of both long term circadian oscillations and short term responses to temperature changes (∼10 min) in the same sample. This suggested that a phase shift of the clock with a high temperature pulse occurred just after the stimulus through dissociation of KaiB from the KaiC complex. This monitoring method should improve our understanding of the mechanisms underlying this cellular circadian oscillator and provide a means to assess dynamic protein interactions in biological systems characterized by rates similar to those observed with the Kai proteins.
Introduction
Regulatory networks that control various physiological processes in cells generally involve protein-protein interactions. Numerous potential interaction partners have been detected using comprehensive yeast two-hybrid screening and mass spectrometric analysis (1–3). Profiles of protein-protein interactions lead to elucidation of their dynamics in cellular regulatory systems. Biochemical analyses of purified proteins in vitro have been used to characterize the interaction dynamics in detail. These approaches usually focus on part of a biological system, reconstitution of which requires significant experimental and theoretical efforts to translate in vitro results to the physiologically relevant dynamics and activities observed in vivo. Thus, there is a need for methods to monitor protein-protein interactions in in vitro reaction systems without affecting the physiological functions of the component. The cyanobacterial circadian oscillator, for example, has been extensively analyzed as an in vitro model of a self-sustaining biological rhythm. Herein, we describe a new method to monitor changes in protein-protein interactions during the cyclic reactions.
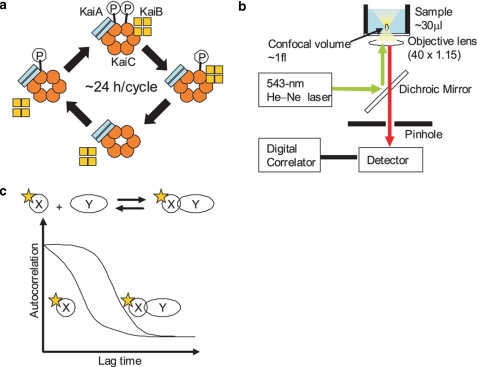
In the cyanobacterium Synechococcus elongatus PCC 7942, the clock proteins KaiA, KaiB, and KaiC are essential for generating circadian rhythms (4). Circadian oscillation of KaiC phosphorylation can be reconstituted by mixing KaiA, KaiB, and KaiC with ATP in vitro (5). The reconstituted system has helped elucidate how Kai proteins cooperatively orchestrate daily rhythms in cyanobacterial cells. The physiological characteristics of the circadian system reflect molecular features in the Kai protein oscillator, such as temperature-compensated KaiC enzymatic activities (ATPase, autophosphorylation, and autodephosphorylation), monomer shuffling between KaiC hexamers, and entrainability following a temperature shift, among others (6–10). KaiC plays a central role in the circadian system, KaiA promotes phosphorylation of KaiC (8, 11), and KaiB preferentially binds to phosphorylated KaiC proteins to inhibit KaiA activity during dephosphorylation phase (Fig. 1a) (8, 12, 13). Cyclic Kai complex formation plays a central regulatory role in circadian rhythms. Interactions among Kai proteins have been detected using gel filtration, immunoprecipitation, and native gel electrophoresis. Each of these methods requires multiple steps, including incubation, aliquot acquisition, gel electrophoresis, and assessment of protein band intensities. These multistep procedures preclude high resolution and precise quantitative analyses of the cyclic protein-protein interactions. Recently, a small-angle x-ray scattering technique was used to assess the dynamics of Kai protein complex formation in real time, although the need for expensive and specialized equipment likely prevents this method from being used for routine analysis (14, 15).
FIGURE 1.
Schematic of the FCS method to assess dynamic protein-protein interactions in the Kai oscillatory system. a, cyclic Kai complex formation in the cyanobacterial circadian system composed of KaiA, KaiB, and KaiC. During the phosphorylation phase, the KaiC complex includes only KaiA, whereas, during the dephosphorylation phase, the KaiC complex includes both KaiA and KaiB. b, a fluorescence correlation spectrometer unit in the MF20 single-molecule fluorescence detection system (Olympus). A 543 nm He-Ne laser is directed through an objective lens and used to excite a fluorescently labeled protein. Fluorescence from a small focal volume (∼1 fl) is detected through a pinhole, and the signal is processed using a digital correlator. c, a schematic diagram of the fluorescence correlation change associated with binding of a labeled protein. Fluctuations in the fluorescent signal are analyzed via an autocorrelation function, and the diffusion time is calculated. The correlation curve shows a rightward shift as the labeled molecule becomes larger, and the diffusion time of the bound form of a fluorescently labeled protein (XY) is longer than that of the free form (X).
Fluorescence techniques allow real-time monitoring of protein-protein interactions in a reaction solution without separation of the free and bound forms (16–18). For instance, fluorescence correlation spectroscopy (FCS)3 is a highly sensitive method that uses confocal optics to measure the size of a fluorescently labeled molecule in a solution (Fig. 1b) (18). Fluctuations of the fluorescence signal in a detection volume of ∼1 fl are analyzed using an autocorrelation function, revealing information about the diffusion properties of the fluorescent complexes; larger average complex sizes are associated with longer diffusion times. Changes in the average diffusion time reflect changes in the complex size and/or the ratio of free fluorescently labeled molecules to those in the complexes (Fig. 1c).
Here, we discuss FCS for monitoring oscillations among the Kai proteins. Association of KaiB with the KaiC complex shows a robust circadian rhythm in the solution and molecular weights of free KaiB and the KaiB-bound KaiC complex markedly differ (Fig. 1a). Association and dissociation of KaiB are essential steps that switch the activity of KaiC between autophosphorylation and autodephosphorylation. Gel-filtration analysis has shown that free KaiB and KaiB-containing complexes are ∼25 and 500 kDa, respectively (8). Because these features of KaiB suggest that the system is suitable for FCS analysis, we prepared fluorescently labeled KaiB and measured diffusion times in the reconstituted oscillatory system for ∼5 days with an automated FCS analyzer. This monitoring system did not interfere with the circadian properties of the samples. We also show that this method is convenient for characterizing the Kai protein oscillation system and likely helpful for analysis of a wide range of the biological systems governed by dynamic protein-protein interactions.
EXPERIMENTAL PROCEDURES
Synthesis and Purification of Fluorescently Labeled KaiB
The coding region of the kaiB gene from S. elongatus PCC 7942 was cloned into the Nde1 and Not1 sites of the pROX-FL expression vector from the In Vitro Pin-point fluorescence labeling kit 543 (Olympus) (4, 19). This vector is designed for an in vitro translation system that allows synthesis of a fluorescent protein with a TAMRA-X-aminophenylalanine (4-((6-(tetramethylrhodamine-5-(and-6)-carboxamido)hexanol)amino)phenylalanine)-containing sequence at the N terminus and a C-terminal hexametric histidine sequence, which can be used to purify the full-length protein. The nucleotide sequence of the N-terminal part was ATGTCTAAACAAATCGAAGTAAACCGGGTCTAATGAG. The four underscored bases, CGGG, create an artificial codon for TAMRA-tRNA (TAMRA-X-aminophenylalanyl-tRNACCCG). When the three-base codon CGG is used instead, translation is terminated at a downstream stop codon in the nucleotide sequence. Protein synthesis with TAMRA-tRNA was carried out using an RTS 100 E. coli HY kit (Roche Diagnostics). The in vitro reaction mixture used to synthesize fluorescently labeled KaiB was prepared according to the manufacturer's instructions and incubated at 30 °C for 2 h. The reaction mixture was then purified using a His Spin Trap Column (GE Healthcare). The elute buffer was exchanged with 20 mm Tris-HCl (pH 8.0), 0.5 mm EDTA, and 100 mm NaCl using a PD-10 gel-filtration column (GE Healthcare). The concentration of fluorescently labeled KaiB was determined using FCS as reported previously (18).
SDS-PAGE
SDS-PAGE was performed on 10–20% gradient gels (PAGEL NPG-R1020L, Atto). A post-gel filtration aliquot of the fraction that was used for FCS analysis was loaded onto the gel. Fluorescence from TAMRA-labeled proteins in the gel was assessed using a Typhoon 9400 gel-imaging system, 532 nm excitation wavelength, and 580BP30 emission filters (GE Healthcare). A protein marker (Prestained XL-Ladder Broad, APRO) was used to estimate protein size.
Reconstitution of the in Vitro Oscillation System
The in vitro oscillation system, including the three Kai proteins and the oscillatory reaction solution, was prepared as described previously (5). The incubation temperature in the MF20 single-molecule fluorescence detection system (Olympus) was set to 28 °C because the performance of the device was better than that observed with the more commonly reported incubation temperature of 30 °C. KaiC phosphorylation was analyzed as described previously (5). Results reported here represent two independent experiments.
High Temperature Pulse Experiment
Samples were exposed to 50 °C for 30 min after which they were cooled at 28 °C for ∼10 min before resuming the FCS analysis.
FCS Analysis
We performed FCS analysis using an MF20 single-molecule fluorescence detection system (Olympus). This system is designed to analyze 384-well glass bottom plates (Olympus) using an onboard 543 nm He-Ne excitation laser. The laser was attenuated to 100 microwatts using density filters and was focused through a water-immersion objective lens at the center of each well, 100 μm above the glass bottom (the confocal volume was ∼1 fl). Fluorescence emitted from a sample was collected via the same objective lens and filtered through an HQ590/60 emission filter (Chroma Technology). The recorded signal intensity was analyzed using a one-component or two-component analytic model. The total sample volumes for FCS analysis were adjusted to 30–50 μl. During FCS analysis, the samples were sealed to prevent evaporation. The measurement time was 10 × 15 s for each data point unless otherwise stated.
Two-component Fitting Analysis of FCS
The MF20 system was equipped with the following two-component analytical model (20):
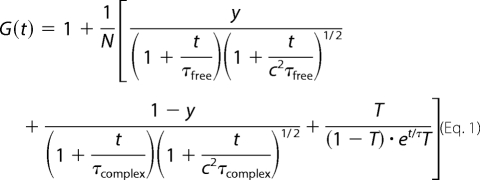 |
where N is the total number of fluorescent particles in the confocal volume, y is the fraction of free probe, τfree is the diffusion time of the free probe, τcomplex is the diffusion time of bound probe, c is a structural parameter of the confocal volume, T is the fraction of probe in the triplet state, and τT is lifetime of the triplet state. To obtain τcomplex and y at the peak of the diffusion time, the values of τfree (482.5 ± 16.6 μs) and c (4.3 ± 0.3) at the phase were determined by using one-component fitting analysis with FCS of the free probe and reference dye, respectively. The value y at each data point in the oscillation was computed using τcomplex at the peak with a correction based on the ratio of the diffusion times of the reference dye at the data collecting time and the peak time. τfree and c at the data collecting time were computed in the free probe and reference dye solution, respectively.
RESULTS
Preparation of Fluorescently Labeled KaiB
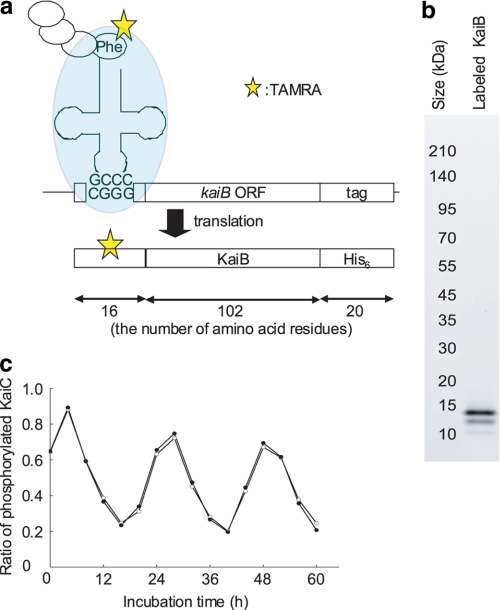
To prepare fluorescently labeled KaiB, we used position-specific incorporation of a fluorescent amino acid based on an expanded genetic codon (Fig. 2a) (18, 21, 22). This method enables uniform labeling of a protein with one fluorescent group at the same amino acid residue. The expression vector was designed to include a four-base codon (5′-CGGG-3′) at the 5′ end of the KaiB coding sequence and a His6 tag coding sequence at the 3′ end (19). Fluorescently labeled KaiB was synthesized using a cell-free translation system. TAMRA-X-aminophenylalanyl-tRNA, which recognizes the four-base codon, was used to introduce the TAMRA-X-aminophenylalanine residue into the protein (see “Experimental Procedures”). We used SDS-PAGE and fluorescent gel imaging to confirm that the fluorescently labeled protein was synthesized. We detected a strong fluorescent signal from TAMRA at ∼15 kDa, which agreed with the calculated molecular mass of full-length TAMRA-KaiB-His6 (∼15.8 kDa) (Fig. 2b).
FIGURE 2.
Preparation of fluorescently labeled KaiB. a, a schematic representation of TAMRA-KaiB-His6 protein synthesis using position-specific incorporation of a fluorescent amino acid in a cell-free translation system with an expanded genetic code. TAMRA-KaiB-His6 is designed to have 16 amino acid residues at the N terminus, including a TAMRA-X-aminophenylalanine residue at the ninth amino acid position, 102 amino acid KaiB residues, and a histidine tag in the 20 amino acid residues at the C terminus (19). b, detecting TAMRA-KaiB-His6 using SDS-PAGE. A 2-μl aliquot of each fraction after gel-filtration purification was examined on a 10–20% gradient gel. TAMRA in the gel was imaged using a Typhoon 9400 system (GE Healthcare). Approximate protein sizes are shown. c, KaiC phosphorylation in the oscillatory solution containing fluorescently labeled KaiB. The standard mixture was prepared with or without TAMRA-KaiB-His6 and incubated at 30 °C (5). Aliquots were collected every 4 h and subjected to SDS-PAGE analysis to measure KaiC phosphorylation levels. Filled and open circles indicate the ratios of phosphorylated KaiC to total KaiC in the standard mixture with and without TAMRA-KaiB-His6, respectively.
We next assessed the effects of TAMRA-KaiB-His6 on oscillations of Kai proteins. The standard mixture for the oscillatory reaction contained 1.2 μm KaiA, 3.5 μm KaiB, 3.5 μm KaiC, and 1 mm ATP. The mixture was incubated at 30 °C for 60 h. The level of phosphorylated KaiC showed a robust oscillation with a period of ∼22 h (Fig. 2c), as reported previously (5). We also prepared samples in which TAMRA-KaiB-His6 was added to the standard mixture to a final concentration of 1 nm, a concentration that allowed FCS analysis. These samples contained ∼3500 times more wild-type KaiB molecules than TAMRA-KaiB-His6 molecules. Oscillation of KaiC phosphorylation was essentially identical to that observed in the standard mixture, suggesting that this concentration of TAMRA-KaiB-His6 did not interfere with the Kai protein-mediated circadian rhythm.
Interactions between the KaiB Probe and Other Kai Proteins
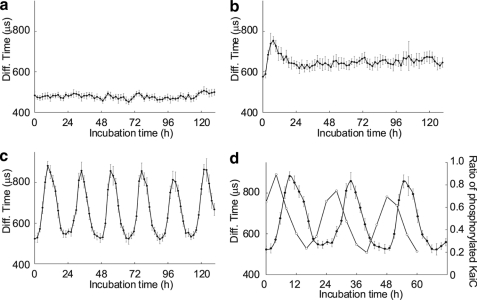
We then used an MF20 single-molecule fluorescence detection system (Olympus), an automatic FCS analyzer formatted for a 384-well microplate, to monitor interactions between KaiB protein and the KaiC-based complex in the oscillatory reaction. First, we determined whether we could detect the interaction of KaiB protein with KaiC protein using the TAMRA-KaiB-His6 protein as the probe. We prepared 30-μl samples containing 1 nm TAMRA-KaiB-His6 and 3.5 μm KaiB. We analyzed the same well every 2 h for >5 days. As shown in Fig. 3a, the average diffusion time obtained from a one-component analytic model showed little change between 450 μs and 510 μs during the observation period. In contrast, the solution containing 1 nm TAMRA-KaiB-His6, 3.5 μm KaiB, and 3.5 μm KaiC revealed changes in the diffusion time of TAMRA-KaiB-His6 (Fig. 3b). At the first measurement point, the diffusion time was 575.7 ± 11.6 μs, which is longer than that observed in the solution containing only the probe and KaiB (Fig. 3a). This indicated that some TAMRA-KaiB-His6 molecules rapidly bound to KaiC proteins. The diffusion time increased to 753.5 ± 20.5 μs after an incubation period of 7.5 h and then gradually decreased until the 24-h time point. For more than 4 days after the initial incubation period of 24 h, the diffusion time was relatively constant at ∼650 μs. These data suggested that the KaiC-bound fraction of TAMRA-KaiB-His6 increased until 7.5 h after the solution was mixed, decreased over the next 16.5 h, and then remained constant. The kinetics of KaiB binding to KaiC in this FCS analysis was consistent with that observed with pulldown assays (8). Of note, we did not detect an interaction between KaiA and KaiB using this probe (supplemental Fig. S1). Thus, the probe was useful for FCS monitoring of the interaction between KaiB and KaiC.
FIGURE 3.
Monitoring circadian rhythms in the Kai protein oscillatory solution using FCS. Diffusion times over a 5-day period obtained with FCS and TAMRA-KaiB-His6 and 3.5 μm KaiB (a), 3.5 μm KaiB and 3.5 μm KaiC (b), or 1.2 μm KaiA, 3.5 μm KaiB, and 3.5 μm KaiC (the standard mixture) (c). d, oscillations of the diffusion time and KaiC phosphorylation in the standard mixture are shown. Filled and open circles represent diffusion times and KaiC phosphorylation ratios, respectively. FCS analysis of Kai protein mixtures containing TAMRA-KaiB-His6 was performed every 2 h. A representative example of two or more FCS independent experiments is shown. Each data point represents the mean ± S.D. from 10 measurements at the indicated time point.
Next, we added the probe to the standard oscillatory reaction mixture and performed FCS analysis. The average diffusion time oscillated between ∼500 μs and 900 μs with a period of ∼22 h without damping, indicating that the probe participated in the circadian interactions (Fig. 3c). The diffusion time peaked ∼5 h after the peak in phosphorylated KaiC levels (Fig. 3d). KaiB reportedly exists in complexes with KaiC and/or KaiA and KaiC, levels of which peaked 4–6 h after the peak in phosphorylated KaiC levels (8). It was likely that the oscillation of the diffusion time of the probe represented the kinetics of KaiB in the standard mixture.
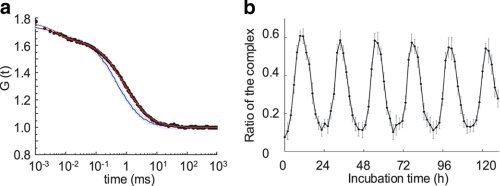
To quantitatively confirm this idea, we then performed two-component analysis of FCS results obtained with the standard mixture at the time point with the longest diffusion time (after 9.4 h of incubation). FCS analysis with a two-component analytic model was utilized to characterize two fluorescent species with different diffusion times. To distinguish the two species, the diffusion times must differ by at least a factor of 1.6 (23). According to the Stokes-Einstein relationship, the diffusion time of a globular molecule is proportional to the cubic root of the molecular mass. Hence, the molecular masses of the two species must differ by at least a factor of 4.1. Gel-filtration chromatography followed by SDS-PAGE was previously used to show that KaiB was present as a free form (∼25 kDa) and as part of a complex (∼500 kDa) (8). The ∼20-fold difference between the free and bound forms of KaiB should allow use of the two-component analytical model. The diffusion time of the probe was 482.5 ± 16.6 μs in the solution containing the probe and KaiB after an incubation of 9.4 h. Two-component fitting analysis with this value for τfree yielded values for τcomplex of 1243.0 ± 256.9 μs and y of 35.2 ± 13.8% (Fig. 4a). The percentage of probe in complexes was 64.8 ± 13.8%. The analysis was verified based on the observation that the diffusion time of the complexes (τcomplex, 1243.0 μs) was similar to that estimated using the Stokes-Einstein relationship (∼1309.7 μs). The previous study showed that approximately two-thirds of the KaiB molecules were in the complexes at the time of maximum binding (8). The agreement between our FCS analysis and the biochemical experiments led us to conclude TAMRA-KaiB-His6 behaved similarly to KaiB in the standard mixture, allowing real-time monitoring of rhythmic complex formation.
FIGURE 4.
Estimation of the KaiC-bound fraction of the probe using a two-component analytic model of FCS. a, typical autocorrelation curves obtained after 9.4 h of incubation with samples containing TAMRA-KaiB-His6 and KaiB (Fig. 3a) or the standard Kai protein mixture (Fig. 3c) are indicated using open and filled circles, respectively. The autocorrelation function of TAMRA-KaiB-His6 mixed with only KaiB was fit with a one-component analytic model, and the diffusion time was estimated to be 482.5 ± 16.6 μs (blue fitting curve). The autocorrelation function of TAMRA-KaiB-His6 in the standard mixture was fit with a two-component analytic model by fixing the diffusion time of the free fraction at 482.5 μs (red fitting curve). b, circadian oscillation of the ratios of KaiB-bound KaiC complex. Ratios of the complex were computed using the same data set in Fig. 3c.
A two-component analysis was also performed at each data point obtained from the standard mixture. We calculated the ratio of the complex by fixing values for τfree and τcomplex. The oscillation of the ratios was similar to that of the diffusion time concerning the period length and the phases of peak and trough. The ratio reached ∼60% at each peak and went down ∼10% at its trough (Fig. 4b).
We then determined whether long term exposure to the laser inhibited the reaction, possibly via phototoxicity and/or photobleaching. We changed the exposure time for each data point from 5 × 15 s to 100 × 15 s. Under these conditions, the samples were maximally exposed to the laser for a total of ∼18 h during the 92-h observation period, yet we did not detect any differences in the circadian rhythms (supplemental Fig. S2). Therefore, this system allows accurate real-time monitoring for relatively long periods of time.
Monitoring Early Molecular Responses to Temperature Stimuli
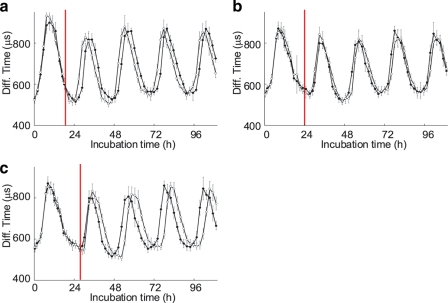
Circadian rhythms in cyanobacterial cells and the Kai in vitro protein oscillator can be entrained by temperature changes (9, 10, 24, 25). Using our FCS-based method to analyze the oscillatory system, we attempted to observe changes of the KaiB interaction profile in response to temperature stimuli. Phase responses to short stimulus pulses provide basic analytic data for system analysis; these experiments require many samples and data points obtained over time. Furthermore, transition states between the old and new phases contain useful information that helps elucidate the dynamics of the system. Monitoring the transition states requires a series of data with high time resolution. FCS is a good tool for this kind of experiment. We exposed the Kai protein oscillator to a high temperature pulse and evaluated the phase response of the rhythmic KaiB interactions. First, we prepared aliquots of the standard mixture, and each aliquot was exposed to 50 °C for 30 min after 12, 16, 20, 24, 28, or 32 h of incubation time. The relatively high temperature did not affect the amplitude of the oscillation, suggesting that the components of the reaction mixtures were not denatured during the experiment (Fig. 5 and supplemental Fig. S3). We detected phase shifts in the circadian rhythm when the samples were exposed to the high temperature after 20 or 28 h of incubation (Fig. 5, a and c). Aliquots exposed to the pulse after 20 h of incubation showed a phase advance of ∼2 h compared with the control sample, whereas the pulse delivered after 28 h of incubation delayed the phase by ∼2 h. A temperature pulse after incubation for 12, 16, 24, or 32 h did not induce any detectable phase changes (Fig. 5b and supplemental Fig. S3).
FIGURE 5.
FCS analysis of phase responses to a high temperature pulse. The standard mixture for Kai protein oscillation was exposed to a high temperature pulse (50 °C for 30 min) after 20 h (a), 24 h (b), or 28 h (c) of incubation time. Open and filled circles in each plot represent the diffusion times in mixtures with and without the temperature pulse, respectively. Red bars indicate the duration of the pulse. Each data point represents the mean ± S.D. from 10 measurements at the indicated time point. Data in a and in b and c were obtained from different aliquots of protein mixtures.
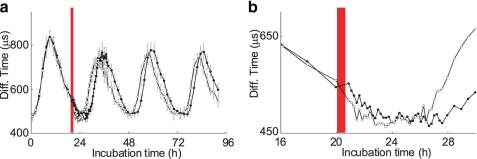
Next, we examined how the transition of the KaiB interaction profile was affected by a high temperature pulse using FCS analysis with high time resolution. Following a temperature pulse delivered after 20 h of incubation, FCS analysis was performed every 10 min for the next 7 h, every 30 min for the following 13 h, and every 2 h for the final 52 h, for a total incubation time of 92 h. As with the previous experiments in which the sampling frequency was every 2 h, high time resolution monitoring detected a phase advance of ∼2 h (Figs. 5a and 6a), and the waveforms obtained with the two monitoring conditions were similar. The diffusion time observed in the heat-treated sample was shorter than that observed in the control sample starting at 20.9 h of incubation, immediately after the heat stimulus, until 23.8 h of incubation (Fig. 6b). These data indicated that the high temperature stimulus accelerated dissociation of KaiB from the KaiC-based complex. After 26.6 h of incubation, the diffusion time clearly increased in the heat-treated samples, whereas that in the untreated control sample began to increase after incubation for 28 h. The phase shift after 20 h of incubation occurred just after the temperature stimulus. Thus, this real-time monitoring system allowed high time resolution analysis of changes in KaiB interactions in the Kai protein oscillator.
FIGURE 6.
Changes in Kai complex formation in response to a high temperature pulse. a, changes in the diffusion time in response to a high temperature stimulus after 20 h of incubation. Intervals between data points were ∼2 h for the first 20 h and last 52 h of the 92-h incubation period, 10 min between 20 h and 27 h of the incubation period, and 30 min between 27 h and 40 h of the incubation period. Open and filled circles in each plot represent diffusion times in mixtures with and without the high temperature stimulus, respectively. Red bars indicate the duration of the pulse. Each data point represents the mean ± S.D. from 10 measurements at the indicated time point. b, a magnified plot of a for data around incubation for 22 h.
DISCUSSION
In this report, we describe real-time monitoring of the cyclic interactions between KaiB and KaiC-based complexes. As a noninvasive method that does not markedly affect the essential properties of the reconstituted oscillation, this monitoring system is expected to help elucidate the mechanisms underlying the cellular circadian rhythms. This method has a number of advantages. First, cyclic interactions among the Kai proteins are automatically detected in a single aliquot without the need for additional steps after the sample is placed in the analysis device. Second, the oscillatory system functions normally despite addition of the fluorescent probe and exposure to the laser. These features allow monitoring of protein-protein interactions over a wide range of time scale. As an example, we examined the transition state of a phase response to a high temperature stimulus by sampling at a rate of once every 10 min and observed the circadian oscillation of the same aliquot over the course of 5 days. This method can be used to analyze both long term oscillatory dynamics and short term reactions together in the same aliquot. Furthermore, this monitoring method can be utilized for the quantitative interpretation of results reflecting protein complex formation. The ratios of KaiB in the KaiC-based complexes during the measurement time were calculated by the two-component analysis. The dynamic behavior of the complex formation was clearly estimated: ∼60% KaiB in the complex at the peak, whereas only ∼10% at the trough. To date, transition states in the Kai oscillatory solution after various stimuli or after mixing solutions at different phases have been assessed based on the kinetics of KaiC phosphorylation and the interaction among KaiC proteins (9, 26). Re-evaluating the transition states on the basis of the KaiB-KaiC interaction with our real-time monitoring system is likely to help elucidate the synchronization mechanism.
Various Kai mutants that cause different oscillation profiles have been described, although the precise molecular determinants are largely unknown (4, 27). The relatively large number of samples that can be examined in the monitoring system described here should allow efficient evaluation of the Kai mutants, including various combinations of the Kai variants. These analyses should help us better model the Kai protein oscillatory system.
FCS is characterized by a small detection volume and only a low concentration of the probe is required. The excitation laser was focused on a small volume in the solution. Brownian motion of proteins in and out of this volume may decrease the risk of damage to the fluorescently labeled proteins caused by repeated exposure to the laser. Of note, FCS analysis can detect fluorescent molecules at nanomolar concentrations. Some reconstituted systems with tagged Kai proteins have shorter period lengths compared with results obtained with untagged Kai proteins (8). Alteration of oscillations in Kai protein complex formation was avoided using relatively low concentration of fluorescently labeled KaiB in the standard mixture (∼3500 times more unlabeled KaiB molecules). Other biological systems that contain proteins at a similar concentration ratio can be assessed with this noninvasive FCS system.
To use FCS for quantitative analysis of protein-protein interactions, a protein labeled at a specific position was created as the fluorescent probe using a cell-free translation system with an expanded genetic codon (19). A uniformly labeled protein with only a small change in the molecular mass (∼4 kDa) was expressed. A fusion protein containing a fluorescent protein, such as GFP (∼28 kDa), could also be used, although the relatively large increase in the molecular mass of the fluorescent probe may degrade the performance of FCS. In some cases, fusing a fluorescent protein to a protein of interest may interfere with its interaction (28). Chemically reactive derivatives of fluorescent dyes are commonly used to label proteins. Heterogeneity in the number and positions of the coupled dye molecules may preclude precise quantitative analysis of the interaction. Thus, position-specific labeling, as described here, should be considered for quantitative analysis of protein-protein interactions with FCS.
Understanding the dynamics of protein-protein interactions is essential for elucidating cellular regulatory systems. In the Kai protein oscillatory system, a well organized chain of reactions can be reconstituted using only the purified proteins and ATP. Yet it is generally difficult to reconstitute most regulatory systems with three or more components using only purified proteins. In such cases, crude extracts may provide alternative sources. A recent study successfully used FCS to assess reactions containing cell lysates (29). The noninvasive method described here can be used to examine these types of reactions and will likely provide a useful tool to analyze cellular regulatory systems.
Supplementary Material
Acknowledgments
We thank Drs. Taeko Nishiwaki (Nagoya University, Nagoya) and Michinori Mutsuda (Nagoya University, Nagoya) for fruitful discussions.
This work was supported by Grants-in-aid from the Ministry of Education, Culture, Sports, Science and Technology of Japan (Grant 15GS0308 to T. K. and T. O.), the Japan Society for the Promotion of Science (Grant 17370088 to T. O. and Grant 21010517 to H. I.), and Takeda Science Foundation (to T. O.).

This article contains supplemental Figs. S1–S3.
- FCS
- fluorescence correlation spectroscopy
- TAMRA
- carboxytetramethylrhodamine.
REFERENCES
- 1. Parrish J. R., Gulyas K. D., Finley R. L., Jr. (2006) Yeast two-hybrid contributions to interactome mapping. Curr. Opin. Biotechnol. 17, 387–393 [DOI] [PubMed] [Google Scholar]
- 2. Bürckstümmer T., Bennett K. L., Preradovic A., Schütze G., Hantschel O., Superti-Furga G., Bauch A. (2006) An efficient tandem affinity purification procedure for interaction proteomics in mammalian cells. Nat. Methods 3, 1013–1019 [DOI] [PubMed] [Google Scholar]
- 3. Aebersold R., Mann M. (2003) Mass spectrometry-based proteomics. Nature 422, 198–207 [DOI] [PubMed] [Google Scholar]
- 4. Ishiura M., Kutsuna S., Aoki S., Iwasaki H., Andersson C. R., Tanabe A., Golden S. S., Johnson C. H., Kondo T. (1998) Expression of a gene cluster kaiABC as a circadian feedback process in cyanobacteria. Science 281, 1519–1523 [DOI] [PubMed] [Google Scholar]
- 5. Nakajima M., Imai K., Ito H., Nishiwaki T., Murayama Y., Iwasaki H., Oyama T., Kondo T. (2005) Reconstitution of circadian oscillation of cyanobacterial KaiC phosphorylation in vitro. Science 308, 414–415 [DOI] [PubMed] [Google Scholar]
- 6. Terauchi K., Kitayama Y., Nishiwaki T., Miwa K., Murayama Y., Oyama T., Kondo T. (2007) ATPase activity of KaiC determines the basic timing for circadian clock of cyanobacteria. Proc. Natl. Acad. Sci. U.S.A. 104, 16377–16381 [DOI] [PMC free article] [PubMed] [Google Scholar]
- 7. Nishiwaki T., Satomi Y., Kitayama Y., Terauchi K., Kiyohara R., Takao T., Kondo T. (2007) A sequential program of dual phosphorylation of KaiC as a basis for circadian rhythm in cyanobacteria. EMBO J. 26, 4029–4037 [DOI] [PMC free article] [PubMed] [Google Scholar]
- 8. Kageyama H., Nishiwaki T., Nakajima M., Iwasaki H., Oyama T., Kondo T. (2006) Cyanobacterial circadian pacemaker. Kai protein complex dynamics in the KaiC phosphorylation cycle in vitro. Mol. Cell 23, 161–171 [DOI] [PubMed] [Google Scholar]
- 9. Mori T., Williams D. R., Byrne M. O., Qin X., Egli M., Mchaourab H. S., Stewart P. L., Johnson C. H. (2007) Elucidating the ticking of an in vitro circadian clockwork. PLoS Biol. 5, e93. [DOI] [PMC free article] [PubMed] [Google Scholar]
- 10. Yoshida T., Murayama Y., Ito H., Kageyama H., Kondo T. (2009) Nonparametric entrainment of the in vitro circadian phosphorylation rhythm of cyanobacterial KaiC by temperature cycle. Proc. Natl. Acad. Sci. U.S.A. 106, 1648–1653 [DOI] [PMC free article] [PubMed] [Google Scholar]
- 11. Iwasaki H., Nishiwaki T., Kitayama Y., Nakajima M., Kondo T. (2002) KaiA-stimulated KaiC phosphorylation in circadian timing loops in cyanobacteria. Proc. Natl. Acad. Sci. U.S.A. 99, 15788–15793 [DOI] [PMC free article] [PubMed] [Google Scholar]
- 12. Kageyama H., Kondo T., Iwasaki H. (2003) Circadian formation of clock protein complexes by KaiA, KaiB, KaiC, and SasA in cyanobacteria. J. Biol. Chem. 278, 2388–2395 [DOI] [PubMed] [Google Scholar]
- 13. Kitayama Y., Iwasaki H., Nishiwaki T., Kondo T. (2003) KaiB functions as an attenuator of KaiC phosphorylation in the cyanobacterial circadian clock system. EMBO J. 22, 2127–2134 [DOI] [PMC free article] [PubMed] [Google Scholar]
- 14. Akiyama S., Nohara A., Ito K., Maéda Y. (2008) Assembly and disassembly dynamics of the cyanobacterial periodosome. Mol. Cell 29, 703–716 [DOI] [PubMed] [Google Scholar]
- 15. Murayama Y., Mukaiyama A., Imai K., Onoue Y., Tsunoda A., Nohara A., Ishida T., Maéda Y., Terauchi K., Kondo T., Akiyama S. (2011) Tracking and visualizing the circadian ticking of the cyanobacterial clock protein KaiC in solution. EMBO J. 30, 68–78 [DOI] [PMC free article] [PubMed] [Google Scholar]
- 16. Piehler J. (2005) New methodologies for measuring protein interactions in vivo and in vitro. Curr. Opin. Struct. Biol. 15, 4–14 [DOI] [PubMed] [Google Scholar]
- 17. Yan Y., Marriott G. (2003) Analysis of protein interactions using fluorescence technologies. Curr. Opin. Chem. Biol. 7, 635–640 [DOI] [PubMed] [Google Scholar]
- 18. Krichevsky O., Bonnet G. (2002) Rep. Prog. Phys. 65, 251–297 [Google Scholar]
- 19. Abe R., Shiraga K., Ebisu S., Takagi H., Hohsaka T. (2010) Incorporation of fluorescent non-natural amino acids into N-terminal tag of proteins in cell-free translation and its dependence on position and neighboring codons. J. Biosci. Bioeng. 110, 32–38 [DOI] [PubMed] [Google Scholar]
- 20. Hori K., Shin W. S., Hemmi C., Toyo-oka T., Makino T. (2003) High fidelity SNP genotyping using sequence-specific primer elongation and fluorescence correlation spectroscopy. Curr. Pharm. Biotechnol. 4, 477–484 [DOI] [PubMed] [Google Scholar]
- 21. Hohsaka T., Sisido M. (2002) Incorporation of non-natural amino acids into proteins. Curr. Opin. Chem. Biol. 6, 809–815 [DOI] [PubMed] [Google Scholar]
- 22. Nakata H., Ohtsuki T., Sisido M. (2009) A protease inhibitor discovery method using fluorescence correlation spectroscopy with position-specific labeled protein substrates. Anal. Biochem. 390, 121–125 [DOI] [PubMed] [Google Scholar]
- 23. Meseth U., Wohland T., Rigler R., Vogel H. (1999) Resolution of fluorescence correlation measurements. Biophys. J. 76, 1619–1631 [DOI] [PMC free article] [PubMed] [Google Scholar]
- 24. Johnson C. H., Elliott J., Foster R., Honma K., Kronauer R. (2004) in Biological Timekeeping (Dunlap J. C., Loros J. J., DeCoursey P. J., eds) pp. 67–105, Sinauer Associates, Sunderland, MA [Google Scholar]
- 25. Rensing L., Ruoff P. (2002) Temperature effect on entrainment, phase shifting, and amplitude of circadian clocks and its molecular bases. Chronobiol. Int. 19, 807–864 [DOI] [PubMed] [Google Scholar]
- 26. Ito H., Kageyama H., Mutsuda M., Nakajima M., Oyama T., Kondo T. (2007) Autonomous synchronization of the circadian KaiC phosphorylation rhythm. Nat. Struct. Mol. Biol. 14, 1084–1088 [DOI] [PubMed] [Google Scholar]
- 27. Kondo T., Tsinoremas N. F., Golden S. S., Johnson C. H., Kutsuna S., Ishiura M. (1994) Circadian clock mutants of cyanobacteria. Science 266, 1233–1236 [DOI] [PubMed] [Google Scholar]
- 28. Schmid J. A., Neumeier H. (2005) Evolutions in science triggered by green fluorescent protein (GFP). Chembiochem 6, 1149–1156 [DOI] [PubMed] [Google Scholar]
- 29. Stoevesandt O., Köhler K., Fischer R., Johnston I. C., Brock R. (2005) One-step analysis of protein complexes in microliters of cell lysate. Nat. Methods 2, 833–835 [DOI] [PubMed] [Google Scholar]
Associated Data
This section collects any data citations, data availability statements, or supplementary materials included in this article.


