

Abstract
In this paper, we introduce the Flux Coupling Finder (FCF) framework for elucidating the topological and flux connectivity features of genome-scale metabolic networks. The framework is demonstrated on genome-scale metabolic reconstructions of Helicobacter pylori, Escherichia coli, and Saccharomyces cerevisiae. The analysis allows one to determine whether any two metabolic fluxes, v1 and v2, are (1) directionally coupled, if a non-zero flux for v1 implies a non-zero flux for v2 but not necessarily the reverse; (2) partially coupled, if a non-zero flux for v1 implies a non-zero, though variable, flux for v2 and vice versa; or (3) fully coupled, if a non-zero flux for v1 implies not only a non-zero but also a fixed flux for v2 and vice versa. Flux coupling analysis also enables the global identification of blocked reactions, which are all reactions incapable of carrying flux under a certain condition; equivalent knockouts, defined as the set of all possible reactions whose deletion forces the flux through a particular reaction to zero; and sets of affected reactions denoting all reactions whose fluxes are forced to zero if a particular reaction is deleted. The FCF approach thus provides a novel and versatile tool for aiding metabolic reconstructions and guiding genetic manipulations.
An overarching attribute of metabolic networks is their inherent robustness and ability to cope with ever-changing environmental conditions. Despite this flexibility, network stoichiometry and connectivity do establish limits/barriers to the coordination and accessibility of reactions. The recent abundance of complete genome sequences has enabled the generation of genome-scale metabolic reconstructions for various microorganisms (Covert et al. 2001; Price et al. 2003; Reed and Palsson 2003). These models provide a largely complete skeleton of the metabolic reactions present in an organism. Examination of the structural and topological properties of metabolic networks is important at both the conceptual level, to reveal the organizational principles of metabolic interactions within cellular networks, and at the practical level for more effectively focusing engineering interventions and ensuring the consistency of the underlying reconstructions.
To this end, the identification of blocked reactions (i.e., reactions incapable of carrying flux due to the stoichiometry of the metabolic network under steady-state conditions) and enzyme subsets (i.e., groups of reactions that operate together in fixed flux proportions under steady-state conditions) in metabolic models has attracted considerable interest in recent years (Kholodenko et al. 1995; Rohwer et al. 1996; Pfeiffer et al. 1999; Klamt et al. 2003). The output of these analyses provides significant biological insight as to which reactions are potentially missing from metabolic models, as well as which reactions may be under coordinated regulation, alluding to a mechanism for the continuous refinement of metabolic reconstructions through an iterative model-building process. Specifically, stoichiometric models of Escherichia coli metabolism utilized within the flux balance analysis (FBA) framework have been used for (1) qualitatively predicting the outcomes of gene knockout experiments (Edwards and Palsson 2000; Badarinarayana et al. 2001); (2) identifying the correct sequence of byproduct secretion under increasingly anaerobic conditions (Varma et al. 1993); (3) quantitatively predicting cellular growth rates (Edwards et al. 2001; Ibarra et al. 2002); (4) assessing the performance limits of metabolic networks in response to gene additions or deletions (Burgard and Maranas 2001); and (5) suggesting gene knockout strategies for enhancing biochemical production (Burgard et al. 2003; Pharkya et al. 2004).
In the postgenomic era, each cellular function, biological entity, or physiological event is seen in the context of a complex network of interactions. Following this spirit, several frameworks for examining structural and topological network properties based on convex analysis have been developed and demonstrated for small-scale metabolic representations (∼100 reactions) to identify extreme pathways (Schilling et al. 2000) or elementary modes (Schuster and Hilgetag 1994; Schuster et al. 2000). An elementary mode refers to a minimal set of enzymes that could operate under steady-state conditions. Any feasible flux distribution can be represented by a nonnegative linear combination of elementary modes. Elementary mode analysis is often used as a quantitative measure of network robustness, as more elementary modes for a given environmental condition and organism hint at a more flexible metabolism (Stelling et al. 2002). This concept has proven effective in the rational strain design for poly-β-hydroxybutyrate production in Saccaromyces cerevisiae by quantifying the additional flexibility gained by the addition of a non-native transhydrogenase reaction (Carlson et al. 2002). Correspondingly, the set of extreme pathways refers to the minimum set of flux vectors capable of describing all steady-state flux distributions and are consequently a subset of elementary modes (Schilling et al. 2000). As with elementary modes, the number of extreme pathways provides a measure of pathway redundancy. The application of extreme pathway analysis has revealed that the Haemophilus influenzae network has an order of magnitude larger degree of pathway redundancy for amino acid production compared to Helicobacter pylori (Papin et al. 2002; Price et al. 2002). For more details, Klamt and Stelling (2003) and Palsson et al. (2003) provide reviews of the similarities, differences, and applicability of elementary mode analysis and extreme pathway analysis.
However elegant, all existing algorithms for the exhaustive identification of elementary modes and extreme pathways do not scale well for genome-scale models of complex microorganisms, due to the combinatorial explosion of the identified pathways (Klamt and Stelling 2002). For example, although the central metabolic network utilized by Stelling et al. (2002) contained only 110 reactions, it gave rise to 43,279 elementary modes. Similarly, although a small example involving 20 reactions contained only 80 extreme pathways (Covert and Palsson 2003), the H. influenzae metabolic network contained over 1000 extreme pathways even after its a priori breakup into six distinct metabolic subsystems (Schilling and Palsson 2000).
Here we introduce the Flux Coupling Finder (FCF) procedure for finding coupled reaction sets and blocked reactions in genome-scale metabolic systems. Whereas previous algorithms require the computation of null-space matrices (Heinrich and Schuster 1996; Pfeiffer et al. 1999), a computationally prohibitive task for large networks (Golub and Van Loan 1996), the approach proposed here circumvents this challenge by requiring instead the solution of a sequence of linear programs (LPs). The set of blocked reactions for a given network is identified by maximizing each particular flux subject to the network stoichiometry. If the maximum possible value of a particular flux is zero, then the reaction is said to be unusable or blocked because it cannot carry any flux. Similarly, linear fractional programming is employed to identify the maximum and minimum flux ratios (i.e., max v1/v2, min v1/v2) for every pair of metabolic fluxes. Comparison of flux ratios allows one to determine whether any two fluxes, v1 and v2, share any of the following types of coupling:
Directional coupling (v1 → v2), if a non-zero flux for v1 implies a non-zero flux for v2 but not necessarily the reverse.
Partial coupling (v1 ↔ v2), if a non-zero flux for v1 implies a non-zero, though variable, flux for v2 and vice versa.
Full coupling (v1 ⇔ v2), if a non-zero flux for v1 implies not only a non-zero but also a fixed flux for v2 and vice versa (Fig. 1).
Figure 1.

Two reaction fluxes are (1) directionally coupled if the activity of one flux implies the activity of the other without the converse necessarily holding true, (2) partially coupled if the activity of one flux implies the activity of the other and vice versa, or (3) fully coupled if activity of one flux fixes the activity of the other. Reactions in enzyme subsets as defined by Pfeiffer et al. (1999) are exclusively fully coupled. Various types of coupling are related to the flux ratio limits Rmin and Rmax as shown.
Reaction pairs not falling into one of these categories are classified as uncoupled. Reactions which are mutually partially and/or fully coupled to one another are grouped into coupled reaction sets. The identification of directionally and partially coupled reactions in addition to fully coupled reactions implies that the FCF method is not only more tractable but also more encompassing than previously described algorithms for enzyme subset identification. The proposed procedure is versatile enough to allow the incorporation of additional constraints (e.g., oxygen uptake limitations and/or substrate restrictions) or performance requirements (e.g., minimum levels of ATP and/or biomass production) during the calculation of blocked and/or coupled reactions. The mathematical frameworks for identifying the maximum and minimum flux ratios and blocked reactions are described next, followed by their application to the following genome-scale stoichiometric models of increasing size and complexity: (1) H. pylori (Schilling et al. 2002; 389 reactions); (2) E. coli (Edwards and Palsson 2000; 740 reactions); and (3) S. cerevisiae (Forster et al. 2003; 1173 reactions).
METHODS
Blocked Reactions
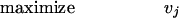
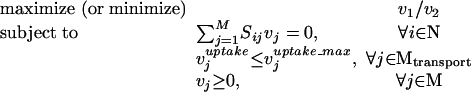
Blocked reactions are defined as reactions incapable of carrying flux under steady-state conditions. Here we identify blocked reactions by identifying fluxes whose maximum and minimum values are zero for a particular uptake scenario. The maximization of a particular flux vj for a steady-state metabolic network comprised of a set N = {1,..., N} of metabolites and a set M = {1,..., M} of reactions is expressed mathematically as the following linear program (LP),
 |
1 |
 |
2 |
 |
3 |
 |
4 |
where Sij is the stoichiometric coefficient of metabolite i in reaction j. Reversible reactions are expressed as two irreversible reactions in opposite directions (i.e., 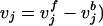 ), thus constraining all fluxes to positive values. The optimization problem can be easily modified to examine not only the effects of changing which metabolites are internal or external, but more specifically changing which metabolites can be taken up, secreted, or both. Constraint (3) limits the uptake of resources (i.e., carbon, oxygen, etc.) to the network, and the maximum uptake of any metabolite absent from the external medium is set to zero. Transport mechanisms for metabolites out of the cell can be blocked by changing the inequality in constraint (4) to an equality. All isozymes catalyzing a given reaction are lumped into a single flux, eliminating duplicate reactions. The set of blocked reactions is identified by solving the above linear programming problem once for every flux. If the maximum value of the flux is zero, then the reaction is said to be unusable or blocked. Examples of blocked reactions are provided in Figure 2. The identified blocked reactions may have either biological meaning, such as the reaction being a part of an incomplete pathway at an intermediate stage of evolution, or they could signify errors/omissions in the metabolic reconstruction. It is important to note that the results depend upon the (1) steady-state assumption, (2) imposed uptake/secretion scenarios, (3) growth requirements, and (4) energy production requirements.
Figure 2.

Examples of blocked reactions (dashed lines) and a fully coupled enzyme subset (heavy lines). Flux v4 is blocked due to the absence of a reaction consuming metabolite H, whereas v9 and v10 are blocked because there are no reactions forming I or consuming K. Note, however, that v4 can carry flux if metabolite H is allowed to accumulate (i.e., unsteady-state). Assuming that the biomass composition is prespecified, knowledge of any flux in the enzyme subset confers the values of all other fluxes in that subset. For example, if v5 is fixed, then v6 and vbio are also fixed, as they are the only outlets for the flux towards metabolites C and F, respectively. Similarly, fluxes v7 and vE are fixed as a consequence of fixing vbio and v6.
Coupled Reactions
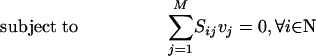
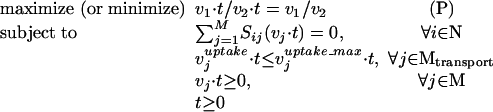
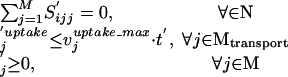
The identification of all coupled reactions and corresponding coupled reaction sets hinges upon the calculation of the upper and lower limits of all flux ratios (i.e., Rmax = max v1/v2, Rmin = min v1/v2). Note that the calculation of these ratios originally gives rise to nonlinear optimization problems. However, by performing the variable transformation ( = v · t) inspired by fractional programming, a completely equivalent (see Appendix A for proof) linear programming formulation is obtained whose solution time is on the order of milliseconds.
  Here the variables are the metabolic fluxes normalized by v2. The above linear program has a clear biological interpretation in terms of responses of metabolic networks to the perturbation of particular fluxes. Constraint 2 = 1 sets a reference flux to a unit value, whereas the optimization criteria are used to probe flux variability for each tested reaction. Uncoupled fluxes do not “feel” flux perturbations, whereas fluxes through coupled reactions decrease or increase in accordance with the encountered type of coupling. This formulation is guaranteed to obtain globally optimal values for the flux ratios, because it relies on linear programming.
The various outcomes for the maximum and minimum flux ratios are depicted in Figure 1. The first case occurs whenever Rmin is equal to zero and Rmax is equal to some finite value c. The fluxes are directionally coupled (v1 → v2) because the activity of v1 implies v2 (i.e., v2 ≥ v1/c). Similarly, if Rmin is equal to a finite constant c and Rmax is unbounded, then the fluxes are directionally coupled in the opposite direction (v2 → v1), as v2 implies v1 (i.e., v1 ≥ v2 · c). Two fluxes can also be partially coupled (v1 ↔ v2) if Rmax and Rmin are both finite and unequal, or fully coupled (v1 ⇔ v2) if Rmax is finite and equal to Rmin. The final case occurs whenever the two fluxes are completely uncoupled and is encountered if their ratio can vary freely from zero to infinity.
Figure 2 shows an example of a fully coupled reaction set. Note that because the partial and/or full coupling of reactions is a transitive property (i.e., v1 ↔ v2 and v2 ↔ v3 imply that v1 ↔ v3), complete coupled reaction sets can be subsequently inferred from the maximum and minimum flux ratios. Directional coupling, unlike partial and full coupling, can capture the oneway type of connectivity between metabolic reactions. This information enables the global identification of equivalent knockouts defined as the set of all possible reactions whose deletion forces the flux through a particular reaction to zero, and sets of affected reactions defined as all reactions whose fluxes are forced to zero if a particular reaction is deleted. These concepts are illustrated in Figure 3 where the reactions v1, v2, and v3 all imply reaction v*. This means that if any of these fluxes assumes a non-zero value, then v* must also attain a non-zero value. Therefore, knocking out reaction v* from the network forces the fluxes through reactions v1, v2, and v3 to zero. Thus, we refer to reactions v1, v2, and v3 as the set of reactions affected by the removal of v*. Similarly, a non-zero flux through v* implies that the fluxes through v4, v5, and v6 are also non-zero. This means that removing any of v4, v5, or v6 from the network forces the flux through v* to zero. Reactions v4, v5, and v6 are thus referred to as equivalent knockouts for v*. Note that although the sets of reactions affected by each of the equivalent knockouts may differ, the directionality of coupling for partially/fully coupled reactions remains the same.
Figure 3.

Examples of affected reaction sets and equivalent knockouts for reaction v*. Removing v* from the network results in reaction fluxes v1, v2, and v3 being forced equal to zero at steady-state, and thus they are referred to as affected by v*. Removing any of v4, v5, or v6 ensures that v* cannot carry flux at steady-state, so they are said to be equivalent knockouts for v*.
Flux Coupling Finder (FCF) Procedure
Although the identification of all blocked and coupled reactions by inspection is possible for small networks such as the one shown in Figure 2, exhaustively identifying blocked and coupled reactions in genome-scale metabolic models requires a rigorous computational procedure. The developed FCF procedure for identifying both blocked and coupled reactions is summarized in pseudo-code as follows:
Step 1. Aggregate all isozymes (i.e., duplicate reactions) from the stoichiometric matrix Sij.
-
Step 2. For (j = 1 to M), Solve for the maximum value of each flux vj. If
 , then the reaction is blocked. Column j is removed from Sij.
End
Step 3. Set AlreadyCoupled(j) = 0.
-
Step 4. For (j = 1 to M - 1) and AlreadyCoupled(j) = 0, For (j′ = j + 1 to M),
Solve for Rmin and Rmax (i.e., the minimum and maximum ratios of vj/v′j).
- If Rmin = 0 and Rmax is unbounded, then the reactions are uncoupled.
- If Rmin = 0 and Rmax = c > 0, then (vj → v′j).
-
If Rmin = c1 > 0 and Rmax = c2 > 0, then
- If (c2 - c1) > 0, then (vj ↔ v′j).
- If (c2 - c1) = 0, then (vj ⇔ v′j).
Set AlreadyCoupled(j′) = 1.Reactions j and j′ belong to the same coupled reaction set.All subsequent partially/fully coupled reactions j′ are added to the coupled reaction set. - If Rmin = c > 0 and Rmax is unbounded, then (v′j → vj).
End
End
The array AlreadyCoupled(j) enables the outer loop of Step 4 to skip reactions that have already been found to be a part of a coupled reaction set. All reactions in the same coupled reaction set have identical coupling properties. Computational requirements are on the order of minutes for genome-scale models involving as many as 1173 reactions upon implementing the FCF procedure utilizing LINDO (Lindo Systems) accessed via C++ on an Intel Pentium IV, 2.4-GHz, 512-MB RAM computer. Note that the FCF procedure substantially reduces the number of reaction ratios to be calculated, by employing a number of key tests as described above. Typically, only 10%–45% of potential reaction pairs needs to be examined.
RESULTS
Blocked Reactions
Here we examine the percentage of blocked reactions in the genome-scale models of H. pylori (389 reactions; Schilling et al. 2002), E. coli (740 reactions; Edwards and Palsson 2000), and S. cerevisiae (1173 reactions; Forster et al. 2003). For each one of them, five separate scenarios are explored to examine the effect of varied external/internal conditions on the number of potentially active fluxes in the models. First, any metabolite is allowed to enter or leave the metabolic network, provided that there exists a corresponding transport mechanism into or out of the cell for that metabolite (i.e., Complex Media/Aerobic). Reactions blocked under this assumption are unconditionally blocked and cannot be active under any set of conditions. Second, aerobic growth on a glucose-minimal medium is explored (i.e., Glucose/Aerobic). For this condition, the uptake of any carbon source other than what is required for growth on glucose is not allowed. Next, we further constrain the second scenario by setting the oxygen uptake to zero (i.e., Glucose/Anaerobic). Likewise, the fourth and fifth scenarios are identical to the second and third except that we enforce that the network apportions its fluxes to maximize the biomass yield (i.e., Optimal Glucose/Aerobic and Optimal Glucose/Anaerobic). Reactions that are blocked under any of the last four conditions but can carry flux under the first condition are referred to as conditionally blocked.
The total numbers and percentages of blocked reactions in each model are summarized in Figure 4. As expected, the percentage of blocked reactions increases as more constraints/conditions are imposed on the three network models. For the E. coli metabolic network (Edwards and Palsson 2000), we find that 14% of the 740 reactions are blocked under any condition (i.e., all metabolites with a transport mechanism into or out of the cell can be consumed or secreted, respectively), whereas 28% are blocked for aerobic growth on a glucose-minimal medium. Restricting the oxygen uptake to zero blocks only a few additional reactions (i.e., the oxygen uptake reaction and cytochrome oxidases) for growth on glucose. For both aerobic and anaerobic growth on glucose, about 55% of the E. coli reactions are found to be incapable of carrying any flux if the network is to attain the maximum biomass yield on a glucose-minimal medium. Notably, enforcing biomass maximization reveals distinct differences between aerobic and anaerobic E. coli metabolism. Specifically, optimal anaerobic growth requires that the 2-ketoglutarate dehydrogenase reaction is blocked, preventing the cyclic operation of the TCA cycle. In addition, optimal aerobic growth prevents the activity of reactions involved in fermentation product formation such as pyruvate formate lyase (i.e., formate production) and acetaldehyde dehydrogenase (i.e., ethanol production), in contrast to optimal anaerobic growth.
Figure 4.

Total numbers and percentages of blocked reactions for the three networks under different growth conditions.
For the yeast model (Forster et al. 2003), a much larger percentage of reactions are blocked under all examined scenarios. Many more reactions are blocked under anaerobic conditions than aerobic conditions for both growth on glucose and optimal growth on glucose. This is due to the large number of yeast reactions utilizing oxygen as a substrate, particularly in ergosterol and zymosterol synthesis, which are biomass constituents for yeast but not E. coli. Finally, for H. pylori, far fewer reactions are blocked compared to the E. coli and S. cerevisiae networks, implying a much more compact and largely essential network. The complete lists of reactions blocked under the examined conditions are available upon request.
Coupled Reaction Sets
In this section, we identify all coupled sets of reactions for the three metabolic networks. First, coupled reaction sets are identified assuming a biomass reaction exists for draining the set of compounds necessary for cell growth in their prespecified biological ratios. This aggregate biomass reaction description imposes a constant biomass composition. We then relax the constant biomass composition assumption by removing the centralized biomass drain from each metabolic network while allowing all biomass components to be drained independently of one another. The biomass components are slightly different for the three stoichiometric models (Edwards and Palsson 2000; Schilling et al. 2002; Forster et al. 2003), although they all include similar lists of amino acids, cofactors, currency metabolites, etc. True cellular behavior is bound to reside between the two extremes of a fixed biomass composition and uncontrolled biomass component draining. For each case, we investigated two distinct uptake scenarios: (1) only glucose can be taken up in addition to all essential growth resources (i.e., glucose-minimal media), and (2) any metabolites with a transport mechanism into the cell can be consumed (i.e., complex media). Reactions that are coupled for the most general case (i.e., complex media uptake environment, no biomass reaction) are coupled under any set of conditions. For H. pylori, the glucose-minimal medium consisted of glucose, alanine, arginine, histidine, isoleucine, methionine, phenylalanine, valine, thiamine, phosphate, oxygen, and sulfate as determined by Schilling et al. (2002). For E. coli and S. cerevisiae, the glucose-minimal medium was comprised of glucose, sulfate, nitrate, phosphate, and oxygen. For S. cerevisiae, the biomass components, ergosterol and zymosterol, were also included in the glucose-minimal medium under anaerobic conditions, as the model lacks the pathways necessary to synthesize these compounds in the absence of oxygen.
Genome-Scale Identification of Coupled Reaction Sets
The numbers of coupled reaction sets for each organism under the different conditions are provided in Table 1. These entries denote the total numbers of both partially or fully coupled reactions in each set. The complete lists of coupled reaction sets are available upon request. For all cases, we found that a much higher percentage of reactions are members of coupled sets in H. pylori than for the larger and more complex E. coli and S. cerevisiae networks (Fig. 5), alluding to a much more flexible metabolism in the larger networks. Additionally, we found that a constant biomass composition leads to the generation of one large coupled reaction set. Thus, if the biomass composition is fixed, the fluxes through tens of reactions are “locked” due to stoichiometry. In fact, the biomass-coupled reaction set of H. pylori comprises 38% and 46% of the entire network for the complex and glucose-minimal media, respectively. Also, the size of this biomass-coupled reaction set is much larger for H. pylori than for E. coli and S. cerevisiae, as increasing network redundancy leads to the decoupling of reactions from the large biomass-coupled reaction set. Note that although the coupled reaction sets include both partially and fully coupled reactions, the reactions comprising the biomass reaction sets are almost exclusively fully coupled. In addition, the handful of partially coupled reactions can vary only within tight ranges.
Table 1.
Reaction Coupling Statistics for the H. pylori, E. coli, and S. cerevisiae Metabolic Networks
|
H. pylori
|
E. coli
|
S. cerevisiae
|
||||||||||
|---|---|---|---|---|---|---|---|---|---|---|---|---|
| Biomass reaction
|
No biomass reaction
|
Biomass reaction
|
No biomass reaction
|
Biomass reaction
|
No biomass reaction
|
|||||||
| Complex media | Glucose minimal | Complex media | Glucose minimal | Complex media | Glucose minimal | Complex media | Glucose minimal | Complex media | Glucose minimal | Complex media | Glucose minimal | |
| 19 (2) | 15 (2) | 25 (2) | 23 (2) | 45 (2) | 33 (2) | 48 (2) | 37 (2) | 51 (2) | 45 (2) | 51 (2) | 46 (2) | |
| 8 (3) | 7 (3) | 10 (3) | 9 (3) | 9 (3) | 6 (3) | 9 (3) | 9 (3) | 13 (3) | 11 (3) | 14 (3) | 14 (3) | |
| 2 (4) | 1 (5) | 3 (4) | 2 (4) | 4 (4) | 1 (4) | 4 (4) | 3 (4) | 6 (4) | 5 (4) | 7 (4) | 5 (4) | |
| 1 (6) | 1 (7) | 1 (5) | 2 (5) | 3 (5) | 1 (5) | 5 (5) | 5 (5) | 2 (5) | 3 (5) | 2 (5) | 3 (5) | |
| 2 (7) | 1 (10) | 2 (6) | 3 (6) | 2 (6) | 3 (7) | 2 (6) | 2 (6) | 2 (6) | 2 (6) | 2 (6) | 2 (6) | |
| 1 (10) | 1 (174) | 3 (7) | 2 (7) | 1 (7) | 1 (10) | 2 (7) | 2 (7) | 1 (7) | 1 (7) | 1 (7) | 1 (7) | |
| 1 (148) | 1 (8) | 1 (8) | 1 (8) | 1 (112) | 1 (8) | 1 (8) | 2 (8) | 2 (8) | 2 (8) | 2 (8) | ||
| 1 (9) | 1 (9) | 2 (9) | 3 (9) | 3 (9) | 1 (9) | 1 (9) | 1 (9) | 1 (9) | ||||
| 4 (10) | 4 (10) | 1 (66) | 1 (10) | 1 (10) | 1 (12) | 1 (12) | 1 (12) | 1 (12) | ||||
| 1 (13) | 1 (13) | 1 (17) | 1 (17) | 1 (30) | 1 (34) | 1 (17) | 1 (17) | |||||
| 1 (20) | 1 (20) | |||||||||||
| Total reactions in subsets: | 248 | 247 | 220 | 213 | 259 | 236 | 252 | 226 | 261 | 248 | 255 | 242 |
| Total subsets: | 34 | 26 | 52 | 49 | 68 | 46 | 76 | 64 | 80 | 72 | 82 | 76 |
The first number in each entry denotes the number of coupled sets; the number in parentheses is the size of the coupled set. For example, “19(2)” signifies that there are 19 coupled sets composed of two reactions.
Figure 5.

Percentage of reactions contained in coupled sets in the H. pylori, E. coli, and S. cerevisiae metabolic networks for growth on either a complex or glucose-minimal medium (with and without a biomass reaction).
Coupled Reaction Set Example: Purine Biosynthesis in E. coli
A representative example of the information gained from flux coupling analysis is shown in Figure 6 with a coupled reaction set for E. coli purine biosynthesis. This reaction set is identified for aerobic growth on a glucose-minimal medium assuming a constant biomass composition. Here the concepts of partially coupled, fully coupled, and uncoupled reactions can be more clearly discerned. The numbers indicate the relative values or range of values for each flux in any particular flux distribution for the examined conditions. The FCF framework identifies 10 coupled reactions, eight fully coupled and two partially coupled. This coupled reaction set encompasses two multigene operons: purDH (three reactions with EC#'s 6.3.4.13, 2.1.2.3, and 3.5.4.10) and purEK (two reactions with EC# 4.1.1.21). The two reactions converting AICAR to IMP are partially coupled to the rest of the reaction set, because AICAR is also formed during histidine biosynthesis. Therefore the partially coupled reactions can assume values slightly greater than the eight fully coupled reactions. If we relax the constant biomass composition assumption, the coupled reaction set is “broken up” into two fully coupled reaction sets of two and eight reactions, respectively. Interestingly, the two reactions capable of converting GAR to FGAR are not a part of this coupled reaction set, because they decouple one another by offering alternative conversion routes. However, the sum of their fluxes is coupled to the rest of the reaction set. Also, both fluxes are directionally coupled to the other reactions, because a non-zero flux through either one implies that the coupled reaction set carries flux.
Figure 6.

Coupled reaction set identified for purine biosynthesis in E. coli on a glucose-minimal medium, assuming a constant biomass composition. The numbers indicate the relative values or range of values for each flux in any particular flux distribution for given growth condition. Secondary metabolites and cofactors are omitted for simplicity.
Biomass Formation Coupled Reaction Sets
In all cases, the biomass-coupled reaction sets were broken up into smaller sets whenever the biomass reaction was replaced by independent drains of biomass precursors. This decomposition is expected given that allowing biomass constituents to be drained (i.e., allowing them to become external metabolites) adds degrees of freedom to the network, leading to the uncoupling of reaction sets. Note that considering certain highly connected metabolites (e.g., ATP, NADH, etc.) as external helps to decompose large metabolic networks into smaller subsystems for elementary mode analysis (Schuster et al. 2002).
The decomposition of the yeast biomass-coupled reaction set is shown in Figure 7. It is comprised of 34 reactions (including the biomass reaction) for growth on glucose. When the biomass reaction was removed and replaced with biomass component drains which could operate independently of one another, the 34-reaction set was decomposed into one five-, 17-, and two-member reaction sets as well as two three-member reaction sets. The biomass sets for E. coli and H. pylori undergo similar fragmentations as the biomass reaction are removed from the models. However, even though the coupled reaction sets are decoupled under uncontrolled biomass component draining, they are indeed linked to one another based on the cell's requirement to provide itself with biomass constituents for growth.
Figure 7.

Reactions coupled to biomass formation for aerobic S. cerevisiae growth on a glucose-minimal medium. Secondary metabolites and cofactors are omitted for simplicity. All reactions are fully coupled, meaning that knowledge of one reaction flux is sufficient to specify the flux through all reactions at steady-state. Note that PAP is converted to AMP, which is a precursor to biomass. This enzyme subset is decomposed into numerous subsystems, indicated by different colored arrows, if the biomass reaction is replaced with drains on the various biomass precursors.
Genome-Scale Versus Subsystem-Based Coupling Analysis
A key advantage of the FCF framework over previous methods is that it does not require the a priori decoupling of the metabolic network into subsystems for analysis. For example, enzyme subset identification for the H. pylori model performed by Schilling et al. (2002) using extreme pathway analysis required breaking the network into six metabolic subsystems: (1) amino acid biosynthesis and degradation, (2) central metabolism, (3) lipid and cell envelope biosynthesis, (4) nucleotide biosynthesis and degradation, (5) transport and energy-redox metabolism, and (6) vitamin and cofactor biosynthesis. Forty-nine fully coupled enzyme subsets were identified spanning the six subsystems. That study corresponds exactly to our H. pylori complex medium case without the presence of a biomass reaction. A complete comparison of the coupled reaction sets identified using FCF with the enzyme subsets identified by Schilling et al. (2002) is shown in Figure 8. In addition to reproducing the enzyme subsets of Schilling et al. (2002), flux coupling analysis reveals additional information about the coupling of enzymes across the putative functional classifications. For example, the (GLCD, GLLDHR, KATA) transport subset is fully coupled with the (FOLE, DNTPH, DHPPH, FOLB, FOLK, PABB, PABC, FOLP, FOLC) vitamin and cofactor subset. Also, fully coupled with this reaction set is the ACEB reaction from central metabolism, bringing the total number of coupled reactions in this set to 13. Thus, breaking the metabolic network into subsystems often leads to reactions being missed during enzyme subset identification. Entire enzyme subsets can also be missed if they are comprised of no more than one reaction from each subsystem. One such example is the enzyme subset of OOR_ and FRDO, which is comprised of one reaction from central metabolism and one reaction from transport and energy-redox metabolism, respectively. The results demonstrate the importance of investigating metabolism at the genome-scale, as many connections between seemingly unrelated subsystems are uncovered.
Figure 8.

Comparison of the FCF-identified coupled reaction sets for H. pylori with the enzyme subsets identified by Schilling et al. (2002). The latter approach subdivides the network into six smaller subnetworks based on functional classification, and finds subsets for each one of them. The FCF procedure considers the network in its entirety. The reaction names in each row correspond to different coupled reaction sets. Underlined reactions highlight coupling relationships identified only using the FCF method, and the two arrows indicate the coupling of enzyme subsets across functional classifications. Reaction abbreviations can be found in the supplemental material of Schilling et al. (2002).
Directional Coupling
In the previous section, we focused on partially and fully coupled flux pairs. Here we highlight results for directional coupling, where a non-zero flux through certain reactions implies non-zero fluxes through others but not necessarily the reverse. First, we utilized the FCF procedure to detect coupled reaction sets, affected reactions, and equivalent knockouts in E. coli central metabolism for aerobic growth on glucose. We then extended our analysis to the genome-scale models of H. pylori, E. coli, and S. cerevisiae to identify the essential core of reactions required for biomass formation on a glucose-minimal medium and to examine the topological features of the identified reaction flux connected networks linked through directional coupling.
E. coli Central Metabolism
The coupling interactions for E. coli central metabolism are depicted pictorially in Figure 9. Due to the significant amount of redundant connectivity in central metabolism, no large fully coupled reaction sets were found. Instead, we identified seven fully coupled sets of two reactions (EDD/EDA, ZWF/PGL, ACEA/ACEB, GAP/PGK, GPM/ENO, PTA/ACK, GLT/ACN) corresponding to consecutive reactions in the network. We also found that the forward and backward directions of glycolysis, the pentose phosphate pathway, and the TCA cycle are completely disconnected from one another, although Figure 9 reveals a significant amount of internal coupling between the various reactions within each pathway. In addition, whereas Entner-Doudoroff glycolysis (i.e., EDD and EDA) is dependent on the activity of the forward direction of the pentose phosphate pathway, the anaplerotic and respiration reactions are not coupled with any reactions of the three major central metabolic pathways.
Figure 9.

The complete reaction coupling relationships in E. coli central metabolism for aerobic growth on glucose. Reversible reactions are listed by the reaction name, followed by _F and _B to denote the forward and backward directions, respectively. The reaction names and stoichiometry corresponding to the reaction abbreviations are found in the Supplementary material.
We next examined how FCF-derived directionality data along with knowledge of partially and fully coupled reactions enables the identification of missing elements of a metabolic reconstruction. Specifically, consider the set of reaction fluxes in Figure 9 which must be forced to zero under the steady-state assumption if the ZWF reaction is removed from the network. As explained previously, PGL is forced to zero if ZWF is knocked out, because the two reaction fluxes are fully coupled for aerobic growth on glucose. The FCF procedure also identifies five additional functionalities (i.e., EDD, EDA, GND, RPE_F, and TKT2_F) comprising the Entner Doudoroff pathway and part of the pentose phosphate pathway, which are eliminated upon the removal of ZWF. Interestingly, however, a recent study demonstrated that an E. coli mutant lacking glucose-6-phosphate dehydrogenase activity (ZWF) had residual activity through the Entner Doudoroff and/or pentose phosphate pathway, accounting for 7% of glucose metabolized (Fischer and Sauer 2003). Here, flux coupling analysis is useful by pinpointing where the metabolic reconstruction may be incomplete. Specifically, the “bypass” of the ZWF reaction could be explained by a glucose dehydrogenase reaction which enables the Entner Doudoroff and pentose phosphate pathways to operate even without the ZWF functionality (Fischer and Sauer 2003). Accordingly, the most recent E. coli stoichiometric model (Reed et al. 2003) includes this reaction, which is absent from the E. coli model used in this work (Edwards and Palsson 2000).
Flux coupling analysis can also be used to identify all equivalent knockouts or multiple targets for the removal of a particular reaction. For example, suppose one wants to prevent the pentose phosphate pathway reaction TKT2 from carrying flux in the forward direction. The FCF procedure identifies six functionalities (i.e., ZWF_F, PGL, GND, RPE_F, TKT1_F, and TALB_F) which could be alternatively eliminated to prevent TKT2_F from carrying flux under steady-state conditions. In the TCA cycle, the FCF procedure finds that the removal of GLTA or ACN_F ensures that the ICD_F reaction carries no flux. This is interesting because the elimination of isocitrate dehydrogenase (ICD_F) prevents E. coli growth on a glucose-minimal medium (Helling and Kukora 1971). Thus, flux coupling analysis correctly points out that the citrate synthase (GLTA; Lakshmi and Helling 1976) or aconitase (ACN_F; Gruer et al. 1997) mutations are also lethal for E. coli growth on glucose because they prevent the activity of isocitrate dehydrogenase.
Essential Reaction Core for Biomass Formation
The FCF procedure can be used to identify the essential core of metabolic reactions necessary for biomass formation for a given environmental condition. In Burgard et al. (2001), it was shown that the minimal set of E. coli reactions needed to support various levels of growth is a strong function of the uptake environment. Although the minimum number of reactions required for a given biomass yield is constant, there exist a myriad of alternate minimal reaction sets having the same number of reactions due to network redundancy. Using FCF, we can identify the conserved core of reactions present in all of these minimal reaction sets. Specifically, all reactions which are either partially (vbiomass ↔ vj), fully (vbiomass ⇔ vj), or directionally coupled (vbiomass → vj), to biomass production are essential for cellular growth. Overall, FCF determined the percentage of reactions in the essential core for aerobic growth on a glucose-minimal medium to be 59% (229 reactions), 28% (206 reactions), and 14% (166 reactions) for H. pylori, E. coli, and S. cerevisiae, respectively. These data are available upon request. Note that the size of the essential core of reactions is smaller than the minimal reaction sets (e.g., the minimal reaction set for E. coli growth on glucose contains 224 reactions (Burgard et al. 2001)). This is because non-unique, though necessary, functions are essential for growth in each network. This set of non-unique required reactions for growth is larger in the more complex S. cerevisiae and E. coli networks than in H. pylori, due to their inherent flexibility.
Scaling Properties of Directional Coupling
The connectivity of the directional couplings of the three metabolic networks was examined by constructing reaction maps where nodes correspond to metabolic functionalities, and arcs denote the presence and directionality of the coupling between reactions. It is important to note that unlike the study of Jeong et al. (2000), here nodes denote metabolic functionalities, not metabolites. Although metabolites cannot be “deleted” from a network, metabolic functionalities can be eliminated by deleting the appropriate gene or genes. Therefore, the vulnerability of the network to gene deletions can now be directly assessed. Reactions associated with coupled reaction sets are lumped together into super-nodes, one per partially/fully coupled set, because their directional coupling relationships are equivalent (Figs. 3, 9). Specifically, we examined whether the directional coupling between metabolic reactions is scale-free, characterized by a relatively small number of well connected nodes, or random, where the number of arcs associated with each node follows a Poisson distribution.
The number N(k) of nodes/reactions implying a certain number of k reactions is plotted in Figure 10 for H. pylori, E. coli, and S. cerevisiae growth on a glucose-minimal medium. We found that the connectivity of the three reaction maps is consistent with that of scale-free networks, as the number of nodes implying k other nodes decreases exponentially with k (Barabasi and Albert 1999). In all cases, the correlation exponents are less than two, meaning that if the networks continue to expand through evolution, the total number of directional flux couplings will grow faster than the total number of reactions, and no finite value can characterize the average coupling degree. These characteristics were encountered previously for many other types of investigated networks (Dorogovtsev and Mendes 2003). Thus, not only do the static features of metabolic networks (i.e., the connectivities of their metabolites) exhibit a scale-free topology (Edwards and Palsson 1999; Jeong et al. 2000; Wagner and Fell 2001), but also the stoichiometry driven couplings linking the individual reactions conform to a scale-free architecture. Interestingly, although the distribution of vertex degrees in the reaction-centered graph investigated by Wagner and Fell (2001) does not follow a power law, we found that the distribution of vertex degrees in the reaction flux-centered graphs does.
Figure 10.

The number of reactions N(k) implying k other reactions are plotted as a function of k for H. pylori, E. coli, and S. cerevisiae growth on a glucose-minimal medium.
The genome-wide coupling between metabolic reactions for E. coli growth on a glucose-minimal medium is shown in Figure 11 with and without the presence of a centralized biomass drain. Visual inspection of Figure 11 reveals many fundamental organizational principles of mature scale-free networks: the existence of a giant component consisting of nodes interconnected with short paths, hubs dominating the topology, and inhomogeneity and clustering features. Note that the presence of the biomass drain reaction, shown in the bottom left-hand corner of Figure 11A, is responsible for connecting a large percentage of the metabolic network through directional coupling.
Figure 11.

Genome-wide metabolic coupling for E. coli growth on a glucose-minimal medium with (A) or without (B) the presence of a biomass reaction. The biomass reaction is located in the bottom left corner of (A).
DISCUSSION
In this paper, we introduced the Flux Coupling Finder (FCF) procedure for identifying blocked and coupled reactions in genome-scale metabolic models. This identification can be made under different environmental conditions and growth demands. The approach is based on the successive solution of linear programming problems, which allows it to remain tractable for large metabolic networks involving many hundreds or even thousands of reactions. Consequently, the FCF method does not require breaking large metabolic networks into smaller subnetworks to identify coupled reaction sets, as this a priori clustering does indeed miss various couplings. It is important to note that flux coupling analysis identifies not only fully coupled reactions but also directionally and partially coupled reactions, unlike other approaches that focused on pinpointing enzyme subsets composed of only fully coupled reactions. As was shown earlier, partially as well as directionally coupled reactions are equally important to track.
The FCF procedure was applied to the three stoichiometric models of H. pylori, E. coli, and S. cerevisiae to provide a detailed analysis of their topological features. It was determined that 10%, 14%, and 29% of their respective reactions are blocked unconditionally. Furthermore, we found that the optimal growth of the larger networks involves a much higher percentage of blocked reactions. The percentage of reactions in coupled sets decreases substantially with model size, alluding to the greater flexibility and redundancy inherent in the larger models of E. coli and S. cerevisiae. Unlike blocked reactions, the partial and full coupling of reactions was found to be rather condition-independent, as the uptake conditions barely affect the percentage of reactions in coupled sets. Anaerobic conditions also had little impact on the coupling of reactions (data not shown).
Flux coupling analysis also revealed that postulating a constant biomass composition leads to the coupling of large sets of reactions in all three organisms. Interestingly, the size of the biomass-coupled subset is much larger in H. pylori than in E. coli or S. cerevisiae, as the more complex networks have the inherent flexibility to decouple the production of various biomass precursors from one another. For all three networks, allowing the biomass components to be drained independently of one another breaks these large sets of biomass-coupled reactions into smaller sets associated with a particular biomass precursor. The FCF procedure also led to the identification of the essential core of reactions whose activity is required for cellular growth for a given condition. This allows the lethality of any knockout to be quickly evaluated by examining the essential core of metabolic reactions required for cellular growth under the condition of interest. Reactions contained in this set are essential for biomass production for the examined condition, and thus their deletion is predicted to be fatal.
Concurrently, directional coupling data obtained from FCF were used to detect sets of affected reactions and equivalent knockouts in E. coli central metabolism for growth on glucose. Specifically, it was revealed that the forward and backward directions of glycolysis, the pentose phosphate pathway, and the TCA cycle are not stoichiometrically coupled to one another for growth on glucose. Although FCF does not make quantitative phenotypic predictions for a particular knockout, it allows the identification of all reactions forced to zero following the removal of a certain network function. In addition, FCF suggests multiple targets for removing a particular metabolic reaction by locating equivalent knockouts, and allows an immediate assessment of the consequences (i.e., affected reactions) of implementing any one of the candidate deletions. Finally, it was shown that not only the static but also the systemic features of metabolic networks captured with directional coupling exhibit a scale-free topology. Furthermore, the exponential correlation between k and N(k) improved substantially with increasing network size, suggesting that as network complexity/size increases, they are driven towards a scale-free architecture which is more resistant to random attacks (i.e., mutations). In this respect, it is important to mention that whereas general graph-theoretic approaches predict the functional vulnerability of free-scale networks to the removal of hubs (the most highly connected vertices), FCF allows for the classification between essential and non-essential hubs, as essential hubs are implied by many other reactions.
The FCF procedure can be used for both aiding metabolic reconstructions and guiding genetic manipulations. For example, blocked reactions may signify model omissions or incomplete pathways. Coupling information can be used to suggest multiple avenues for achieving a particular reaction inactivation, and to enable the quick assessment of the reactions forced to be inactivated upon a given deletion. The complete coupling characteristics of mutant networks can be established by reapplying the FCF procedure with the modified stoichiometric relations. Clearly the applications and implications of flux coupling analysis are not limited to those discussed in this paper. For example, it will be interesting to examine whether the expression levels of genes associated with partially or fully coupled reactions are correlated. Thus, the FCF output may also be used to supplement operon prediction tools, as coupled reactions could be under coordinated regulation. Preliminary comparisons of coupled reaction sets with operons available from the RegulonDB (Salgado et al. 2001) database revealed that about 30% of coupled reaction sets identified for E. coli growth on a complex medium include two or more genes from common operons. Almost half of such coupled reaction sets correspond exactly to operons. Due to its wide range of features and applicability to genome-scale networks, the Flux Coupling Finder procedure provides a useful framework for both modelers and experimentalists seeking to extract biologically meaningful information from metabolic reconstructions.
Acknowledgments
Financial support by the NSF Award BES0120277 and the U.S. DOE is gratefully acknowledged. The authors would also like to thank Priti Pharkya for helpful discussions and suggestions.
The publication costs of this article were defrayed in part by payment of page charges. This article must therefore be hereby marked “advertisement” in accordance with 18 USC section 1734 solely to indicate this fact.
APPENDIX A
Flux Ratio Maximization/Minimization Transformation Proof
In this appendix, we show that the nonlinear programming problem of flux ratio maximization or minimization can be recast as the linear programming problem presented previously in the Coupled Reactions section. For any two fluxes, v1 and v2, the maximization or minimization of their respective ratios is described mathematically as
 |
By multiplying the numerator and denominator of the objective function as well as all constraints by a positive variable t, an equivalent problem (P) is obtained.
 |
We next show that the following linear formulation (P′) is completely equivalent to problem (P).
 |
Specifically, the goal is to solve (P′) to obtain ( , t) and have v = /t solve (P). Note that the proof provided below is for the maximization case of the above formulations, as the proof for the minimization case can be obtained with the appropriate modifications.
Theorem: If there exists an optimal solution to (P) with v2 > 0, and there is also an optimal solution ( *, t*) to (P′), then v* = */t* solves (P).
Proof: Because ( *, t*) is optimal to (P′) it follows that * ≥ . By contradiction, suppose that v* = */t* does not solve (P) but there exists an optimal solution v′ to (P). Therefore, the following three conditions must be satisfied:
v′ must be feasible to (P)
v′2 > 0
v1′/v′2 > v1*/v2* because v* is suboptimal, whereas v′ is optimal.
Now let t′ = 1/v′2. Because v′2 > 0, we can deduce that
(i) t′ > 0. Also let ′ = t′ · v′, implying
(ii) ′2 = 1.
Following from condition (1) above,
(iii)
 |
From (i–iii), we see that t′ and ′ are feasible to (P′). Finally, from condition (3) we determine that v1′ · t′ > v1* · t* because v′2 · t′ = v2* · t* = 1. Therefore, we recover ′ > *, which contradicts the original assumption.
Therefore,
 |
confirming that the optimal objective function value to (P′) is equivalent to that of (P).
Article and publication are at http://www.genome.org/cgi/doi/10.1101/gr.1926504. Article published online before print in January 2004.
Footnotes
[Supplemental material is available online at www.genome.org.]
References
- Badarinarayana, V., Estep III, P.W., Shendure, J., Edwards, J., Tavazoie, S., Lam, F., and Church, G.M. 2001. Selection analyses of insertional mutants using subgenic-resolution arrays. Nat. Biotechnol. 19: 1060-1065. [DOI] [PubMed] [Google Scholar]
- Barabasi, A.L. and Albert, R. 1999. Emergence of scaling in random networks. Science 286: 509-512. [DOI] [PubMed] [Google Scholar]
- Burgard, A.P. and Maranas, C.D. 2001. Probing the performance limits of the Escherichia coli metabolic network subject to gene additions or deletions. Biotechnol. Bioeng. 74: 364-375. [DOI] [PubMed] [Google Scholar]
- Burgard, A.P., Vaidyaraman, S., and Maranas, C.D. 2001. Minimal reaction sets for Escherichia coli metabolism under different growth requirements and uptake environments. Biotechnol. Prog. 17: 791-797. [DOI] [PubMed] [Google Scholar]
- Burgard, A.P., Pharkya, P., and Maranas, C.D. 2003. OptKnock: A bilevel programming framework for identifying gene knockout strategies for microbial strain optimization. Biotechnol. Bioeng. 84: 647-657. [DOI] [PubMed] [Google Scholar]
- Carlson, R., Fell, D., and Srienc, F. 2002. Metabolic pathway analysis of a recombinant yeast for rational strain development. Biotechnol. Bioeng. 79: 121-134. [DOI] [PubMed] [Google Scholar]
- Covert, M.W. and Palsson, B.O. 2003. Constraints-based models: Regulation of gene expression reduces the steady-state solution space. J. Theor. Biol. 221: 309-325. [DOI] [PubMed] [Google Scholar]
- Covert, M.W., Schilling, C.H., Famili, I., Edwards, J.S., Goryanin, I.I., Selkov, E., and Palsson, B.O. 2001. Metabolic modeling of microbial strains in silico. Trends Biochem. Sci. 26: 179-186. [DOI] [PubMed] [Google Scholar]
- Dorogovtsev, S.N. and Mendes, J.F.F. 2003. Evolution of networks: From biological nets to the internet and WWW. Oxford University Press, Oxford, UK.
- Edwards, J.S. and Palsson, B.O. 1999. Systems properties of the Haemophilus influenzae Rd metabolic genotype. J. Biol. Chem. 274: 17410-17416. [DOI] [PubMed] [Google Scholar]
- ———. 2000. The Escherichia coli MG1655 in silico metabolic genotype: Its definition, characteristics, and capabilities. Proc. Natl. Acad. Sci. 97: 5528-5533. [DOI] [PMC free article] [PubMed] [Google Scholar]
- Edwards, J.S., Ibarra, R.U., and Palsson, B.O. 2001. In silico predictions of Escherichia coli metabolic capabilities are consistent with experimental data. Nat. Biotechnol. 19: 125-130. [DOI] [PubMed] [Google Scholar]
- Fischer, E. and Sauer, U. 2003. Metabolic flux profiling of Escherichia coli mutants in central carbon metabolism using GC-MS. Eur. J. Biochem. 270: 880-891. [DOI] [PubMed] [Google Scholar]
- Forster, J., Famili, I., Fu, P.C., Palsson, B., and Nielsen, J. 2003. Genome-scale reconstruction of the Saccharomyces cerevisiae metabolic network. Genome Res. 13: 244-253. [DOI] [PMC free article] [PubMed] [Google Scholar]
- Golub, G.H. and Van Loan, C.F. 1996. Matrix computations. Johns Hopkins University Press, Baltimore, MD.
- Gruer, M.J., Bradbury, A.J., and Guest, J.R. 1997. Construction and properties of aconitase mutants of Escherichia coli. Microbiology 143 (Pt 6): 1837-1846. [DOI] [PubMed] [Google Scholar]
- Heinrich, R. and Schuster, S. 1996. The regulation of cellular systems. Chapman & Hall, New York.
- Helling, R.B. and Kukora, J.S. 1971. Nalidixic acd-resistant mutants of Escherichia coli deficient in isocitrate dehydrogenase. J. Bacteriol. 105: 1224-1226. [DOI] [PMC free article] [PubMed] [Google Scholar]
- Ibarra, R.U., Edwards, J.S., and Palsson, B.O. 2002. Escherichia coli K-12 undergoes adaptive evolution to achieve in silico predicted optimal growth. Nature 420: 186-189. [DOI] [PubMed] [Google Scholar]
- Jeong, H., Tombor, B., Albert, R., Oltvai, Z.N., and Barabasi, A.L. 2000. The large-scale organization of metabolic networks. Nature 407: 651-654. [DOI] [PubMed] [Google Scholar]
- Kholodenko, B.N., Schuster, S., Rohwer, J.M., Cascante, M., and Westerhoff, H.V. 1995. Composite control of cell function: Metabolic pathways behaving as single control units. FEBS Lett. 368: 1-4. [DOI] [PubMed] [Google Scholar]
- Klamt, S. and Stelling, J. 2002. Combinatorial complexity of pathway analysis in metabolic networks. Mol. Biol. Rep. 29: 233-236. [DOI] [PubMed] [Google Scholar]
- ———. 2003. Two approaches for metabolic pathway analysis? Trends Biotechnol. 21: 64-69. [DOI] [PubMed] [Google Scholar]
- Klamt, S., Stelling, J., Ginkel, M., and Gilles, E.D. 2003. FluxAnalyzer: Exploring structure, pathways, and flux distributions in metabolic networks on interactive flux maps. Bioinformatics 19: 261-269. [DOI] [PubMed] [Google Scholar]
- Lakshmi, T.M. and Helling, R.B. 1976. Selection for citrate synthase deficiency in icd mutants of Escherichia coli. J. Bacteriol. 127: 76-83. [DOI] [PMC free article] [PubMed] [Google Scholar]
- Palsson, B.O., Price, N.D., and Papin, J.A. 2003. Development of network-based pathway definitions: The need to analyze real metabolic networks. Trends Biotechnol. 21: 195-198. [DOI] [PubMed] [Google Scholar]
- Papin, J.A., Price, N.D., Edwards, J., and Palsson, B. 2002. The genome-scale metabolic extreme pathway structure in Haemophilus influenzae shows significant network redundancy. J. Theor. Biol. 215: 67-82. [DOI] [PubMed] [Google Scholar]
- Pfeiffer, T., Sanchez-Valdenebro, I., Nuno, J.C., Montero, F., and Schuster, S. 1999. METATOOL: For studying metabolic networks. Bioinformatics 15: 251-257. [DOI] [PubMed] [Google Scholar]
- Pharkya, P., Burgard, A.P., and Maranas, C.D. 2004. Exploring the overproduction of amino acids using the bilevel optimization framework OptKnock. Biotechnol. Bioeng. (in press). [DOI] [PubMed]
- Price, N.D., Papin, J.A., and Palsson, B.O. 2002. Determination of redundancy and systems properties of the metabolic network of Helicobacter pylori using genome-scale extreme pathway analysis. Genome Res. 12: 760-769. [DOI] [PMC free article] [PubMed] [Google Scholar]
- Price, N.D., Papin, J.A., Schilling, C.H., and Palsson, B. 2003. Genome-scale microbial in silico models: The constraints-based approach. Trends Biotechnol. 21: 162-169. [DOI] [PubMed] [Google Scholar]
- Reed, J.L. and Palsson, B.O. 2003. Thirteen years of building constraint-based in silico models of Escherichia coli. J. Bacteriol. 185: 2692-2699. [DOI] [PMC free article] [PubMed] [Google Scholar]
- Reed, J.L., Vo, T.D., Schilling, C.H., and Palsson, B.O. 2003. An expanded genome-scale model of Escherichia coli K-12 (iJR904 GSM/GPR). Genome Biol. 4: R54. [DOI] [PMC free article] [PubMed] [Google Scholar]
- Rohwer, J.M., Schuster, S., and Westerhoff, H.V. 1996. How to recognize monofunctional units in a metabolic system. J. Theor. Biol. 179: 213-228. [DOI] [PubMed] [Google Scholar]
- Salgado, H., Santos-Zavaleta, A., Gama-Castro, S., Millan-Zarate, D., Diaz-Peredo, E., Sanchez-Solano, F., Perez-Rueda, E., Bonavides-Martinez, C., and Collado-Vides, J. 2001. RegulonDB (version 3.2): Transcriptional regulation and operon organization in Escherichia coli K-12. Nucleic Acids Res. 29: 72-74. [DOI] [PMC free article] [PubMed] [Google Scholar]
- Schilling, C.H. and Palsson, B.O. 2000. Assessment of the metabolic capabilities of Haemophilus influenzae Rd through a genome-scale pathway analysis. J. Theor. Biol. 203: 249-283. [DOI] [PubMed] [Google Scholar]
- Schilling, C.H., Letscher, D., and Palsson, B.O. 2000. Theory for the systemic definition of metabolic pathways and their use in interpreting metabolic function from a pathway-oriented perspective. J. Theor. Biol. 203: 229-248. [DOI] [PubMed] [Google Scholar]
- Schilling, C.H., Covert, M.W., Famili, I., Church, G.M., Edwards, J.S., and Palsson, B.O. 2002. Genome-scale metabolic model of Helicobacter pylori 26695. J. Bacteriol. 184: 4582-4593. [DOI] [PMC free article] [PubMed] [Google Scholar]
- Schuster, S. and Hilgetag, C. 1994. On elementary flux modes in biochemical reaction systems at steady state. J. Biol. Syst. 2: 165-182. [Google Scholar]
- Schuster, S., Fell, D.A., and Dandekar, T. 2000. A general definition of metabolic pathways useful for systematic organization and analysis of complex metabolic networks. Nat. Biotechnol. 18: 326-332. [DOI] [PubMed] [Google Scholar]
- Schuster, S., Pfeiffer, T., Moldenhauer, F., Koch, I., and Dandekar, T. 2002. Exploring the pathway structure of metabolism: Decomposition into subnetworks and application to Mycoplasma pneumoniae. Bioinformatics 18: 351-361. [DOI] [PubMed] [Google Scholar]
- Stelling, J., Klamt, S., Bettenbrock, K., Schuster, S., and Gilles, E.D. 2002. Metabolic network structure determines key aspects of functionality and regulation. Nature 420: 190-193. [DOI] [PubMed] [Google Scholar]
- Varma, A., Boesch, B.W., and Palsson, B.O. 1993. Stoichiometric interpretation of Escherichia coli glucose catabolism under various oxygenation rates. Appl. Environ. Microbiol. 59: 2465-2473. [DOI] [PMC free article] [PubMed] [Google Scholar]
- Wagner, A. and Fell, D.A. 2001. The small world inside large metabolic networks. Proc. R Soc. Lond. B Biol. Sci. 268: 1803-1810. [DOI] [PMC free article] [PubMed] [Google Scholar]