

Abstract
Recent studies have demonstrated neuroanatomically selective relationships among white matter tract microstructure, physiological function, and task performance. Such findings suggest that the microstructure of transcallosal motor fibers may reflect the capacity for interhemispheric inhibition between the primary motor cortices, although full characterization of the transcallosal inhibitory sensorimotor network is lacking. Thus, the goal of this study was to provide a comprehensive description of transcallosal fibers connecting homologous sensorimotor cortical regions and to identify the relationship(s) between fiber tract microstructure and interhemispheric inhibition during voluntary cortical activity. To this end, we assessed microstructure of fiber tracts connecting homologous sensorimotor regions of the cortex with diffusion tensor imaging. We also assessed interhemispheric inhibition by eliciting the ipsilateral silent period (iSP) within the same participants. We mapped mutually exclusive transcallosal connections between homologous sensorimotor regions and computed quantitative metrics of each fiber tract. Paralleling work in non‐human primates, we found the densest interhemispheric sensorimotor connections to be between the medial motor areas. Additionally, we provide a midsagittal callosal atlas in normalized Montreal Neurological Institute (MNI) space for future studies to use when investigating callosal fiber tracts connecting primary and secondary sensorimotor cortices. Finally, we report a strong, positive relationship (r = 0.76) between strength of interhemispheric inhibition (iSP) and microstructure of interhemispheric fibers that is specific to tracts connecting the primary motor cortices. Thus, increased fiber microstructure in young adults predicts interhemispheric inhibitory capacity. Hum Brain Mapp, 2013. © 2011 Wiley Periodicals, Inc.
Keywords: corpus callosum, diffusion tensor imaging, ipsilateral silent period, interhemispheric inhibition, tractography
INTRODUCTION
Execution of unimanual or asymmetric bimanual movement relies on cortical activity that is independently localized within each hemisphere (Carson 2005). Multiple lines of research indicate that the corpus callosum (CC) plays an integral role in this lateralization of control (Kennerley et al., 2002; Kobayashi et al., 2003; Tuller and Kelso, 1989). One standard approach to studying callosal function involves parsing the callosum into segments using a geometric scheme (Witelson, 1989). Numerous studies relying on this approach have identified associations between CC macrostructure, microstructure and behavior (Fling et al., 2011b; Fling et al., 2011a; Luders et al., 2010; Stancak et al., 2003; Sullivan et al., 2010b). Tractography analyses of diffusion tensor imaging (DTI) data may allow for a more fine‐grained approach to investigate regional specificity of callosal function. Recent studies utilizing fiber tractography have demonstrated relationships between specific interhemispheric fiber tract microstructure and task performance in both healthy participants (Johansen‐Berg et al., 2007) and in those with white matter dysfunction (Bartels et al., 2008; Bonzano et al., 2008; Kern et al. 2010).
Interhemispheric communication can have either net facilitatory or inhibitory effects (Chen et al., 2003); however, multiple lines of research indicate that callosal connections between the two motor cortices have primarily inhibitory effects (De Gennaro et al., 2004; Lenzi et al., 2007; Netz, 1999). Callosally mediated interhemispheric inhibition is a complex process that has traditionally been measured in humans using one of the following methods: (i) the transcranial magnetic stimulation (TMS)‐induced ipsilateral silent period (iSP) and (ii) paired‐pulse TMS to each primary motor cortex at an interstimulus interval of 8–12 ms [cf. Chen, 2004; short interval interhemispheric inhibition (SIHI)]. Although both the iSP and SIHI are reflective of transcallosal inhibition, they do not appear to represent the same phenomenon, nor are the two values correlated with each other within individuals (Chen et al. 2003). The iSP is elicited by focal TMS of the primary motor cortex ipsilateral to the hand making a voluntary contraction, leading to a brief suppression of voluntary activity in the electromyogram (EMG) signal of this muscle (Ferbert et al., 1992; Meyer et al., 1995). Therefore, the iSP represents interruption of voluntary cortical activity and likely relies upon γ‐aminobutyric acid (GABA)B receptors (Werhahn et al., 1999). Also relying upon GABA‐ergic neurotransmitters, SIHI is mediated by GABAA receptors (Hanajima et al. 1998) and reflects inhibition of synchronized activation of the corticospinal system induced by the conditioning stimulus (the first stimulus applied). Due to the fact that the iSP reflects inhibition of volitional motor activity, it appears to be particularly well suited to investigate interhemispheric control of voluntary cortical motor output (Giovannelli et al., 2009). The relationship between iSP and interhemispheric microstructure has yet to be well defined.
Experiments conducted with individuals with callosal pathology (e.g., partial callosotomy or multiple sclerosis) demonstrate that while the total number of callosal fibers connecting the two primary motor cortices is relatively few in number, communication between these homologous areas has the capability to strongly influence motor behavior (Bonzano et al. 2011; Eliassen et al. 1999; Eliassen et al. 2000; Kennerley et al. 2002; Lenzi et al. 2007). It is important to note that, in addition to the primary motor cortex (M1), multiple secondary motor regions also appear to be involved in this interhemispheric inhibitory network (Grefkes et al. 2008). For example, although full characterization of the transcallosal inhibitory sensorimotor network is still lacking, neuroimaging data suggest that it includes the supplementary (SMA) and pre‐SMA (Grefkes et al. 2008; Serrien et al. 2002), the dorsal premotor cortices (PMd) (Giovannelli et al., 2006; van den Berg et al., 2010), and the somatosensory cortices (Ni et al. 2009). While several studies have suggested that fiber tracts connecting these cortical regions play a role in interhemispheric inhibition, there has not been a comprehensive study examining the relationship between microstructure of fiber tracts connecting the sensorimotor cortical regions and interhemispheric inhibition during voluntary cortical activation.
Recent work suggests that the microstructure of transcallosal motor fibers, assessed with DTI, reflects the capacity for interhemispheric inhibition between the primary motor cortices. Wahl et al., (2007) report a positive relationship between microstructural integrity of transcallosal motor fibers and strength of inhibition as measured with SIHI in adults. Similarly, a positive relationship between interhemispheric inhibition (assessed by iSP area and duration) and callosal microstructure across development (range: ∼7–26 yrs.; Koerte et al., 2009) has been shown. However, further analysis of Koerte et al.'s dataset is warranted; it is clear that the observed relationship is strongly driven by the child group in their study (mean age: 8.4 yrs). In fact, it appears that the relationship between iSP and fiber microstructure may well be going in the opposite direction in their adult group (mean age: 25.9 yrs). Thus, as opposed to the relationship described by Wahl et al. (2007) when participants were at rest, it is possible that adults with better white matter microstructure [as assessed by fractional anisotropy (FA)] have reduced interhemispheric inhibition during volitional cortical activity. This hypothesis is supported by recent work from our lab demonstrating that higher CC microstructural integrity is associated with poorer performance on bimanual tasks requiring a large degree of interhemispheric inhibition (Fling et al., In press). Furthermore, it has previously been shown that musicians (experts in bimanual control) have reduced interhemispheric inhibition compared to non‐musicians (Ridding et al. 2000).
The goal of this study was to elucidate the relationship between CC structure and neurophysiological function, and their respective roles in motor control. Here, we provide a comprehensive description of transcallosal fiber tracts connecting homologous sensorimotor cortical regions, as well as a midsagittal callosal atlas in normalized MNI space for future studies to use when investigating callosal macro‐ and microstructure. Additionally, we determined the relationship(s) between neurophysiological function of volitional interhemispheric inhibition and the microstructure of these fibers. Based upon our recent work (Fling et al., In press) and that of others (Koerte et al., 2009), we hypothesized that there would be a negative relationship between microstructure of fiber tracts connecting primary motor cortices and volitional interhemispheric inhibition.
METHODS
Participants
Twenty‐one young adults (range: 19–28 yr of age; mean: 22.1 ± 2.8 yr; 10 males and 11 females) participated in this study. All individuals were right‐hand dominant as assessed by the Edinburgh Handedness Inventory (mean: 77.0 ± 0.08; Oldfield, 1971). This experiment was approved by the Medical Institutional Review Board of the University of Michigan. Participants gave their informed written consent prior to beginning the experiment and were compensated for their time.
We performed testing on 2 days, separated by less than 1 week. On the first day of testing, we acquired structural magnetic resonance (MR) and diffusion‐weighted (DW) images (detailed in the following section). On the second day of testing, we acquired iSP data from the first dorsal interosseous (FDI) muscle of the dominant hand as described later.
Image Acquisition
Whole brain high‐resolution structural MR images were collected on a 3T MRI scanner (General Electric, Waukesha, WI) using a spoiled gradient echo sequence (124 slices, field‐of‐view: 24 cm, voxel size: 0.94 × 0.94 × 1.4 mm, repetition time (TR): 10.2 ms and echo time (TE): 3.4 ms). DW images were collected using a single shot echoplanar sequence (39 slices; TE/TR: 82.8 ms/9000 ms; field of view: 220 mm × 220 mm; voxel size 0.9 × 0.9 × 3.1 mm; b value = 800 s/mm2; 15 diffusion‐sensitizing directions). Images were motion and eddy‐current corrected to account for drifts in scanner acquisition. Using the averaged images with b = 0 and b = 800 s/mm2, the diffusion tensor was calculated and FA images were constructed off‐line using ExploreDTI (Leemans et al., 2009). Diffusion tensors were calculated from the 15 DW images based upon a simple least squares fit of the tensor model to the diffusion data (Basser et al. 2000). Diagonalization of the tensor yields three voxel‐specific eigenvalues (λ1 > λ2 > λ3) representing diffusivities along the three principle directions of the tensor. The three eigenvalues were then used to construct fiber tracts and the resultant diffusion properties as described later.
Tractography
Each participant's resultant FA map was normalized into MNI space, aligned along the anterior/posterior commissure line with the coordinate 0, 0, 0 placed at the brain's center of mass, and voxel size was resampled to 2 × 2 × 2 mm through the use of ExploreDTI (Leemans et al., 2009). The human motor area template (HMAT; Mayka et al., 2006), transformed from its original Talairach space, was coregistered to each individual's MNI‐normalized FA image and subsequently used as a mask (Fig. 1A). The HMAT is the result of a meta‐analysis examining cortical activity assessed by functional MRI; strict inclusion criteria were used to identify six sensorimotor regions: PMd and ventral premotor cortices (PMv), SMA and pre‐SMA, M1, and the primary somatosensory cortices (S1). Due to the large interindividual variability of the central sulcus combined with the difficulty of normalizing this highly variable landmark, Mayka et al. (2006) suggest that the HMAT only serves as a functional guide in distinguishing between M1 and S1 cortical regions. Potentially as a result of this variability, we could not reliably identify interhemispheric fiber tracts connecting S1 regions in all participants using the HMAT. Given this, we included the cortical masks of Brodmann's areas (BA) 1, BA2, and BA3 provided by Explore DTI (Fig. 1B); we will refer to tracts identified by these masks as S1 tracts for the remainder of this article. Fiber tracts were constructed based upon deterministic streamline tractography using the method of Mori and van Zijl (cf., 2002). Tractography between seed and target regions of interest was performed using threshold parameters including a minimum fiber tracking threshold of 0.2 (e.g., 0.2 is the minimum FA of a voxel allowable in a fiber tract; this value is comparable with what has been used in other studies, Davis et al., 2009; Hofer and Frahm, 2006), a minimum fiber length of 50 mm, and a maximum deviation angle of 30° between contiguous voxels. Interhemispheric fiber tracts were identified by placing seed and target regions of interest in homologous cortical regions identified by the HMAT (e.g., right and left M1; Fig. 1C). Fiber tracking was performed for all regions identified by the HMAT, resulting in six possible interhemispheric tract bundles connecting homologous cortical regions (Fig. 1D).
Figure 1.
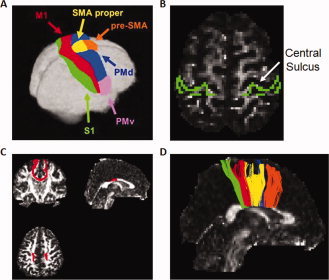
A) Human motor area template (HMAT; Mayka et al., Neuroimage 2006, 31, 1453‐1474 reprinted with permission from Elsevier). The HMAT was coregistered to each individual's fractional anisotropy map and used as a mask to map homologous interhemispheric fiber connections. B) Masks of BA1, BA2, and BA3 used to identify interhemispheric tracts connecting S1 cortical regions (Z = 48). Masks are shown overlaid on one representative subject's fractional anisotropy map., One representative example of interhemispheric fiber tracts projecting between the bilateral primary motor cortices (0, −2, 30). D) All interhemispheric fiber tracts identified with the HMAT for one representative participant. Fiber tracts are color coded to match the HMAT (Fig. 1A) and represent fibers connecting S1 (green), M1 (red), SMA (yellow), PMd (blue) and pre‐SMA (orange). No interhemsipheric tracts between PMv were identified in any participants.
Interhemispheric Inhibition
On day 2, a subset of 16 participants from the initial imaging session underwent a TMS procedure to assess volitional interhemispheric inhibition. Five participants from the first day of testing were unable to undergo the TMS procedure based on screening (four individuals were taking prescription medication with possible contraindications and one individual had a familial history of epilepsy). Participants were seated in a chair with both their dominant and nondominant forearms resting on a table. Shoulders were abducted at approximately 45°, the elbows were flexed at approximately 90°, and forearms were pronated with the palms of the hand lying flat on the custom apparatus. The wrist, third, fourth, and fifth fingers were constrained from moving, isolating force production to the index finger. A preamplified force transducer (OMEGA LC509‐015 Beam Load Cell) was positioned at the lateral aspect of the proximal interphalangeal joint of the isolated index finger to record compressive isometric force (output: 0.5–9.5 Vdc; excitation: 24 Vdc ±4 Vdc).
Surface electromyography and motor evoked potentials (MEPs) were recorded from the FDI muscle of both hands using 4 mm Ag/AgCl− electrodes placed on the muscle in a belly‐tendon arrangement. Surface EMG and MEP data were recorded using Biopac hardware and AcqKnowledge software (BIOPAC Systems, Goleta, CA). The raw EMG signal was collected and digitized at 2000 Hz, amplified and band pass filtered (10–1000 Hz). Data were collected at 2 kHz as it has previously been shown to produce the most accurate estimate of mean consecutive difference (MCD) of prestimulus EMG activity, necessary to accurately calculate the iSP (Garvey et al., 2001).
Estimation of the Maximal Voluntary Contraction and Resting Motor Threshold
Participants were instructed to press as hard as possible on the load cell using index finger abduction of the dominant hand for three consecutive 6‐second trials (Fling et al., 2009). The force applied to the load cell was displayed on the video monitor, providing online visual feedback during the maximal voluntary contraction (MVC) trials. The highest force sample in each trial was averaged across three MVC trials, providing an estimate of the participants' MVC. A 60‐second rest period was provided in between each MVC trial.
Prior to performing the experimental paradigm, we used a Magstim Rapid magnetic stimulator (The Magstim Company, Spring Gardens, Whitland, Carmarthenshire, UK) and a focal figure of eight coil (diameter of each wing 70 mm) to stimulate the right M1. The coil was placed tangential to the scalp with the handle pointing backwards and 45° away from the midline (Chen et al., 2003). The optimum site in the right M1 (hotspot) for eliciting motor responses in the left FDI was identified at supra‐threshold intensity. This location was utilized to elicit iSPs from the right FDI as it has previously been shown that the topography of the contralateral MEP and the iSP correspond closely (Wasserman et al., 1991). Resting motor threshold (RMT) was determined to the nearest 1% of the maximum stimulator output. Using the standard protocol, the RMT was defined as the minimum stimulus intensity which elicited MEPs >50 μV in at least 5 out of 10 consecutive trials (Triggs et al., 1994).
Experimental Task
The force target levels used in the experiment were scaled to 20% of each individual subject's MVC. Participants viewed a yellow, horizontal target line that spanned the width of a video monitor (placed at 20% of MVC). Force output was sampled at 200 Hz; for each instant in time that force was sampled (0.005 s), a green pixel appeared on the monitor corresponding to the amount of force produced providing the participant with on‐line, real‐time visual feedback of their performance. Using their dominant hand, participants were instructed to overlay their green force trace onto the yellow target line for three 40‐second trials. Once participants reached the target force level, an iSP was elicited from the dominant hand by stimulation given at 120% of RMT to the right motor cortex (Giovannelli et al., 2009). During each 40‐second trial, five iSPs were evoked with an interstimulus interval jittered between 5–8 seconds resulting in a total of 15 iSPs per participant (Garvey et al., 2001; Jung & Ziemann 2006). Participants were provided rest breaks of 5 minutes in between each trial. EMG data were also collected and monitored from the nondominant, left hand to ensure that the TMS coil was always in the appropriate location over the right M1. During one trial in two different participants, MEPs ceased to be elicited from the left FDI. On each occasion data collection was halted and the right M1 hotspot for the FDI was relocated.
Data Analysis
Fiber tractography
Multiple descriptive metrics were calculated for each fiber tract including the number of identifiable points composing fiber tract streamlines connecting each homologous sensorimotor region of interest pair (henceforth referred to as number of interhemispheric fiber tract connections), FA, and radial diffusivity ((λ2 + λ3)/2). FA, a rotationally invariant index that ranges from 0 (isotropic) to 1 (anisotropic), is a measure of the magnitude and orientation of diffusion derived from the tensor's eigenvalues on an intravoxel basis (Sullivan et al., 2010a). Therefore, higher FA values are interpreted as reflecting better white matter microstructure (Basser and Pierpaoli 1996). Conversely, lower radial diffusivity is interpreted as being indicative of better tract microstructure (Basser et al., 2000). Mean values of the aforementioned metrics were calculated for all identified interhemispheric fiber tracts within each participant. Additionally, the average coordinate position of each interhemispheric fiber tract within the CC was identified on a midsagittal slice (X = 0) for all participants.
Ipsilateral silent period
The iSP was calculated by using an objective, graphical method described in detail by Garvey et al. (2001). Single EMG trials (15 total per participant) were rectified and averaged across trials. Using a custom MATLAB program (The MathWorks, Natick, MA), upper and lower variation limits of the EMG signal were calculated by determining the MCD of EMG data points 100 ms prior to stimulation: mean prestimulus EMG ± (|MCD| × 1.77). These limits encompassed 95% of possible prestimulus EMG data points (equivalent to two standard deviations). Onset and offset of iSP were identified using the following criteria: (1) time of onset was the first of five consecutive data points to fall below the lower variation limit; (2) all subsequent data points were considered part of the iSP until there was a return of sustained EMG activity; (3) time of offset was defined as the first data point to rise above the lower variation limit if 50% or more of the data points in the following 5 ms window were also above the variation limit (Fig. 2: Garvey et al., 2001). In addition to measuring the onset, offset and duration of the iSP, the depth of the iSP was defined in two ways as previously described by Jung and Ziemann (2006): (1) the minimum EMG level during the iSP (diSP‐max), and (2) the average EMG level during the iSP (diSP). The diSP and diSP‐max were expressed as percentages of the mean prestimulus EMG. Therefore, the greater the suppression of ipsilateral EMG activity during the iSP, the larger the diSP (and diSP‐max). This is interpreted as increased interhemispheric inhibition (Garvey et al., 2001).
Figure 2.
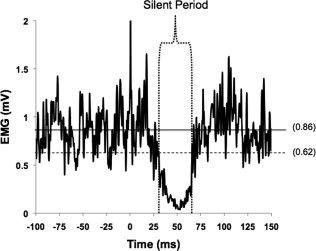
Representative EMG from one subject. Data displayed are the rectified average of 15 iSPs (stimulation applied at time 0) obtained during 20% MVC isometric contraction. The horizontal solid line represents mean prestimulus EMG activity (0.86 mV). The horizontal dotted line represents the lower variability limit (0.62 mV). Vertical dotted lines encompass the ipsilateral silent period.
Force data
The initial 5 seconds of each force time series was removed to eliminate the transitory performance in achieving the force target. Force data were digitally filtered using a 4th order Butterworth filter with a low‐pass cutoff frequency of 20 Hz. All data processing and subsequent time and frequency analyses were performed using software written in MATLAB (The MathWorks, Natick, MA). Similar to previous work, the amount of force output variability was assessed by calculating the within‐trial mean and the root mean square error from the target (Vaillancourt et al., 2003).
Statistical Analysis
A repeated measures analysis of variance was used to analyze metrics of interhemispheric fiber tracts with fiber tract treated as a within‐subject variable and significance set at an alpha of 0.05 (SPSS 17.0). The Huyn‐Feldt epsilon was computed to test for sphericity; we interpreted corrected P values in cases of violation. Significant main effects were subjected to posthoc paired t tests and corrected for multiple comparisons (α = 0.05/4). Additionally, we used linear regression analysis to investigate relationships between diSP and interhemispheric fiber tract microstructure (as assessed by FA), while correcting for multiple comparisons (α = 0.05/5). Presented values are mean ± standard deviation unless otherwise noted.
RESULTS
The spatial distribution and ordering of fiber tracts depicted for the representative participant in Figure 1D was observed in all participants.
Sensorimotor Fiber Tractography
No interhemispheric fiber tracts were found between homologous PMv for any of the participants. Descriptive metrics of the five remaining interhemispheric fiber tracts can be viewed in Table I. A main effect of fiber tract was found for interhemispheric fiber tract connections (F4,76 = 64.2, P < 0.001), FA (F4,76 = 21.4, P < 0.001), and radial diffusivity (F4,76 = 20.77, P < 0.001).
Table I.
Interhemispheric sensorimotor fiber tract metrics
| Fiber tract connections | FA | Radial diffusivity (×10−3 mm2/s) | |
|---|---|---|---|
| S1 | 6657.5d (922.8) | 0.519c (0.03) | 0.574c (0.05) |
| M1 | 13559.9c (1428.1) | 0.542b (0.02) | 0.544b (0.03) |
| SMA | 32377.7a (2226.8) | 0.564a (0.02) | 0.499a (0.03) |
| PMd | 7468.7d (1365.7) | 0.558a (0.03) | 0.532a (0.04) |
| Pre‐SMA | 21598.9b (1206.9) | 0.541b (0.02) | 0.524b (0.03) |
Data for interhemispheric fiber tract connections are mean (±SEM), while all other data are presented as mean (±standard deviation). Significant differences between fiber tracts (P < 0.05) were assessed by paired t tests—the same letter within each column indicates tracts that were not significantly different from each other.
Interhemispheric Fiber Tract Connections
Paired t tests revealed that there were significantly more fiber tracts connecting homologous SMA regions than M1, S1, PMd, and pre‐SMA (P < 0.001). There were also significantly more fibers connecting pre‐SMA than M1, S1, or PMd (P < 0.001). Lastly, fibers connecting M1 were significantly greater in number than those connecting S1 or PMd (P < 0.01). No difference was noted in the number of tracts connecting S1 or PMd (P > 0.51).
Fiber Microstructure
Similar to previous work in young adults (Fling et al., In press), radial diffusivity and FA were highly correlated within all interhemispheric fiber tracts (r > 0.8). As a result we only discuss fiber microstructure in terms of FA; however, metrics of radial diffusivity within each fiber tract can be viewed in Table I. Posthoc paired t tests revealed that FA values connecting the homologous SMAs were significantly greater than pre‐SMA, M1, and S1 (P < 0.001 in all cases). No difference was found between SMA and PMd fiber microstructure (P > 0.12). The mean FA of fiber tracts connecting PMd was significantly greater than those connecting pre‐SMA, M1 and S1 (P < 0.01 in all cases). Lastly, no differences were noted in microstructural integrity between tracts connecting pre‐SMA and M1 cortical regions (P > 0.77), however both were significantly greater than fibers projecting to bilateral S1 (P < 0.01 in both cases).
Homologous Interhemispheric Sensorimotor Fiber Tract Locations Within the CC
We identified the average y‐ and z‐coordinate of each fiber tract on a midsagittal slice of the CC (X = 0) both at the individual and group level. The individual and mean group locations of these tracts can be viewed in MNI space in Figure 3. The average location on the CC where each of the five interhemispheric sensorimotor tracts crosses can be viewed in Table II. It should be noted that although there are gaps on the CC where no fiber tracts are displayed (e.g., between SMA and M1 fibers) this does not indicate that no fibers were identified within the CC at those specific locations. The depiction in Figure 3 is solely providing the average tract location; a complete example of identified fiber pathways can be viewed in Figure 1D.
Figure 3.
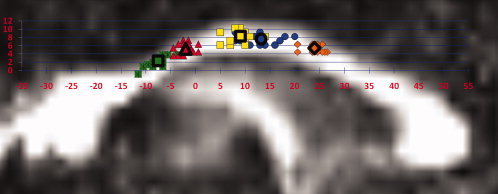
Individual participants' average y‐ and z‐ coordinates of transcallosal fiber pathways (X = 0). Average tract locations are depicted by symbols outlined in black. Data are displayed on a representative fractional anisotropy map normalized to MNI space with 0, 0, 0 placed at the brain's center of mass. Locations represent fibers connecting S1 (dark squares), M1 (triangles), SMA (light squares), PMd (circles), and pre‐SMA (diamonds). Fiber locations are color‐coded to match the HMAT (Fig. 1A) S1 (green), M1 (red), SMA (yellow), PMd (blue), and pre‐SMA (orange) in the on‐line version of this manuscript. [Color figure can be viewed in the online issue, which is available at wileyonlinelibrary.com.]
Table II.
Average interhemispheric fiber location on a midsagittal slice of the corpus callosum (X = 0)
| Average y | Average z | |
|---|---|---|
| S1 | −8.0 (−15 to 1) | 2.45 (−5 to 9) |
| M1 | −1.64 (−9 to 8) | 5.76 (1 to 11) |
| SMA | 9.05 (−5 to 23) | 8.1 (3 to 13) |
| PMd | 13.1 (1 to 25) | 7.45 (3 to 13) |
| Pre‐SMA | 24.6 (13 to 35) | 5.86 (1 to 13) |
Data are reported in MNI space with 0, 0, 0 placed at the center of mass of the brain. Values are the group mean and ranges are provided in parentheses.
Force Data
The group mean MVC value from the FDI was 18.9 N (±5.7). Participants were able to perform the unimanual isometric task in a consistent manner; force was maintained at 93.7% (±5.4%) of the target force goal. Further, the mean root mean square error of 0.031 (±0.02) indicates that variability was low across all participants.
TMS—iSP
iSPs were reliably produced in all 16 participants. We performed an average of 15.2 stimulations (range = 15–18 stimulations) to produce the 15 silent periods we used to average iSP data per participant. Quantitative metrics of the iSP can be viewed in Table III. Duration of iSP and diSP were significantly correlated with each other (r = 0.70; P < 0.01); therefore we use diSP to refer to strength of interhemispheric inhibition for the remainder of the manuscript.
Table III.
Resting motor threshold (RMT; relative to maximal stimulator output) and ipsilateral silent period (iSP) metrics
| RMT (%) | 63.6 (4.9) |
| iSP Onset latency (ms) | 38.4 (3.4) |
| iSP Duration (ms) | 27.7 (8.8) |
| diSP (%) | 73.6 (6.2) |
| diSP‐max (%) | 91.9 (4.6) |
Values are mean (±standard deviation).
Relationships Between Sensorimotor Fiber Microstructure and Interhemispheric Inhibition
We found a significant relationship between metrics of M1 transcallosal fiber microstructure (FA) and diSP (r = 0.76; P < 0.0001; Fig. 4). A trend was observed for a relationship between diSP and FA of fiber tracts connecting S1 (r = 0.55; P < 0.05) and PMd (r = 0.54; P < 0.05); however, neither association was significant after correcting for multiple comparisons. No relationships were noted between fiber microstructure of either SMA (r = 0.28) or pre‐SMA (r = 0.08) with diSP (P > 0.3 in both cases).
Figure 4.
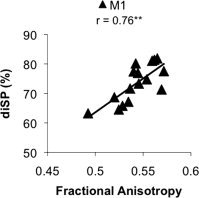
Positive linear relationship (**P < 0.001) between strength of interhemispheric inhibition (diSP) and microstructure of fiber tracts connecting bilateral primary motor cortices (assessed by FA).
DISCUSSION
In this study, we mapped distinct transcallosal sensorimotor connections and identified quantitative metrics for each fiber tract. Additionally, we have provided a mid‐sagittal callosal atlas in normalized MNI space for future studies to use when investigating callosal macro‐ and microstructure of sensorimotor connections. Finally, we observed a positive relationship between volitional interhemispheric inhibition and microstructure specific to fibers connecting homologous M1 regions.
Interhemispheric Sensorimotor Fiber Tractography
Interhemispheric fiber tract connections
Several key findings from the current study provide information about sensorimotor connections that are in agreement with previous work in non‐human primates as well as fiber tractography studies in humans. Anatomical tracer work in non‐human primates has demonstrated that the main callosal connections of M1, SMA, PMd, and PMv are with homotopic sites in the contralateral hemisphere (Dancause et al., 2007; Fang et al., 2009; Rouiller et al., 1994). Similar to anatomical tracer work performed in galagos (Fang et al., 2008) and macaque monkeys (Rouiller et al., 1994), the largest quantities of interhemispheric tracts in the current study were found between homologous SMA and pre‐SMA cortical regions. Conversely, the fewest interhemispheric fiber tract connections were observed in fiber tracts connecting PMd and S1 cortical areas. Again, this is in agreement with previous work demonstrating consistent, but relatively sparse transcallosal connections between PMd (Fang et al., 2008) and S1 (Pandya and Vignolo, 1968). We were unable to identify interhemispheric PMv connections in any individuals; it is possible that due to the lateral location of PMv within each hemisphere, deterministic fiber tractography is unable to reliably identify fibers projecting to these cortical areas. That is to say, there are major crossing fiber pathways (e.g. superior longitudinal fasciculus) that may result in too much diffusion signal loss for the current study to identify these lateral PMv connections.
A significant body of literature has identified transcallosal connections between homologous M1 regions, both within human and non‐human brains. While dense connections between M1 trunk and face representations have reliably been identified, M1 forelimb and hand representations typically have scant callosal connections (Fang et al., 2009; Rouiller et al., 1994). These callosal connections appear to be fairly homotopic, although it should be noted that M1 appears to also have limited callosal connections with additional contralateral cortical regions including SMA and PMd (Fang et al., 2009). The current study demonstrates relatively dense M1 callosal connections, and although we do not identify the specific cortical target of these fiber tracts (e.g. hand or face regions of the precentral gyrus), the relationships with physiological function discussed below provide strong evidence that the M1 fiber pathways we have identified play a significant role in interhemispheric inhibitory function during volitional motor output. Although the cortical termination sites of identified interhemispheric fiber tracts are relatively medial (Fig. 1C), this is in agreement with previous research both in human and non‐human primates (Bonzano et al., 2008; Fang et al., 2009; Rouiller et al., 1994; Sullivan et al., 2010a, 2010b; Wahl et al., 2007).
Fiber microstructure
We note significant microstructural integrity differences of fiber tracts connecting homologous sensorimotor cortical regions. Previous studies have inferred metrics of interhemispheric microstructure from the data obtained solely within the CC (Fling et al., In press; Koerte et al., 2009; Wahl et al., 2007). However, it is likely that integrity of the entire interhemispheric tract influences transcallosal communication. For example, recent work has demonstrated that distal callosal fibers projecting to sensorimotor cortical areas show greater degradation than those within the body of the CC in healthy older adults (Sullivan et al., 2010a). Here, we report metrics of transcallosal microstructure based upon the entirety of interhemispheric tracts.
Previous work has shown white matter integrity (as assessed by FA) to be low in areas of the CC containing fibers connecting primary and secondary motor regions in comparison to values within the genu and the splenium (Fling et al., In press; Hofer and Frahm, 2006). In the current study we show that there are significant differences in fiber microstructure even within the callosal midbody sensorimotor fiber tracts. FA was observed to be the greatest for tracts connecting SMA and PMd in the current study. Importantly, fiber microstructure does not appear to be a function of the number of interhemispheric fiber tract connections; fibers connecting SMA were the most numerous whereas fibers connecting PMd were among the sparsest. Further supporting this finding, fibers connecting S1 regions (less numerous than PMd fibers) were found to have the poorest microstructure of the five interhemispheric tracts identified.
Sensorimotor fiber location within the CC
A novel contribution from the current study is that we provide a mid‐sagittal callosal atlas in normalized MNI space for future studies to use when investigating callosal macro‐ and microstructure of homologous sensorimotor connections. Moving through the CC posteriorly to anteriorly, our results are in line with previous tractography work identifying S1 connections traversing the isthmus, and M1 fiber pathways within the posterior mid‐body of the CC (Hofer and Frahm, 2006; Wahl et al., 2007). Conversely, white matter tracts connecting homologous SMA regions were identified to traverse the midpoint of the CC (anterior to posterior), slightly more posterior than previous geometric segmentation approaches have suggested (Hofer and Frahm, 2006). The same was observed for fiber tracts within the anterior mid‐body of the CC projecting to PMd and pre‐SMA, respectively. Therefore, all of the fiber tracts projecting to secondary motor areas (SMA, PMd, and pre‐SMA) were identified as crossing more posterior within the CC than geometric segmentation approaches have indicated (see Fig. 5 ). An additional novel finding from the current study reports tracts connecting PMd cortical regions crossing the CC posterior to pre‐SMA fiber tracts. Again, this is at odds with previous geometric segmentation approaches reporting connections between premotor areas crossing the CC anterior to SMA and pre‐SMA fiber tracts (Witelson, 1989).
Figure 5.
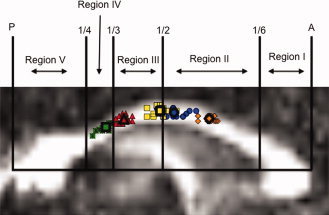
Individual participants' average y‐ and z‐coordinates of transcallosal fiber pathways (color coded to match Fig. 3) with the geometric segmentation of Hofer and Frahm overlaid. These regions are purported to contain fibers that project to Region I (anterior 1/6): prefrontal; region II (anterior 1/2 minus region I): premotor and supplementary motor; region III (posterior 1/2 minus region IV and V): motor; region IV (posterior 1/3 minus region V): sensory; region V (posterior 1/4): parietal, temporal, and occipital. It is clear from the current data that while this geometric segmentation provides a general rubric, the fibers projecting to sensorimotor cortical regions require a more specified approach. A, anterior; P, posterior. Fiber locations are color‐coded to match the HMAT (Fig. 1A) S1 (green), M1 (red), SMA (yellow), PMd (blue), and pre‐SMA (orange) in the on‐line version of this manuscript. [Color figure can be viewed in the online issue, which is available at wileyonlinelibrary.com.]
Previous studies have used a geometric segmentation scheme for parsing the CC when investigating relationships between behavior, physiology and callosal metrics. Oftentimes this geometric segmentation lumps together fibers projecting to multiple cortical targets; for example, PMv, PMd, pre‐SMA, and SMA tracts are all included in one CC segment by Hofer and Frahm (2006). This leaves the interpretation of results subject to a fair amount of speculation as it is unclear which interhemispheric fiber tracts are driving the observed relationship(s). Thus, solely using geometric segmentation to identify pertinent white matter tracts can result in the inclusion of multiple interhemispheric fiber tracts that may have little to no relevance. We provide MNI coordinates (Table II) for future studies to utilize as seed regions when investigating transcallosal fiber pathways with specific sensorimotor cortical targets. We believe that using the seed regions identified with the current template will allow for more specific research questions to be addressed through the identification of relevant fiber tracts. For example, if one were to use region III as described by Hofer and Frahm (2006), not only would fiber tracts projecting to homologous M1 cortical areas be included but also a large volume of fiber tracts connecting bilateral SMAs would be as well (Fig. 5). While the coordinates we provide give detailed locations of sensorimotor fibers within the CC, due to the large amount of overlap one likely cannot distinguish between fiber tracts connecting homologous SMA and PMd regions.
Ipsilateral Silent Period
Giovannelli et al. (2009) have recently shown that the iSP is characterized by substantial topographical, temporal, and neuronal circuit specificity. They also demonstrate the functional significance of the pathway(s) mediating iSP as they likely play pivotal roles in suppressing mirror activity during unimanual actions. While it is possible that the iSP relies on direct descending oligosynaptic pathways from the ipsilateral cortex, the most likely mechanism underlying the iSP involves interhemispheric connections through the CC projecting to the contralateral motor cortex. This is supported by the fact that iSPs are preserved in patients with subcortical cerebrovascular lesions that interrupt the corticospinal tract but not the CC (Boroojerdi et al. 1996). Furthermore, iSP is delayed or prolonged in neurological disorders affecting the CC such as multiple sclerosis (Schmierer et al. 2000) and no detectable iSP is found in preschool children who have yet to develop a functionally competent CC (Heinen et al. 1998), nor in patients with callosal agenesis (Meyer et al., 1995, 1998). Thus, the iSP has been proposed as a simple, clinical diagnostic tool for assessing callosal function (Meyer et al. 1999).
Contrary to our hypothesis, results from this study show that the strength of interhemispheric inhibition (as assessed by diSP) is strongly positively correlated with FA of interhemispheric fibers. This relationship was restricted to transcallosal fibers connecting the primary motor cortices, although fiber tracts between homologous S1 and PMd cortical targets showed a similar trend. Previous work investigating similar relationships across early development revealed positive associations between iSP duration and microstructure of the posterior mid‐body (Koerte et al., 2009), an area of the CC now reliably shown to contain fibers connecting bilateral M1 (Hofer and Frahm, 2006; Wahl et al., 2007). However, this relationship does not appear to exist in the subset of mature adults within Koerte et al.'s (2009) data sample.
Why then, do we show a positive relationship between M1 fiber tract microstructure and diSP? This study provides information about transcallosal microstructure along the entire fiber tract, not just from a mid‐sagittal slice. Furthermore, we do not use a callosal geometric segmentation approach; therefore our results are not confounded by including transcallosal fibers that may be irrelevant to the relationships being studied (e.g., fibers connecting bilateral SMAs). Additionally, Koerte et al. (2009) provided stimulation to all participants at an absolute intensity (80% of stimulator output) as opposed to a relative intensity of each participant's motor threshold. Previous work has demonstrated that stimulator intensity has a significant effect on both iSP duration and area (Chen et al., 2003). Thus, not adjusting stimulator intensity to an individual's relative motor threshold poses a significant confound for Koerte et al. results. Based upon the current work and taking into account the findings of Wahl et al., (2007), increased microstructure of transcallosal fibers connecting M1s appears to allow for an increased ability to inhibit the contralateral hemisphere in young adults. Thus, while SIHI and iSP reflect differing phenomena, both appear to be related to M1 callosal tract FA in a similar manner. It is worth noting that increased interhemispheric inhibitory capabilities (and increased callosal FA) may not always be beneficial for uni‐ and bimanual motor control (cf. Fling et al., 2011), whereas previous work suggests that increased interhemispheric inhibition is beneficial to prevent interference on cognitive tasks requiring cortical lateralization (Muller‐Oehring et al., 2007).
Finally, we note a relationship, although not significant, between diSP and PMd tract microstructure. Multiple lines of research implicate the PMd in regulating interhemispheric communication, with particular emphasis on inhibitory projections to the contralateral M1 (Giovannelli et al., 2006; Koch et al., 2006; van den Berg et al., 2010). Recently, it was shown that functional connectivity between the left dorsal PMC to the right dorsal PMC and M1 is state dependent, such that its influence on the other hemisphere is modulated as a function of motor task demands (Bestmann et al. 2008). Specifically, the involvement of PMd appears to be more readily apparent during movement preparation. Therefore, it is perhaps not surprising that in this study where force production was constant, we do not report a significant relationship between PMd microstructure and strength of interhemispheric inhibition.
CONCLUSION
We have demonstrated the ability to map transcallosal sensorimotor fiber pathways and have provided an atlas in MNI space for future use. In addition, we report a positive relationship between interhemispheric fiber microstructure and strength of volitional interhemispheric inhibition. Future work is still required to describe how modulation of these interhemispheric inhibitory effects relates to motor control. As there are sparse interhemispheric connections between the homologous hand M1 areas future work would also benefit by further describing muscle specificity of iSP. For example, it may be that the iSP is stronger in more proximal muscles with denser interhemispheric connections. Future work investigating topographical specificity of stimulation location on iSP would also be beneficial. For example, it would be of interest to identify whether stimulation of areas with known inhibitory effects on the contralateral M1, such as the ipsilateral SMA or PMd, also evokes an iSP.
Acknowledgements
The authors thank Dr. David Vaillancourt, Dr. Alexander Leemans, Dr. Stephan Taylor, Dr. Patricia Reuter‐Lorenz, and Yanin Vongkancom for their assistance with this study.
REFERENCES
- Bartels C, Mertens N, Hofer S, Merboldt KD, Dietrich J, Frahm J, Ehrenreich H ( 2008): Callosal dysfunction in amyotrophic lateral sclerosis correlates with diffusion tensor imaging of the central motor system. Neuromuscul Disord 18: 398–407. [DOI] [PubMed] [Google Scholar]
- Basser PJ, Pajevic S, Pierpaoli C, Duda J, Aldroubi A ( 2000): In vivo fiber tractography using DT‐MRI data. Magn Reson Med 44: 625–632. [DOI] [PubMed] [Google Scholar]
- Basser PJ, Pierpaoli C ( 1996): Microstructural and physiological features of tissues elucidated by quantitative‐diffusion‐tensor MRI. J Magn Reson B 111: 209–219. [DOI] [PubMed] [Google Scholar]
- Bestmann S, Swayne O, Blankenburg F, Ruff CC, Haggard P, Weiskopf N, Josephs O, Driver J, Rothwell JC, Ward NS ( 2008): Dorsal premotor cortex exerts state‐dependent causal influences on activity in contralateral primary motor and dorsal premotor cortex. Cereb Cortex 18: 1281–1291. [DOI] [PMC free article] [PubMed] [Google Scholar]
- Bonzano L, Tacchino A, Roccatagliata L, Abbruzzese G, Mancardi GL, Bove M ( 2008): Callosal contributions to simultaneous bimanual finger movements. J Neurosci 28: 3227–3233. [DOI] [PMC free article] [PubMed] [Google Scholar]
- Bonzano L, Tacchino A, Roccatagliata L, Mancardi GL, Abbruzzese G, Bove M ( 2011): Structural integrity of callosal midbody influences intermanual transfer in a motor reaction‐time task. Hum Br Map 32: 218–228. [DOI] [PMC free article] [PubMed] [Google Scholar]
- Boroojerdi B, Diefenbach K, Ferbert A ( 1996): Transcallosal inhibition in cortical and subcortical cerebral vascular lesions. J Neurol Sci 144: 160–170. [DOI] [PubMed] [Google Scholar]
- Carson RG ( 2005): Neural pathways mediating bilateral interactions between the upper limbs. Brain Res Brain Res Rev 49: 641–662. [DOI] [PubMed] [Google Scholar]
- Chen R ( 2004): Interactions between inhibitory and excitatory circuits in the human motor cortex. Exp Brain Res 154: 1–10. [DOI] [PubMed] [Google Scholar]
- Chen R, Yung D, Li JY ( 2003): Organization of ipsilateral excitatory and inhibitory pathways in the human motor cortex. J Neurophysiol 89: 1256–1264. [DOI] [PubMed] [Google Scholar]
- Dancause N, Barbay S, Frost SB, Mahnken JD, Nudo RJ ( 2007): Interhemispheric connections of the ventral premotor cortex in a new world primate. J Comp Neurol 505: 701–715. [DOI] [PMC free article] [PubMed] [Google Scholar]
- Davis SW, Dennis NA, Buchler NG, White LE, Madden DJ, Cabeza R ( 2009): Assessing the effects of age on long white matter tracts using diffusion tensor tractography. Neuroimage, 46: 530–541. [DOI] [PMC free article] [PubMed] [Google Scholar]
- De Gennaro L, Cristiani R, Bertini M, Curcio G, Ferrara M, Fratello F, Romei V, Rossini PM ( 2004): Handedness is mainly associated with an asymmetry of corticospinal excitability and not of transcallosal inhibition. Clin Neurophysiol 115: 1305–1312. [DOI] [PubMed] [Google Scholar]
- Eliassen JC, Baynes K, Gazzaniga MS ( 1999): Direction information coordinated via the posterior third of the corpus callosum during bimanual movements. Exp Brain Res 128: 573–577. [DOI] [PubMed] [Google Scholar]
- Eliassen JC, Baynes K, Gazzaniga MS ( 2000): Anterior and posterior callosal contributions to simultaneous bimanual movements of the hands and fingers. Brain 123: 2501–2511. [DOI] [PubMed] [Google Scholar]
- Fang PC, Stepniewska I, Kaas JH ( 2008): Corpus callosum connections of subdivisions of motor and premotor cortex, and frontal eye field in a prosimian primate, Otolemur garnetti J Comp Neurol 508: 565–578. [DOI] [PubMed] [Google Scholar]
- Ferbert A, Caramia D, Priori A, Bertolasi L, Rothwell JC ( 1992): Cortical projection to erector spinae muscles in man as assessed by focal transcranial magnetic stimulation. Electroencephalogr Clin Neurophysiol 85: 382–387. [DOI] [PubMed] [Google Scholar]
- Fling BW, Knight CA, Kamen G ( 2009): Relationships between motor unit size and recruitment threshold in older adults: implications for size principle. Exp Brain Res 197: 125–133. [DOI] [PubMed] [Google Scholar]
- Fling BW, Peltier SJ, Bo J, Welsh RC, Seider RD ( 2011a): Age differences in interhemispheric interactions: callosal structure, physiological function, and behavior. Front Neurosci 5: 38. [DOI] [PMC free article] [PubMed] [Google Scholar]
- Fling BW, Walsh CM, Bangert A, Reuter‐Lorenz PA, Welsh RC, Seidler RD ( 2011b): Differential Callosal Contributions To Bimanual Control in Young and Older Adults. J Cogn Neurosci 23: 2151–2165. [DOI] [PMC free article] [PubMed] [Google Scholar]
- Garvey MA, Ziemann U, Becker DA, Barker CA, Bartko JJ ( 2001): New graphical method to measure silent periods evoked by transcranial magnetic stimulation. Clin Neurophysiol 112: 1451–1460. [DOI] [PubMed] [Google Scholar]
- Giovannelli F, Borgheresi A, Balestrieri F, Ragazzoni A, Zaccara G, Cincotta M, Ziemann U ( 2006): Role of the right dorsal premotor cortex in “physiological” mirror EMG activity. Exp Brain Res 175: 633–640. [DOI] [PubMed] [Google Scholar]
- Giovannelli F, Borgheresi A, Balestrieri F, Zaccara G, Viggiano MP, Cincotta M, Ziemann U. ( 2009): Modulation of interhemispheric inhibition by volitional motor activity: an ipsilateral silent period study. J Physiol 587( Pt 22): 5393–5410. [DOI] [PMC free article] [PubMed] [Google Scholar]
- Grefkes C, Eickhoff SB, Nowak DA, Dafotakis M, Fink GR ( 2008): Dynamic intra‐ and interhemispheric interactions during unilateral and bilateral hand movements assessed with fMRI and DCM. Neuroimage 41: 1382–1394. [DOI] [PubMed] [Google Scholar]
- Hanajima R, Ugawa Y, Terao Y, Sakai K, Furubayashi T, Machii K, Kanazawa I. ( 1998): Paired‐pulse magnetic stimulation of the human motor cortex: differences among I waves. J Physiol 509( Pt 2): 607–618. [DOI] [PMC free article] [PubMed] [Google Scholar]
- Heinen F, Glocker FX, Fietzek U, Meyer BU, Lucking CH, Korinthenberg R ( 1998): Absence of transcallosal inhibition following focal magnetic stimulation in preschool children. Ann Neurol 43: 608–612. [DOI] [PubMed] [Google Scholar]
- Hofer S, Frahm J ( 2006): Topography of the human corpus callosum revisited–comprehensive fiber tractography using diffusion tensor magnetic resonance imaging. Neuroimage 32: 989–994. [DOI] [PubMed] [Google Scholar]
- Johansen‐Berg H, Della‐Maggiore V, Behrens TE, Smith SM, Paus T ( 2007): Integrity of white matter in the corpus callosum correlates with bimanual co‐ordination skills. Neuroimage 36( Suppl 2): T16–T21. [DOI] [PMC free article] [PubMed] [Google Scholar]
- Jung P, Ziemann U ( 2006): Differences of the ipsilateral silent period in small hand muscles. Muscle Nerve 34: 431–436. [DOI] [PubMed] [Google Scholar]
- Kennedy KM, Raz N ( 2009): Aging white matter and cognition: differential effects of regional variations in diffusion properties on memory, executive functions, and speed. Neuropsychologia 47: 916–927. [DOI] [PMC free article] [PubMed] [Google Scholar]
- Kennerley SW, Diedrichsen J, Hazeltine E, Semjen A, Ivry RB ( 2002): Callosotomy patients exhibit temporal uncoupling during continuous bimanual movements. Nat Neurosci 5: 376–381. [DOI] [PubMed] [Google Scholar]
- Kern KC, Sarcona J, Montag M, Giesser BS, Sicotte NL ( 2011): Corpus callosal diffusivity predicts motor impairment in relapsing‐remitting multiple sclerosis: A TBSS and tractography study. Neuroimage 55: 1169–1177 [DOI] [PubMed] [Google Scholar]
- Kobayashi M, Hutchinson S, Schlaug G, Pascual‐Leone A ( 2003): Ipsilateral motor cortex activation on functional magnetic resonance imaging during unilateral hand movements is related to interhemispheric interactions. Neuroimage 20: 2259–2270. [DOI] [PubMed] [Google Scholar]
- Koch G, Franca M, Del Olmo MF, Cheeran B, Milton R, Alvarez Sauco M, Rothwell JC ( 2006): Time course of functional connectivity between dorsal premotor and contralateral motor cortex during movement selection. J Neurosci 26: 7452–7459. [DOI] [PMC free article] [PubMed] [Google Scholar]
- Koerte I, Heinen F, Fuchs T, Laubender RP, Pomschar A, Stahl R, Berweck S, Winkler P, Hufschmidt A, Reiser MF ( 2009): Anisotropy of callosal motor fibers in combination with transcranial magnetic stimulation in the course of motor development. Invest Radiol 44: 279–284. [DOI] [PubMed] [Google Scholar]
- Leemans A, Jeurissen B, Sijbers J, and Jones DK ( 2009): ExploreDTI: a graphical toolbox for processing, analyzing, and visualizing diffusion MR data. In: 17th Annual Meeting of Intl Soc Mag Reson Med, p. 3537, Hawaii, USA.
- Lenzi D, Conte A, Mainero C, Frasca V, Fubelli F, Totaro P, Caramia F, Inghilleri M, Pozzilli C, Pantano P ( 2007): Effect of corpus callosum damage on ipsilateral motor activation in patients with multiple sclerosis: a functional and anatomical study. Hum Brain Mapp 28: 636–644. [DOI] [PMC free article] [PubMed] [Google Scholar]
- Luders E, Thompson PM, Toga AW. ( 2010): The development of the corpus callosum in the healthy human brain. J Neurosci 30( 33): 10985–10990. [DOI] [PMC free article] [PubMed] [Google Scholar]
- Mayka MA, Corcos DM, Leurgans SE, Vaillancourt DE ( 2006): Three‐dimensional locations and boundaries of motor and premotor cortices as defined by functional brain imaging: A meta‐analysis. Neuroimage 31: 1453–1474. [DOI] [PMC free article] [PubMed] [Google Scholar]
- Meyer BU, Roricht S, Grafin von Einsiedel H, Kruggel F, Weindl A. ( 1995): Inhibitory and excitatory interhemispheric transfers between motor cortical areas in normal humans and patients with abnormalities of the corpus callosum. Brain 118( Pt 2): 429–440. [DOI] [PubMed] [Google Scholar]
- Meyer BU, Roricht S, Niehaus L ( 1998): Morphology of acallosal brains as assessed by MRI in six patients leading a normal daily life. J Neurol 245: 106–110. [DOI] [PubMed] [Google Scholar]
- Meyer BU, Roricht S, Schmierer K, Irlbacher K, Meierkord H, Niehaus L, Grosse P ( 1999): First diagnostic applications of transcallosal inhibition in diseases affecting callosal neurones (multiple sclerosis, hydrocephalus, Huntington's disease) Electroencephalogr Clin Neurophysiol Suppl 51, 233–242. [PubMed] [Google Scholar]
- Mori S, van Zijl PC ( 2002): Fiber tracking: Principles and strategies—a technical review. NMR Biomed 15: 468–480. [DOI] [PubMed] [Google Scholar]
- Muller‐Oehring EM, Schulte T, Raassi C, Pfefferbaum A, Sullivan EV ( 2007): Local‐global interference is modulated by age, sex and anterior corpus callosum size. Brain Res 1142: 189–205. [DOI] [PMC free article] [PubMed] [Google Scholar]
- Netz J ( 1999): Asymmetry in transcallosal inhibition. Electroencephalogr Clin Neurophysiol Suppl 51: 137–144. [PubMed] [Google Scholar]
- Ni Z, Gunraj C, Nelson AJ, Yeh IJ, Castillo G, Hoque T, Chen R ( 2009): Two phases of interhemispheric inhibition between motor related cortical areas and the primary motor cortex in human. Cereb Cortex 19: 1654–1665. [DOI] [PubMed] [Google Scholar]
- Oldfield RC ( 1971): The assessment and analysis of handedness: The Edinburgh inventory. Neuropsychologia 9: 97–113. [DOI] [PubMed] [Google Scholar]
- Pandya DN, Vignolo LA ( 1968): Interhemispheric neocortical projections of somatosensory areas I and II in the rhesus monkey. Brain Res 7: 300–303. [DOI] [PubMed] [Google Scholar]
- Ridding MC, Brouwer B, Nordstrom MA ( 2000): Reduced interhemispheric inhibition in musicians. Exp Brain Res 133: 249–253. [DOI] [PubMed] [Google Scholar]
- Rouiller EM, Babalian A, Kazennikov O, Moret V, Yu XH, Wiesendanger M ( 1994): Transcallosal connections of the distal forelimb representations of the primary and supplementary motor cortical areas in macaque monkeys. Exp Brain Res 102: 227–243. [DOI] [PubMed] [Google Scholar]
- Schmierer K, Niehaus L, Roricht S, Meyer BU ( 2000): Conduction deficits of callosal fibres in early multiple sclerosis. J Neurol Neurosurg Psychiatry 68: 633–638. [DOI] [PMC free article] [PubMed] [Google Scholar]
- Serrien DJ, Strens LH, Oliviero A, Brown P ( 2002): Repetitive transcranial magnetic stimulation of the supplementary motor area (SMA) degrades bimanual movement control in humans. Neurosci Lett 328: 89–92. [DOI] [PubMed] [Google Scholar]
- Stancak A, Cohen ER, Seidler RD, Duong TQ, Kim SG ( 2003): The size of corpus callosum correlates with functional activation of medial motor cortical areas in bimanual and unimanual movements. Cereb Cortex 13: 475–485. [DOI] [PubMed] [Google Scholar]
- Sullivan EV, Rohlfing T, Pfefferbaum A ( 2010a): Longitudinal study of callosal microstructure in the normal adult aging brain using quantitative DTI fiber tracking. Dev Neuropsychol 35: 233–256. [DOI] [PMC free article] [PubMed] [Google Scholar]
- Sullivan EV, Rohlfing T, Pfefferbaum A ( 2010b): Quantitative fiber tracking of lateral and interhemispheric white matter systems in normal aging: relations to timed performance. Neurobiol Aging 31: 464–481. [DOI] [PMC free article] [PubMed] [Google Scholar]
- Triggs WJ, Calvanio R, Macdonell RA, Cros D, Chiappa KH ( 1994): Physiological motor asymmetry in human handedness: evidence from transcranial magnetic stimulation. Brain Res 636: 270–276. [DOI] [PubMed] [Google Scholar]
- Tuller B, Kelso JA ( 1989): Environmentally‐specified patterns of movement coordination in normal and split‐brain subjects. Exp Brain Res 75: 306–316. [DOI] [PubMed] [Google Scholar]
- Vaillancourt DE, Newell KM ( 2003): Aging and the time and frequency structure of force output variability. J Appl Physiol 94: 903–912. [DOI] [PubMed] [Google Scholar]
- van den Berg FE, Swinnen SP, Wenderoth N ( 2010): Hemispheric asymmetries of the premotor cortex are task specific as revealed by disruptive TMS during bimanual versus unimanual movements. Cereb Cortex 20: 2842–2851. [DOI] [PubMed] [Google Scholar]
- Wahl M, Lauterbach‐Soon B, Hattingen E, Jung P, Singer O, Volz S, Klein JC, Steinmetz H, Ziemann U ( 2007): Human motor corpus callosum: Topography, somatotopy, and link between microstructure and function. J Neurosci 27: 12132–12138. [DOI] [PMC free article] [PubMed] [Google Scholar]
- Wassermann EM, Fuhr P, Cohen LG, Hallett M ( 1991): Effects of transcranial magnetic stimulation on ipsilateral muscles. Neurology 41: 1795–1799. [DOI] [PubMed] [Google Scholar]
- Werhahn KJ, Kunesch E, Noachtar S, Benecke R, Classen J ( 1999): Differential effects on motorcortical inhibition induced by blockade of GABA uptake in humans. J Physiol 517( Pt 2): 591–597. [DOI] [PMC free article] [PubMed] [Google Scholar]
- Witelson SF ( 1989): Hand and sex differences in the isthmus and genu of the human corpus callosum. A postmortem morphological study. Brain 112( Pt 3): 799–835. [DOI] [PubMed] [Google Scholar]