

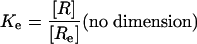
Abstract
On the basis of the 3D structures of the extracellular ligand-binding domains of the epidermal growth factor (EGF) receptor (EGFR) and ErbB3, a mechanism has been proposed for how the extracellular region of the EGFR is maintained in an autoinhibited configuration and for how EGF binding induces EGFR dimerization and activation. We have attempted to derive a mathematical model for EGF binding to the EGFR and for ligand-induced receptor dimerization and activation that uses this structural information and can explain the characteristic concave-up curvilinear Scatchard plots seen when EGF binding to intact EGFR is studied in living cells. We show that these curvilinear plots cannot be accounted for by simply ascribing different affinities to the autoinhibited and extended (dimeric) configurations of the receptor seen in structural studies. Concave-up plots can only be obtained by including in the mathematical model an additional binding event in which occupied EGFR dimers bind to an “external site.” The external site may represent receptor interactions with coated-pit regions in the cell membrane or with other cellular components involved in receptor endocytosis and turnover. We conclude in this study and in the accompanying article that the active extended EGFR configuration binds EGF 5- to 20-fold more strongly than the autoinhibited monomeric receptor configuration. However, these extended receptors do not correspond directly with the “high-affinity” EGF-binding sites seen in EGF-binding studies on intact cells.
The epidermal growth factor (EGF) receptor (EGFR) belongs to a family of receptor tyrosine kinases whose other members include ErbB2, ErbB3, and ErbB4. Targeted disruption of the various members of the EGFR family has shown that these receptors play a critical role in the control of a host of cellular activities including cell division, differentiation, and migration (1). Furthermore, overexpression or dysregulation of the EGFR family members has been implicated in a variety of human cancers, such as mammary carcinoma, glioblastomas, and squamous carcinoma. ErbB receptors have therefore been the target of intensive experimental study (2). It is now well established that the EGFR is activated by ligand-induced receptor dimerization, which stimulates its intrinsic protein tyrosine kinase activity, leading to autophosphorylation and receptor activation (1). Because growth factor binding represents the initial step required for activating these receptors, a great deal of work has focused on elucidating the details of ligand binding and how it induces receptor dimerization and activation.
Quantitative binding experiments with 125I-labeled EGF carried out on intact EGFR-expressing cells have demonstrated that the EGFR exhibits two apparent affinities for EGF. When binding data are analyzed by the Scatchard method, a concave-up curvilinear plot is obtained. A small fraction (2–5%) of receptors display a high EGF-binding affinity (KD = 10–100 pM), represented by the initial steep slope of the Scatchard curve, whereas the majority of receptors (95–98%) display a significantly lower measured affinity (KD = 2–5 nM) represented by the shallow slope of the Scatchard curve (3, 4).
The extracellular ligand-binding region of EGFR can be divided into four subdomains designated I, II, III, and IV, with domains I and III participating in ligand binding (5). Crystal structures of the extracellular regions of monomeric EGFR and ErbB3 and of dimeric ligand-bound EGFR suggested a mechanism for how the receptor is maintained in an autoinhibited configuration and for how ligand binding induces receptor dimerization and activation (6–10). In the absence of ligand, specific intramolecular interactions between domains II and IV maintain the extracellular region of receptor in an autoinhibited or tethered conformation (7, 8). Ligand then binds simultaneously to both domains I and III, drawing them closer to one another and stabilizing an extended conformation of the receptor, in which domain II is exposed so that its dimerization arm is available for mediating interactions with a neighboring receptor molecule (6, 10). An exposed arm in domain IV may also participate in intermolecular interactions in the EGFR dimer (9). It has been proposed that the enhanced ligand-binding affinity of the extended configuration shifts the tethered ↔ extended equilibrium to the right, favoring formation of the dimeric state and thus receptor activation (6–11). This mechanism for EGF-induced EGFR activation suggests that ligand binding to the EGFR is positively cooperative. Binding of EGF to one EGFR in the dimer is thought to stabilize the extended configuration, thus facilitating binding of a second EGF molecule to the remaining (extended) EGFR protomer in the dimer. However, such positive cooperativity results in concave-down Scatchard plots, which have not been reported for EGFR in intact cells. Mathematically simulated Scatchard plots that take into account experimentally relevant receptor concentrations and directly measured equilibrium constants all display concave-down curvature, which is indicative of such positive cooperativity (12). However, as mentioned above, Scatchard analysis of EGF binding to EGFR at the cell surface instead always yields concave-up plots that indicate negative (rather than positive) cooperativity or heterogeneity of sites. It has only been possible to generate mathematically simulated Scatchard plots with concave-up curvature by assuming heterogeneities in receptor density at the cell surface (13) or by assuming the existence of theoretical cellular molecules that “trap” the receptor in a high-affinity state (14).
The structural identification of different conformations of the EGFR and ErbB3 extracellular regions suggested an apparently straightforward mechanism to account for the dual-affinity classes observed for the EGFR on intact cells. The low-affinity binding sites might represent receptors in the autoinhibited conformation, whereas high-affinity binding sites might be accounted for by receptors in the active, extended configuration (6–11). The results presented here and in the accompanying article (15) suggest that, whereas this model for EGFR ligand binding and activation does appear to be valid, the interpretation of the EGF–EGFR Scatchard plots is incorrect. We have developed a mathematical analysis of ligand binding to EGFR with a theoretical modeling strategy that uses the available binding data and the EGFR crystal structures. In the accompanying article, we present an experimental evaluation of our model (15). We are unable to account for the concave-up character of experimentally observed Scatchard plots by using a model in which receptors in the active conformation bind ligand with high affinity and form receptor–receptor dimers. To obtain this curvilinearity it is necessary to allow ligand-bound receptor dimers to bind to an additional “external site.” We propose that receptors in the active conformation indeed bind ligand 5- to 20-fold more strongly than receptors in the autoinhibited configuration. These “active” receptors, however, are not identical with the receptor population represented by the high-affinity EGF-binding sites deduced from the initial steep slope of Scatchard plots seen in numerous EGF-binding experiments presented in the literature.
Results and Discussion
Model for EGF Binding to a Soluble Extracellular Ligand-Binding Domain. To separate out the contributions to the experimentally observed binding curves from different molecular events, we begin by describing a simple ligand-receptor model that includes a dimerization event. In this model (Fig. 1 A and B) we make several important assumptions that differentiate our model from those described previously. Taking into account the recent structural findings, we first assume that EGFR exists in one of two conformational states, an autoinhibited or closed state (R) and an active or extended state (Re) (6–10). Ligand (L) binds to a receptor in state R with dissociation constant Kl and to a receptor in state Re with dissociation constant K, and biochemical data suggest that these are different. The interconversion between the two EGFR conformations, both unliganded and bound to ligand, is represented schematically in Fig. 1 A.
Fig. 1.

Schematic depiction of the interactions between EGF and EGFR together with their dissociation constants. (A) An EGFR in the conformationally extended state (Re) binds EGF (L) with higher affinity than a receptor in the autoinhibited state (R). (B) Receptors in the extended state can dimerize both in the absence and presence of ligand. (C) Dimerized receptors can bind to the external site (C) with high affinity. The extracellular portion of the EGFR is depicted in color, with domain I shown in blue, domain II shown in green, domain III shown in yellow, and domain IV shown in red. EGF (L) is depicted in purple.
In modeling the dimerization event, we make two additional assumptions. First, that Re and ReL can form homoand heterodimers, whereas R and RL cannot. Again, the available structural evidence strongly suggests that receptors must be in the extended configuration to participate in dimerization (6, 10). We also assume that the binding of L to Re and the dimerization of Re are independent events, based on the notion that R and Re are in dynamic equilibrium and that Re is thought to be structurally available for dimerization even in the absence of ligand. It is possible that a range of receptor conformations exists between the active conformation and the fully extended conformation of which only some might be available for dimerization. To avoid this difficulty we can consider the state Re to include only those conformations that are available for dimerization. In addition, the numerical values of the dimerization constants fitted in ref. 12 and summarized in An Estimate for Ke in Supporting Text, which is published as supporting information on the PNAS web site, support the view that this is a reasonable model of the dimerization event. Consequently, we use a single dimerization affinity instead of different affinities that depend on whether no, one, or two EGF molecules are bound to the pair of dimerizing receptors as has been done previously (12). Available structural evidence suggests that the presence of ligand influences the portion of receptors occupying the extended conformation, but not the nature of the extended conformation itself. We therefore assume that ligand does not directly affect the affinity of intermolecular interactions between receptor protomers. Finally, we assume that the binding of L to a receptor dimer is independent of whether the other EGF-binding site in the dimer is occupied. Thus, the affinity of EGF binding to an EGFR that is part of a dimer is the same whether or not the other receptor in the dimer is occupied by EGF. That these assumptions are justified is suggested by the symmetry of the ligand–receptor dimer complex together with the fact that no direct ligand–ligand interactions or interaction of a bound ligand with the ligand-binding domain of the other receptor protomer in the dimer pair occur. The dimerization event is represented schematically in Fig. 1B.
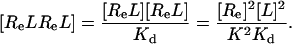
We can express each of the dissociation constants in this model as a function of the concentration of the various ligand–receptor complexes present. Thus, from the definitions we have:
 |
[1] |
 |
[2] |
 |
[3] |
 |
[4] |
 |
[5] |
 |
[6] |
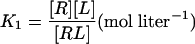
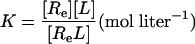
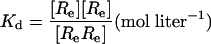
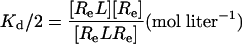
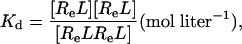
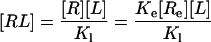
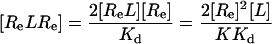
where [R] = concentration of the unliganded autoinhibited EGFR, [Re] = concentration of the unliganded monomeric extended or active conformation of the EGFR, and [L] = concentration of free EGF.
Rewriting Eqs. 1 through 6:
 |
[1′] |
 |
[2′] |
 |
[3′] |
 |
[4′] |
 |
[5′] |
 |
[6′] |
Balance of mass gives
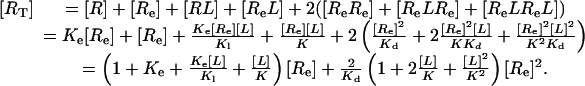 |
[7] |
This is a second-order equation of the form ax2 + bx + c = 0, which has the solution: 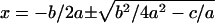 . Since
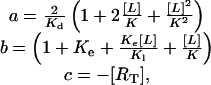 |
the solution to Eq. 7 can be written:
 |
[8] |
Concentrations have to be positive so we can discard the negative solution.
We can express the bound ligand concentration as:
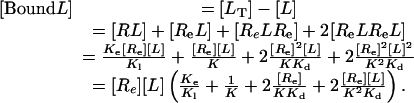 |
[9] |
Substituting Eq. 8 into Eq. 9 expresses [Bound L] as a function of [L]. We can also compute the concentration of dimers:
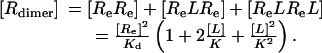 |
[10] |
Parametrization and Validation of the Model for EGF Binding to the Soluble Extracellular Ligand-Binding Domain. This model has as its experimentally controllable inputs [LT] and [RT] and we can generate simulated outputs such as [Bound L], [Bound R], and [Rdimer] for comparison with binding experiments such as plasmon resonance (Biacore, Piscataway, NJ) and small-angle x-ray scattering measurements (12). To generate these outputs, the parameters that need specification are the dissociation constants K, Ke, Kl, and Kd. Several experimental observations were used to parameterize and validate the model for the soluble receptor. First, the apparent KD for EGF binding to the soluble extracellular ligand-binding region [soluble EGFR (sEGFR)] has been reported as 135 nM for sEGFR produced in Sf9 cells and 400 nM for sEGFR produced in Chinese hamster ovary cells (8). These values represent composites of the four KD values of our model Ke, K1, K, and Kd. Direct plasmon resonance measurements (Biacore) of EGF binding to an isolated domain III derived from Chinese hamster ovary cells or insect gives a value of ≈400 nM (12, 16). These isolated domains were generated by limited proteolysis or expression in Sf9 cells, arguing that they represent completely folded subdomains; consequently, it is reasonable to begin the analysis by assuming that the affinity of EGF for isolated domain III is the same as its affinity for domain III when it is part of the complete sEGFR. By contrast, EGF binding to domain I alone is barely detectable in Biacore measurements and is estimated to be ≈100 μM (8). These findings suggest that Kl should be set to 400 nM (the KD for EGF binding to domain III alone) in the model. Biacore experiments with sEGFR, where bonds between domains II and IV were disrupted by substitution of key residues or by deletion of domain IV, show a KD for EGF binding in the range of 30–50 nM (8, 17). Based on the structure of sEGFR, it is reasonable to assume that the conformation of these variant soluble receptors is close to that of the wild-type sEGFR in its extended form. We therefore use a KD value in this range for K. Small-angle x-ray scattering analysis of sEGFR in the absence of ligand shows that no significant dimerization occurs for receptor concentrations up to at least 100 μM (12). This finding places a single constraint on a composite of the parameters Kd and Ke. This constraint is approximately of the form KdK2e ≈ 4 mM (see Derivation of KdK2c ≈ 4 mM in Supporting Text). When EGF is added to sEGFR with concentrations 45–82 μM in the small-angle x-ray scattering analysis, dimerization is nearly complete at a ligand-to-receptor ratio of 1:1. This finding can be compared with the simulated values for [Rdimer]. Estimates for Ke and Kd can be inferred from the previously derived dimerization affinities (12). In An Estimate for Ke, we justify the estimates Ke ≈ 20–30 and Kd ≈ 1–5 μM consistent with the constraint 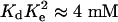 .
.
Concave-up Scatchard Plots Cannot Be Generated with This Model. We have simulated the Scatchard plot of the EGF–sEGFR dimerization model for values of the dissociation constants approximate to those discussed above (Fig. 2). The apparent affinity is ≈100 nM and the degree of dimerization at saturation is >80%, in reasonable agreement with experimental observations. As shown in Fig. 2 A, the resultant curve displays positive cooperativity for those values. In fact, nonnegative cooperativity will exist for any choices of association constants as long as K < Kl. Such nonnegative cooperativity has been shown mathematically and has been identified as an unresolved problem (12–14). 125I-labeled EGF-binding experiments carried out on full-length EGFRs expressed on the surface of intact cells instead typically generate Scatchard plots with concave-up curvature, whereas similar experiments on cells expressing receptors lacking cytoplasmic domains yield linear Scatchard plots (18–20). Because a common use of the Scatchard plot is to separate out the affinities for different classes of sites on a cell surface, it is perhaps understandable that the concave-up curvilinearity has been interpreted to indicate the presence of two separate conformational states of the EGFR, each with a different affinity for the ligand. The fact that this type of analysis is not valid when the states are interconvertible seems not to have always been realized, despite previous mathematical analysis (13). The two affinities observed on the concave-up Scatchard plots were erroneously thought to represent the active, extended state and the autoinhibited state, respectively (6–11). However, even though the inferences from experimental data were incorrect, the conclusion appears to be valid, and binding experiments and structural data suggest that EGF can bind to the sEGFR in at least two separate types of binding events (12). It has been proposed that ligand binding stabilizes the extended conformation of the receptor (10), which has the capacity to dimerize, leading to autophosphorylation and activaton of the cytoplasmic tyrosine kinase domain of EGFR. The structural data support this model in that they provide a molecular mechanism for the transition between the closed, autoinhibited conformation and the open, extended conformation (and dimer formation). However, the problem of explaining the concave-up curvilinear shape of the Scatchard plot remains unresolved. Our recent experimental data obtained with EGFR mutants suggest that dimerization is a precondition for the appearance of the initial steep downward-sloping part of the typical EGFR Scatchard plot (15). Thus, dimerization appears to be an essential part of any model that attempts to reproduce the behavior of the EGF–EGFR interaction on the cell surface. Deletion of the cytoplasmic domain has been reported to eliminate the “high-affinity” state from the Scatchard plot in EGF-binding experiments carried out on intact cells, suggesting the possibility that the cytoplasmic domain is directly involved in the regulation of the two different affinities observed in the Scatchard plot (18–20). These observations led to the formulation of a thermodynamic model in which EGFR is free to move between a high- and low-affinity conformational state. The model included a hypothetical unidentified cytosolic site that can bind to the receptor only in its extended conformation, subsequently stabilizing the high-affinity configuration of the receptor. This model, which does not include the dimerized state, has been shown capable of reproducing the concave-up Scatchard plot (14). Thus, binding of the extended EGFR conformation to an external site can result in a concave-up Scatchard plot (as observed experimentally in cellular studies), whereas its binding to another receptor protomer through dimerization can only result in concave-down Scatchard plots as discussed above. Binding to the external site is limited by the availability of such sites; therefore, a saturation of the affinity represented by the receptor–external site complex can occur.
Fig. 2.

Concave-up Scatchard plots cannot be simulated with the EGF–sEGFR dimerization model. The dimerization models depicted schematically in Fig. 1 A and B were solved mathematically, as shown in Eq. 7, in an excel spreadsheet where [RT] = 50 μM, Ke = 30, Kl = 600 nM, K = 20 nM, Kd = 1 μM, and increasing values for [L]. (A) Eq. 9 was used to generate simulated curves shown in the Scatchard plot. (B) The degree of dimerization for each of the EGF–sEGFR species was determined by using Eq. 10 as a function of increasing ligand concentrations. ×, [ReRe]; •, [ReLRe]; ⋄, [ReLReL]; and ♦, total [Rdimer].
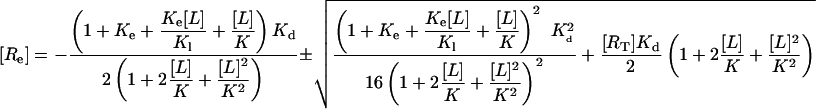
Proposed Model for EGFR–EGF Interaction on the Cell Surface. As described above, the model presented schematically in Fig. 1 A and B failed to simulate concave-up Scatchard plots, despite faithfully representing all available structural information and experimentally derived affinity constants. We therefore set out to create a model that includes all the ligand–receptor interactions shown in Fig. 1 A and B, but that would additionally allow us to simulate a Scatchard plot with concave-up curvature. To do this we allowed fully dimerized receptors to bind to an “external site” with high affinity, as shown schematically in Fig. 1C. This model can be solved mathematically (see Model Incorporating Extended State, Dimerization, and an External Binding Site in Supporting Text) and is summarized in the following formulas:
 |
[11] |
and
 |
[12] |
where
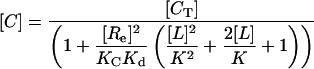 |
[13] |
and
 |
[14] |
Parameters and Sensitivities of the External-Site Model. With this model it is possible to simulate a concave-up Scatchard plot, as shown in Fig. 3. We have chosen the same affinities as for the binding to soluble receptor. We considered it reasonable that the dissociation constants K, Kl, and Ke should be the same as defined for the EGF–sEGFR interaction, because these constants derive from binding events that, based on the structure, are not influenced by cytoplasmic or transmembrane interactions. It is less certain whether the cytoplasmic portion of the receptor contributes to the binding interaction for the dimerization constant Kd. We nevertheless begin by using the same value for Kd as in the model for the soluble receptor. For the apparent concentration of receptor [RT] we use the value 1 μM, a value that we justify in Apparent Concentration of Receptor on the Cell Surface in Supporting Text, by using an “average distance to nearest neighbor” approach (21). The concentration of the external site, [CT], we set to 0.05 μM or 5% of [RT], in accord with the observation that ≈5% of receptors give rise to the apparent high-affinity branch of the curvilinear Scatchard plot. For the Scatchard plot to show two separate affinities, on the one hand, it is necessary for the number of external sites to be less than the number of receptor dimers. However, enough external sites must exist to bind a meaningful number of receptors. To produce a concave-up plot, it is also necessary that the binding to the external site (KC) has sufficiently high affinity (<10–9); here, we have set it equal to 10–15. Thus, we see that the concave-up curvilinear plot observed in experiments can be reproduced in our model with parameters that are consistent with experimental observations. The degree of dimerization is significantly lower than in the model of the binding to soluble receptor (<30% vs. >90%). This difference is because the apparent concentration of the receptor, calculated in Apparent Concentration of Receptor on the Cell Surface, is only 4% of the value used in the model of the soluble receptor (2 μM vs. 50 μM). From Fig. 3 one can also conclude that the apparent affinity of the shallow slope of the Scatchard plot is ≈200 nM, whereas experiments on intact cells show a significantly higher affinity (2 nM). It is tempting to increase the dimerization affinity; however, this increases the apparent affinity only slightly, whereas the concave-up feature of the Scatchard plot becomes much less pronounced (Fig. 4 A and B). Because experiments on intact cells are done on cells with overexpressed receptor, one needs to exercise caution in drawing conclusions for cells with normal amounts of receptor. If, for instance, the receptor concentration is lowered by a factor of 10, then the receptor is more or less fully dimerized even in the absence of ligand. This finding is due to the relative abundance of external sites that trap and stabilize the dimer (Fig. 5 A and B). On the other hand, lowering the affinity of the dimer for the external site from 10–15 to 10–11 restores the dependence of the dimerization event on the presence of ligand (Fig. 5 C and D). Changing the value of KC to 10–11 does not significantly alter the dimerization curves generated for the higher concentration (1 μM) of receptor (Figs. 3 C and D and 4 C and D). Thus, one can speculate that the binding affinity to the external site might be finely tuned to generate the correct dimerization response to the presence of ligand. It is also possible that low concentrations of unliganded receptors on intact cells are unable to reach a true equilibrium with the high-affinity external site, which would indicate that perhaps an element of dynamic control exists that should also be considered.
Fig. 3.

Concave-up Scatchard plots can be simulated by a dimerization model for EGF–EGFR interactions in intact cells when EGFR dimers are allowed to bind to an external site. The dimerization/external site models depicted in Fig. 1 were solved mathematically as shown in Eq. 14 (see Model Incorporating Extended State, Dimerization, and an External Binding Site) by numerical approximation (bisection method) by using visual basic in an excel spreadsheet with [RT] = 1 μM, [CT] = 0.05 μM, Kc = 1 × 10–15, Ke = 30, Kl = 600 nM, K = 20 nM, Kd = 1 μM, and increasing values for [L]. (A) Eq. 11 was then used to generate simulated curves shown in the Scatchard plot. (B) The degree of dimerization for each of the EGF–EGFR species was determined by using Eq. 12 as a function of increasing ligand concentrations. (C) Lowering the affinity of the dimer for the external site does not alter the plots. Again, Eq. 14 was solved mathematically as described above except that Kc was lowered to 1 × 10–11. The other variables remain fixed at [RT] = 1 μM, [CT] = 0.05 μM, Ke = 30, Kl = 600 nM, K = 20 nM, Kd = 1 μM, and increasing values for [L]. Eq. 11 was used to generate simulated curves shown in the Scatchard plot. (D) The degree of dimerization for each of the EGF–EGFR species was determined by using Eq. 12 as a function of increasing ligand concentrations.
Fig. 4.

Increasing the dimerization affinity only slightly increases the apparent low affinity and significantly decreases the concave-up feature of the Scatchard plot. The dimerization/external site models depicted in Fig. 1 were solved mathematically as shown in Eq. 14 by numerical approximation (bisection method) by using visual basic in an excel spreadsheet as described with [RT] = 1 μM, [CT] = 0.05 μM, Kc = 1 × 10–15, Ke = 30, Kl = 600 nM, K = 20 nM, but decreasing Kd to 0.1 μM. As described, the equation was solved for increasing values for [L]. (A) Eq. 11 was used to generate simulated curves shown in the Scatchard plot. (B) The degree of dimerization for each of the EGF–EGFR species was determined by using Eq. 12 as a function of increasing ligand concentrations. (C) Lowering the affinity of the dimer for the external site does not alter the plots. Again, Eq. 14 was solved mathematically as described, except that Kc was lowered to 1 × 10–11. The other variables remain fixed at [RT] = 1 μM, [CT] = 0.05 μM, Ke = 30, Kl = 600 nM, K = 20 nM, Kd = 0.1 μM, and increasing values for [L]. Eq. 11 was used to generate simulated curves shown in the Scatchard plot. (D) The degree of dimerization for each of the EGF-EGFR species was determined by using Eq. 12 as a function of increasing ligand concentrations.
Fig. 5.

Changes in receptor concentration or the affinity of the receptor dimer for the external sites influences the sensitivity of receptor dimerization to ligand concentration. (A) A 10-fold reduction in receptor concentration results in fully dimerized EGFR even in the absence of ligand. The dimerization/external site models depicted in Fig. 1 were solved mathematically as shown in Eq. 14 by numerical approximation (bisection method) by using visual basic in an excel spreadsheet as described above, except that [RT] was decreased 10-fold to 0.1 μM. The other variables remain fixed at [CT] = 0.05 μM, Kc = 1 × 10–15, Ke = 30, Kl = 600 nM, K = 20 nM, Kd = 1 μM, and increasing values for [L]. Eq. 11 was used to generate simulated curves shown in the Scatchard plot. (B) The degree of dimerization for each of the EGF–EGFR species was determined by using Eq. 12 as a function of increasing ligand concentrations. (C) Lowering the affinity of the dimer for the external site restores the sensitivity of dimerization to ligand concentration. Again, Eq. 14 was solved mathematically as described, except that and Kc was lowered to 1 × 10–11. The other variables remain fixed at [RT] = 0.1 μM, [CT] = 0.05 μM, Ke = 30, Kl = 600 nM, K = 20 nM, Kd = 1 μM, and increasing values for [L]. Eq. 11 was used to generate simulated curves shown in the Scatchard plot. (D) The degree of dimerization for each of the EGF–EGFR species was determined by using Eq. 12 as a function of increasing ligand concentrations.
Conclusions
The mathematical models presented in this report for describing the EGF-binding characteristics of EGFR and for EGF stimulation of EGFR dimerization are based on a variety of biochemical experiments and the 3D structures of the ErbB receptor extracellular regions that have been described (6–8, 10). The mathematical model and the biochemical experiments presented in the accompanying article (15) provide a consistent view of how EGFR and other members of the family are maintained in an autoinhibited configuration and how ligand binding stimulates receptor dimerization and activation. Our biochemical experiments (15) demonstrate that the autoinhibition conferred by intramolecular domain II–IV interactions is subtle and that additional mechanisms must exist for maintaining EGFR and other RTKs in an autoinhibited state before ligand stimulation. In addition to providing a quantitative framework for describing EGF–EGFR interactions, the mathematical model presented in this report shows that the high-affinity and low-affinity states of EGFRs that have been deduced from Scatchard analysis of EGF binding to intact EGFR-expressing cells do not directly correspond to the extended and tethered configurations of EGFR that were revealed by crystallographic studies. Although it is clear that the extended configuration of the EGFR binds EGF with higher affinity than does the tethered configuration, we show that additional factors must be introduced into the mathematical model to account for the curvilinear Scatchard plots seen for EGF binding to EGFR expressed on the cell surface of living cells. Identifying the molecular nature of these additional factors presents an important challenge in studies of EGFR signaling.
Supplementary Material
Acknowledgments
This work was supported in part by a James Hudson Brown–Alexander B. Coxe Postdoctoral Fellowship (to D.M.) and by National Cancer Institute Grant R01-CA79992 (to M.A.L).
Abbreviations: EGF, epidermal growth factor; EGFR, EGF receptor; sEGFR, soluble EGFR.
References
- 1.Jorissen, R. N., Walker, F., Pouliot, N., Garrett, T. P., Ward, C. W. & Burgess, A. W. (2003) Exp. Cell Res. 284, 31–53. [DOI] [PubMed] [Google Scholar]
- 2.Blume-Jensen, P. & Hunter, T. (2001) Nature 411, 355–365. [DOI] [PubMed] [Google Scholar]
- 3.Schlessinger, J. (1986) J. Cell Biol. 103, 2067–2072. [DOI] [PMC free article] [PubMed] [Google Scholar]
- 4.Schlessinger, J. (1988) Biochemistry 27, 3119–3123. [DOI] [PubMed] [Google Scholar]
- 5.Lax, I., Bellot, F., Howk, R., Ullrich, A., Givol, D. & Schlessinger, J. (1989) EMBO J. 8, 421–427. [DOI] [PMC free article] [PubMed] [Google Scholar]
- 6.Ogiso, H., Ishitani, R., Nureki, O., Fukai, S., Yamanaka, M., Kim, J. H., Saito, K., Sakamoto, A., Inoue, M., Shirouzu, M. & Yokoyama, S. (2002) Cell 110, 775–787. [DOI] [PubMed] [Google Scholar]
- 7.Cho, H. S. & Leahy, D. J. (2002) Science 297, 1330–1333. [DOI] [PubMed] [Google Scholar]
- 8.Ferguson, K. M., Berger, M. B., Mendrola, J. M., Cho, H. S., Leahy, D. J. & Lemmon, M. A. (2003) Mol. Cell 11, 507–517. [DOI] [PubMed] [Google Scholar]
- 9.Burgess, A. W., Cho, H. S., Eigenbrot, C., Ferguson, K. M., Garrett, T. P., Leahy, D. J., Lemmon, M. A., Sliwkowski, M. X., Ward, C. W. & Yokoyama, S. (2003) Mol. Cell 12, 541–552. [DOI] [PubMed] [Google Scholar]
- 10.Garrett, T. P., McKern, N. M., Lou, M., Elleman, T. C., Adams, T. E., Lovrecz, G. O., Zhu, H. J., Walker, F., Frenkel, M. J., Hoyne, P. A., et al. (2002) Cell 110, 763–773. [DOI] [PubMed] [Google Scholar]
- 11.Schlessinger, J. (2002) Cell 110, 669–672. [DOI] [PubMed] [Google Scholar]
- 12.Lemmon, M. A., Bu, Z., Ladbury, J. E., Zhou, M., Pinchasi, D., Lax, I., Engelman, D. M. & Schlessinger, J. (1997) EMBO J. 16, 281–294. [DOI] [PMC free article] [PubMed] [Google Scholar]
- 13.Wofsy, C. & Goldstein, B. (1992) Math. Biosci. 112, 115–154. [DOI] [PubMed] [Google Scholar]
- 14.Holbrook, M. R., Slakey, L. L. & Gross, D. J. (2000) Biochem. J. 352, 99–108. [PMC free article] [PubMed] [Google Scholar]
- 15.Mattoon, D., Klein, P., Lemmon, M. A., Lax, I. & Schlessinger, J. (2004) Proc. Natl. Acad. Sci. USA 101, 923–928. [DOI] [PMC free article] [PubMed] [Google Scholar]
- 16.Kohda, D., Odaka, M., Lax, I., Kawasaki, H., Suzuki, K., Ullrich, A., Schlessinger, J. & Inagaki, F. (1993) J. Biol. Chem. 268, 1976–1981. [PubMed] [Google Scholar]
- 17.Elleman, T. C., Domagala, T., McKern, N. M., Nerrie, M., Lonnqvist, B., Adams, T. E., Lewis, J., Lovrecz, G. O., Hoyne, P. A., Richards, K. M., et al. (2001) Biochemistry 40, 8930–8939. [DOI] [PubMed] [Google Scholar]
- 18.Livneh, E., Prywes, R., Kashles, O., Reiss, N., Sasson, I., Mory, Y., Ullrich, A. & Schlessinger, J. (1986) J. Biol. Chem. 261, 12490–12497. [PubMed] [Google Scholar]
- 19.Kashles, O., Yarden, Y., Fischer, R., Ullrich, A. & Schlessinger, J. (1991) Mol. Cell. Biol. 11, 1454–1463. [DOI] [PMC free article] [PubMed] [Google Scholar]
- 20.Van der Heyden, M. A., Nievers, M., Verkleij, A. J., Boonstra, J. & Van Bergen en Henegouwen, P. M. (1997) FEBS Lett. 410, 265–268. [DOI] [PubMed] [Google Scholar]
- 21.Chandrasekhar, S. (1943) Rev. Mod. Phys. 15, 1–89. [Google Scholar]
Associated Data
This section collects any data citations, data availability statements, or supplementary materials included in this article.