Abstract
Background/Aims
The prevalence of diagnosed gastroparesis is 24.2/100,000 inhabitants, but a large group of people with gastroparesis-like symptoms have never had a gastric emptying (GE) test. Some of them may have undiagnosed gastroparesis. Our aim was to estimate the prevalence of hidden gastroparesis in the community.
Methods
The study was conducted in 2 parts: (1) Patients referred for a scintigraphic GE test completed a validated questionnaire (Bowel Disease Questionnaire). Multiple linear regression models to predict 2 hours and 4 hours GE rates were developed. (2) A revised Bowel Disease Questionnaire was mailed to a random sample of 4,194 Olmsted County residents. GE rates were estimated with the models for each subject and delayed GE was considered when they were lower than normal values. Hidden gastroparesis was defined in community subjects with predicted delayed GE that had not been diagnosed with gastroparesis prior to the survey.
Results
The regression models for GE rates were constructed using data from 450 patients. In addition to age and gender, the symptoms found significant were nausea/vomiting, early satiety, upper abdominal pain, bloating, loss of appetite and weight loss more than 7 pounds. 2,298 (55%) community subjects returned a questionnaire. Five subjects were excluded due to a prior diagnosis of gastroparesis. When models were applied to the community survey data, 42 (1.8%) subjects were estimated to have delayed GE.
Conclusions
Delayed GE was estimated to occur in 1.8% of community subjects. Since the prevalence of diagnosed gastroparesis is low (0.02%), many subjects with gastroparesis may remain undiagnosed.
Keywords: Epidemiology, Gastric emptying, Gastroparesis, Prevalence
Introduction
Gastroparesis is a chronic symptomatic gastric disorder characterized by delayed gastric emptying (GE) in the absence of mechanical obstruction.1 Any condition affecting neuromuscular dysfunction of the gastrointestinal (GI) tract can cause gastroparesis, although most frequently the condition is idiopathic or secondary to diabetes mellitus2; other potential etiologies noted among 146 cases3 included post-surgery (13%), Parkinson's disease (7.5%), collagen vascular disorders (4.8%), intestinal pseudoobstruction (4.1%) and rare other causes (6%).
Symptoms of gastroparesis are variable but typically are thought to include nausea, vomiting, early satiety, postprandial bloating/fullness or upper abdominal discomfort.1,2 Nausea was reported by more than 90% of patients with gastroparesis, vomiting by 68%-84% and bloating by 75%, in 2 case series.3,4 Severe cases may also suffer from dehydration, electrolyte disturbances, weight loss and malnutrition; other complications include esophagitis, Mallory-Weiss syndrome and bezoars.1 Gastroparesis symptoms reduce quality of life, and there is a correlation between severity of symptoms and impairment of quality of life.5,6 Delayed GE is traditionally considered as the major pathophysiological mechanism underlying symptoms in patients with gastroparesis,7 although abnormal fundic accommodation may be also important.8
The correlation between symptoms and delayed GE is controversial. Some studies detected an association between delayed GE and female gender, postprandial fullness, nausea and vomiting in patients with dyspepsia,9-15 while others did not.16-19 Similarly, GE rates in diabetic patients were predicted by abdominal bloating/fullness and female gender in one study20 and associated with postprandial fullness and abdominal pain in another.21 Therefore, we hypothesized that a model to predict GE rate can be constructed based on symptoms and demographic variables.
The prevalence of gastroparesis is unknown due to the difficulties inherent of undertaking true population based studies, since we lack an easy-to-use, generally available GE test than can be applied widely. Although gastroparesis is recognized to cause increased hospitalizations and carries high associated costs in the USA,22 little incidence and prevalence data on gastroparesis are available. Recently, using the unique resources of the Rochester Epidemiology Project, the epidemiology of gastroparesis in the community was studied; we found that definite gastroparesis (defined as typical symptoms plus confirmed delayed GE by scintigraphy) had a prevalence of 24.2 per 100,000 inhabitants, and an incidence 6.3 per 100,000 persons per year.23 It is known, however, that gastroparesis-like symptoms are much more common in the community than the observed documented incidence and prevalence rates. A population-based survey in Olmsted County observed a prevalence of upper abdominal pain of 7.8%, while 7% had early satiety.24 In a North American population sample, 7% complained of nausea/vomiting in the previous three months,25 while chronic nausea was reported by 4% and chronic vomiting by 2%.26 Among subjects with diabetes mellitus, 11%-18% reported symptoms consistent with upper GI dysmotility.27-29 Gastroparesis-like symptoms are thus highly prevalent in the community but how many of these people have gastroparesis is uncertain.
We know that there is a large group of people with gastroparesis-like symptoms who have never had a GE test and are unlikely to submit to such testing. Many of these subjects may have unrecognized (or hidden) gastroparesis, mirroring the iceberg effect seen in gastroesophageal reflux disease (GERD),30 irritable bowel syndrome31 and celiac disease.32 We hypothesized that gastroparesis is more common in the community than has been suspected; therefore, the aim of this study was to estimate the likely prevalence of hidden gastroparesis in a representative U.S. community.
Materials and Methods
This study consisted of 2 parts: first, a model to predict GE rate was developed, and second, we applied this model to community subjects in order to estimate the prevalence of likely hidden gastroparesis. This study was approved by the institutional review boards of the Mayo Foundation and the Olmsted Medical Center.
Part 1. Development of a Model to Predict Gastric Emptying Rate
Unselected patients (not necessarily county residents) referred for a GE scintigraphic test in 1996 were considered for inclusion in Part 1. Medical charts were reviewed to exclude those patients with mechanical gastric outlet obstruction. They completed a version of the validated Talley Bowel Disease Questionnaire (BDQ), which includes information regarding upper and lower GI symptoms; its reliability and validity have been previously shown.33,34
GE of solids was measured using a gastric scintigraphic method that has been validated and reported previously.35 Briefly, the study began with patients under fasting conditions for a minimum of 6 hours. A radiolabeled meal was prepared by adding 0.75 mCi 99mTc-sulfur colloid to 2 raw eggs prior to cooking. A meal containing these eggs on 1 slice of buttered bread was served along with a 240 mL glass of 1% milk (total calories: 296 kcal, 32% protein, 35% fat and 33% carbohydrate). Anterior and posterior gamma camera images were obtained immediately after meal ingestion and then at 1, 2 and 4 hours. The geometric mean of delay-corrected counts in anterior and posterior images of the stomach was used to estimate the proportion of 99mTc emptied at each time point.
Two multiple linear regression models to predict GE rates (defined as the percentage of 99mTc having left the the stomach) at 2 hours and separately at 4 hours were developed. The following self-reported symptoms, along with age and gender, were considered for inclusion in the models as potential predictors:
Nausea - recorded on the questionnaire as: None, Less than once a month, About once a month, About once a week, Several times a week, or Daily and coded as ≥ weekly (Yes/No) for the model development.
Vomiting - recorded using the same categories and coded the same way in the model.
Early satiety - elicited as self-reported inability to finish a regular meal recorded as: Never, Sometimes (< 25% of the time), Often (> 25% of the time) or Usually (> 75% of the time) and coded as often or usually (Yes/No).
Bloating - elicited as perception of abdominal distention or actually seeing the abdomen distended categorized and coded the same way as early satiety.
Upper abdominal pain - elicited as pain in the abdomen above the umbilicus, without lower abdominal pain (below the umbilicus), recorded as: Less than once a month, About once a month, About once a week, Several times a week, or Daily. This was coded as ≥ about once a month.
Unwanted weight loss - elicited as: No, < 7 lb, or ≥ 7 lb and was coded as an undesired loss of 7 lb or more (Yes/No).
Self reported loss of appetite in the last year (Yes/No).
Abdominal pain made worse with food - recorded as: Never, Sometimes (< 25% of the time), Often (> 25% of the time), or Usually (> 75% of the time) and coded as often or usually (Yes/No).
In addition, age and gender were included as covariates in the model. Since virtually all of the subjects undergoing a scintigraphic GE test reported one or more specific upper GI symptoms, the classification of delayed vs non-delayed GE was based on the observed GE rates at 2 and 4 hours, and then models using primarily symptoms were developed to predict these observed rates.
Part 2. Application of the Model to Community Subjects
In 2003 and 2004, a Talley BDQ was mailed to a cohort of community subjects that had been randomly chosen and mailed various GI disease questionnaires 10 to 15 years earlier (n = 9,327). Subjects who had died (n = 1,685), moved from Olmsted County (n = 1,056), denied authorization to use their medical records for research (as required by Minnesota law) (n = 331), > 80 years old (n = 691), and subjects who had responded to (n = 659) or explicitly refused (n = 45) an earlier (2001) follow-up questionnaire, or identified post mailing as ineligible (n = 551) were excluded from the cohort for the 2003-2004 mailing. A modified Talley BDQ was mailed to eligible community subjects. Reminder letters were mailed at 2, 4 and 7 weeks. Subjects who indicated at any point that they did not wish to complete the survey were not contacted further. Nonresponders were contacted by telephone at 10 weeks to request their participation and verify their residence within the county. Subjects who completed the survey were offered $5 remuneration. The questions used to define the symptoms used in model development were included in the modification of the Talley BDQ and were identical to the Talley BDQ version mailed in the population follow-up survey.
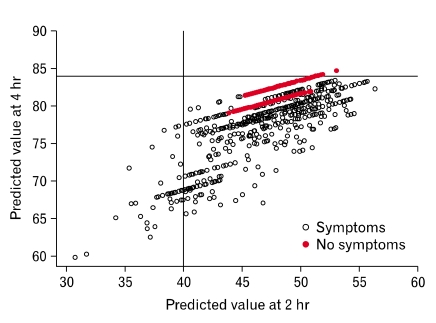
For each community subject, the GE rates at 2 and 4 hours were estimated applying the model previously developed. The estimated GE rates in community subjects were used to classify these subjects as "delayed" (vs non-delayed) GE using accepted clinical cut-off values. The classification of delayed vs non-delayed GE in community subjects was defined as estimated GE rates at 2 hours slower than 40% or at 4 hours slower than 84%.36 Thus, hidden gastroparesis was defined in community subjects as those subjects with predicted values of GE at 2 or 4 hours based the model).
Statistical Methods
The accuracy for predicting delayed GE was summarized for the sample of patients from Part 1 of the study by calculating predicted values for the GE rate at 2 and 4 hours for each subject included in the development dataset (scintigraphic GE test patients, all but one of these subjects reporting one or more upper GI symptoms). These predicted GE emptying rates were then used to generate an receiver operating characteristic (ROC) curve by incorporating them in a binary logistic regression model in which the response (binary dependent variable) was "delayed vs non-delayed GE" defined using the actual 2 and 4 hour GE rates and the clinical cut-off values of 0.4 and 0.84, respectively.
The results from the linear regression models (to predict GE at 2 and separately 4 hours) were used to estimate the proportion of people from the community survey who would be expected to have delayed gastric emptying.
The association of GE status (delayed vs non-delayed) with specific symptoms was assessed using contingency table analyses (Chi-square test statistics or Fisher's exact test as warranted) in the GE test patients and separately in the community questionnaire respondents. The alpha level for statistical significance was a (two-sided) alpha level of 0.05.
Results
Part 1. Development of a Model to Predict Gastric Emptying Rate
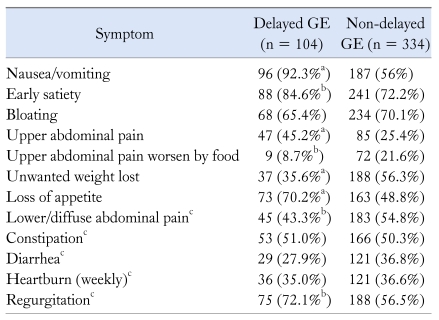
Data from 450 patients were analyzed. Three hundred and thirty (73%) were females and their mean age was 46 ± 17 (range 10-85). Four hundred and 49 patients (99.8%) suffered upper GI symptoms, and most had several symptoms: 9 (2.0%) had 1 symptom, 27 (6.0%) had 2 symptoms, 41 (9.1%) had 3 symptoms, 55 (12.2%) had 4 symptoms, 52 (11.6%) had 5 symptoms, 70 (15.6%) had 6 symptoms, 67 (14.9%) had 7 symptoms, 77 (17.1%) had 8 symptoms, 28 (6.2%) had 9 symptoms, 21 (4.7%) had 10 symptoms and 2 (0.4%) had 11 symptoms. Table 1 shows the frequency of each upper GI symptom in the clinical group referred for a GE test.
Table 1.
Symptoms Reported by the 450 Subjects Included for the Construction of Gastric Emptying Model, Classified as Delayed and Non-delayed Gastric Emptying
aP < 0.001(Fisher's exact test) for association of GE status and symptom, bP < 0.05 (Fisher's exact test) for association of GE status and symptom, cThese variables were not included in the multiple linear regression prediction model.
GE, gastric emptying.
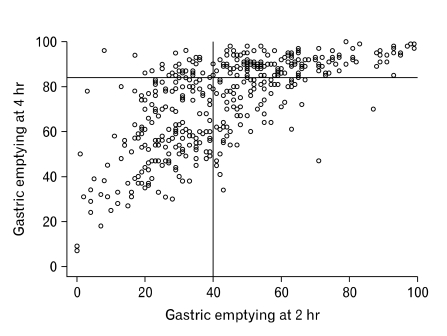
Median (range) GE rate at 2 hours was 42% (28%-56%) and 80% at 4 hours (58%-90%). Figure 1 shows the distribution of GE rate at 2 hours (X-axis) vs 4 hours (Y-axis). Overall, 104 patients showed GE below the clinical cut off values at both 2 and 4 hours.
Figure 1.
Distribution of gastric emptying rate at 2 and 4 hours in the 450 patients evaluated.
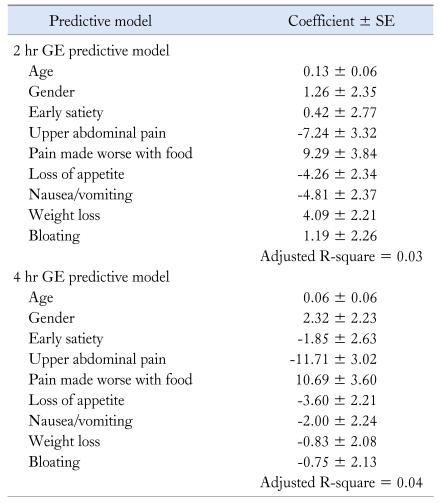
The regression models for the 2 and 4 hour GE rates were constructed using data from these patients. In addition to age and gender, the symptoms used in the prediction models (upper portion of Table 1) for the 2 and 4 hour GE rate included early satiety, upper abdominal pain, pain made worse with food and loss of appetite. Table 2 shows the results of these models. Of note, a negative coefficient means a lower gastric emptying rate and thus more likely gastroparesis.
Table 2.
Multivariable Models for Predicting Gastric Emptying Rate at 2 and 4 Hours
Note that negative coefficients predict slower GE rate.
GE, gastric emptying.
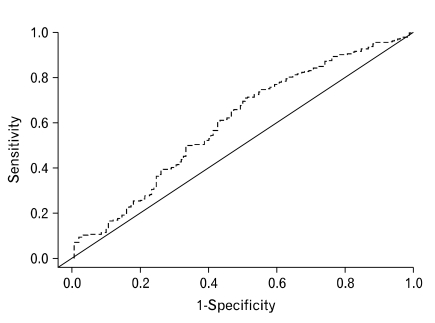
Figure 2 shows the ROC curve obtained from the logistic regression model using predicted 2 and 4 hour GE rates. Using the clinical lab cut-off points, a sensitivity of 25% and a specificity of 77% was obtained. The ROC curve is better than expected by chance. The curve is the best approximation of gastric emptying values from the models that were developed.
Figure 2.
Receiver operating characteristic curve using the predicted 2 and 4 hour gastric emptying rates for identifying delayed gastric emptying.
Part 2. Application of the Model to Community Subjects
Surveys were mailed to 4,194 community subjects and 2,298 returned the questionnaire; therefore, the response rate was 54.8%. Six subjects were excluded due to a prior diagnosis of definitive or probable gastroparesis by chart review and 73 subjects were not included in the analysis for delayed GE because of missing data.
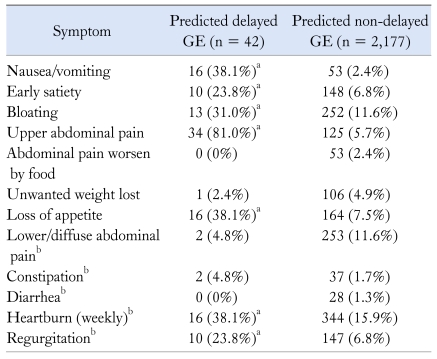
When these models were applied to the remaining 2,219 community subjects (Fig. 3), 42 (1.8%) were estimated to have delayed GE based on applying the clinical cut-offs to the 2 and 4 hour predicted rates. To be classified as delayed GE, a person in the community had to be estimated to have either a 2 or 4 hour delayed in GE. Among the subjects with predicted delayed GE, 33 (79%) were women, and their mean (± SD) age was 52.8 ± 11.3 years. In comparison, among the 2,177 community subjects classified as non-delayed GE, 1,126 (51.7%) were women, with a mean (± SD) age of 62.4 ± 12.2. Symptoms reported by these subjects are summarized in Table 3.
Figure 3.
Distribution of predicted gastric emptying at 2 and 4 hours in community subjects.
Table 3.
Symptoms Reported by Community Subjects With Predicted Delayed Gastric Emptying and Those With Predicted Non-delayed Gastric Emptying
aP < 0.001 (Fisher's exact test) for the association of GE status and symptoms, bThese variables were not included in the predictive model.
GE, gastric emptying.
All 42 subjects with predicted delayed GE were symptomatic: 12 (28.6%) had 1 symptom, 8 (19.1%) had 2 symptoms, 8 (19.1%) had 3 symptoms, 5 (11.9%) had 4 symptoms, 7 (16.7%) had 5 symptoms, 1 (2.4%) had 6 symptoms and 1 (2.4%) had 7 symptoms. Mild nausea or vomiting (less than weekly) was reported by 20 of 42 (47.6%) subjects with predicted delayed GE, compared to 660 of 2,177 (30.3%) subjects with predicted non-delayed GE (P < 0.001). Forty of 42 (95.2%) subjects with predicted delayed GE met criteria for dyspepsia, while 301 of 2,177 (13.8%) subjects without predicted delayed GE met dyspepsia criteria.
Predicted delayed GE was significantly associated with physician visits in the last 10 years for upper GI symptoms (overall 24% of subjects with delayed GE vs 10% of subjects with non-delayed GE; P = 0.008), although no association was detected in subjects with dyspepsia (25% vs 17%; P = 0.280). There was also a significant association between predicted delayed GE and having an EGD in the last 10 years (29% of subjects with predicted delayed GE vs 16% of subjects with non-delayed; P = 0.030), although no association was found in subjects with dyspepsia (30% vs 29%; P = 0.850).
Discussion
The prevalence of definitive gastroparesis in the community has been reported to be 24.2 per 100,000 and only increased to 50.5 per 100,000 if probable and possible cases were included.23 We observed in this study that hidden gastroparesis may occur in 1.8% of community subjects; therefore, the proportion of subjects with diagnosed gastroparesis may reflect only the tip of the iceberg in the community.
One study reported that gastroparesis-related hospitalizations have increased in recent years22; this observation could be due to a growing incidence, but we previously found no significant change in the incidence of gastroparesis in recent decades,23 suggesting that the increase in hospitalizations may be more related to changes in management and codification issues. Our estimation of the prevalence of hidden gastroparesis strengthens this explanation but emphasizes that this may already be a huge problem; what it is likely to change in the future is the number of cases diagnosed with gastroparesis.
It may be argued that the 1.8% of subjects identified as likely having gastroparesis may just reflect the proportion of "healthy" subjects that would lie below the normal cut-off of a test. However, our model would have not identified asymptomatic subjects because it relies on symptoms and a priori; it would have been possible that no subject in the community reported enough symptoms. Notably, the prevalence of symptomatic subjects with delayed GE (1.8%) estimated by our model is close to the 3% prevalence that could be inferred from the only small US study that has actually applied the physiologic test in a community sample.37
This iceberg effect has been previously recognized in several diseases, but in the case of gastroparesis, this seems to be impressive; around 2% of the population is predicted to have a delayed GE. The reason for the hidden part of the iceberg in other diseases like gastroesophageal reflux disease and celiac disease is mainly the lack of consultation for mild symptoms or no symptoms.30,38 In the case of hidden gastroparesis, consultation rates were similar to community subjects with dyspepsia not predicted to have delayed GE. In addition, those with a pattern suggestive of gastroparesis were not more likely to have an esophagogastroduodenoscopy done. Our data suggests that the diagnostic approach when subjects with gastroparesis like features consult is not different from other subjects with dyspepsia, but it does not usually include a GE test.
Subjects predicted to have delayed GE were predominantly women and all of them were symptomatic. However, the symptom profile is somewhat different to what is described in series of patients diagnosed with gastroparesis.3,4 Subjects with predicted delayed GE are more likely to report upper abdominal pain and less frequently, nausea and vomiting. Upper abdominal pain has been previously reported to occur in 46% of gastroparesis patients,3 although higher rates have also been observed.4 Thus, the reporting of upper abdominal pain by 81% of subjects with predicted GE in the community is not totally unexpected. More than 90% of patients with gastroparesis in the first part of our study reported nausea and vomiting similar to other case series.3,4 However, only 38% of subjects with hidden gastroparesis reported nausea and vomiting on a weekly basis, although mild nausea and vomiting was reported by an additional 48%. The most likely explanation is that these subjects are less likely to consult because of milder symptoms.
It may be argued that frequency of symptoms is just the mathematical expression of the model. It is true that the model is based on symptoms, and asymptomatic subjects would not have been predicted to have slow 2- and 4-hour GE rates. However, the application of the model identified those subjects in the community with certain combinations of symptoms yielding slow 2- and 4-hour predicted GE rates; a priori, it was unknown which symptom combinations will occur in the community and how many subjects would report each particular combination. Thus, the frequencies of symptoms in community subjects with predicted delayed GE could not be known a priori with just the mathematical model.
The clinical differences between functional dyspepsia and gastroparesis are not well defined; symptoms of gastroparesis overlap with those of functional dyspepsia.1 Delayed GE has been reported in 23%-33% of patients with functional dyspepsia,10,12,14,16,39,40 although the clinical significance is uncertain. However, it cannot be assumed that a third of community subjects with dyspepsia would have a delayed GE. Our data suggest that 12% of community subjects with dyspepsia would be predicted to have delayed GE; this is in accordance with the reported prevalence of 17% in a study, which actually measured GE in a small sample of community subjects with dyspepsia.37
Several studies have previously looked for an association between GE and symptoms, mostly in samples of patients diagnosed with functional dyspepsia; some of them did not find any association,9-15 while others did detect a link.16-19 However, associations found in these latter studies were not strong and were somewhat discrepant in terms of what symptoms are associated with delayed GE. Thus, it is not surprising that the associations found with our model were not strong; just 3%-4% of the variability in GE rate was explained by the model. The model is therefore not clinically suitable for the identification of people with delayed GE and it is not a substitute for a GE test. However, it may serve to provide a good estimation of GE in a scenario where application of scintigraphic testing is not amenable.
Our study has several strengths. First, the clinical sample used for generating the model is large, and, in fact, is among the largest series testing for associations between symptoms and GE.10,11,16,19 Also, unlike previously reported series, patients were selected based on medical referral for a GE test, and all consecutive patients were included; this implies that symptoms reported by our patients are not restrained by any specific symptom or combinations of symptoms, but just on what physicians considered clinically suspicious for delayed GE. Also, our model was developed to predict the GE rate rather than directly identify subjects with predicted delayed GE, which requires a different approach. Information was collected though a well validated questionnaire and questions regarding symptoms were the same in both the clinical and the community samples. Finally, the community sample was selected at random from the population, and it is well characterized through the resources of the Rochester Epidemiology Project; specifically a previous diagnosis of probable or definitive gastroparesis and mechanical gastric obstruction can be ruled out, helping assure that the "hidden" tag for these community subjects is correct.
Notably, there are some limitations. First, the optimal way to know exactly the prevalence of hidden gastroparesis would require the direct measurement of GE in a large community sample; however, it is not feasible to do a GE test in a large community sample due to low recruitment rates. Alternative methods to objectively measure the GE rate also require subjects to attend specialized centers (ultrasonography and MRI) or are time consuming for them (breath test). Second, the ideal sample to develop the model would have been a random sample from the community. However, a large sample would still be required, and probably would never be recruited; therefore, the best alternative was a symptomatic model for predicting GE as a first step. The use of a sample based upon referral for a GE test may lead to an overestimation of delayed GE; for that reason, we chose a conservative approach requiring both 2- and 4-hour emptying rates below the cut-offs to consider that a subject have a predicted delayed GE; in fact, the predictive model showed a poor sensitivity but in exchange we gained reasonable specificity, making us confident that few of the subjects predicted to have delayed GE would be false positive. Although the sample used for generating the model differs from community samples in terms of age (younger) and gender distribution (predominance of females), these differences are unlikely to have a major impact in the results, since the model predicts slower GE for younger subjects and females. Finally, as mentioned above, the model for GE is not as accurate as we would like, but this is not surprising in view of the discrepancies reported in the literature.9-19
Our data should be interpreted as estimation and not as true prevalence data. We have shown however that known gastroparesis is likely just the tip of a large hidden iceberg, which includes both subjects that do not consult and those in whom delayed GE is not clinically identified.
Footnotes
Dr. Enrique Rey was supported by a grant BA08/90038 from the Carlos III Institute, Ministry of Health, Spain. This study was funded in part by an unrestricted grant from Medtronics and made possible by the Rochester Epidemiology Project (Grant R01 AG034676 from the National Institute on Aging).
Conflicts of interest: None.
References
- 1.Parkman HP, Hasler WL, Fisher RS American Gastroenterological Association. American Gastroenterological Association technical review on the diagnosis and treatment of gastroparesis. Gastroenterology. 2004;127:1592–1622. doi: 10.1053/j.gastro.2004.09.055. [DOI] [PubMed] [Google Scholar]
- 2.Hasler WL. Gastroparesis: symptoms, evaluation, and treatment. Gastroenterol Clin North Am. 2007;36:619–647. ix. doi: 10.1016/j.gtc.2007.07.004. [DOI] [PubMed] [Google Scholar]
- 3.Soykan I, Sivri B, Sarosiek I, Kiernan B, McCallum RW. Demography, clinical characteristics, psychological and abuse profiles, treatment, and long-term follow-up of patients with gastroparesis. Dig Dis Sci. 1998;43:2398–2404. doi: 10.1023/a:1026665728213. [DOI] [PubMed] [Google Scholar]
- 4.Hoogerwerf WA, Pasricha PJ, Kalloo AN, Schuster MM. Pain: the overlooked symptom in gastroparesis. Am J Gastroenterol. 1999;94:1029–1033. doi: 10.1111/j.1572-0241.1999.01008.x. [DOI] [PubMed] [Google Scholar]
- 5.Revicki DA, Rentz AM, Dubois D, et al. Development and validation of a patient-assessed gastroparesis symptom severity measure: the Gastroparesis Cardinal Symptom Index. Aliment Pharmacol Ther. 2003;18:141–150. doi: 10.1046/j.1365-2036.2003.01612.x. [DOI] [PubMed] [Google Scholar]
- 6.Harrell SP, Studts JL, Dryden GW, Eversmann J, Cai L, Wo JM. A novel classification scheme for gastroparesis based on predominant-symptom presentation. J Clin Gastroenterol. 2008;42:455–459. doi: 10.1097/MCG.0b013e31815ed084. [DOI] [PubMed] [Google Scholar]
- 7.Abell TL, Bernstein VK, Cutts T, et al. Treatment of gastroparesis: a multidisciplinary clinical review. Neurogastroenterol Motil. 2006;18:263–283. doi: 10.1111/j.1365-2982.2006.00760.x. [DOI] [PubMed] [Google Scholar]
- 8.Karamanolis G, Caenepeel P, Arts J, Tack J. Determinants of symptom pattern in idiopathic severely delayed gastric emptying: gastric emptying rate or proximal stomach dysfunction? Gut. 2007;56:29–36. doi: 10.1136/gut.2005.089508. [DOI] [PMC free article] [PubMed] [Google Scholar]
- 9.Stanghellini V, Tosetti C, Paternico A, et al. Risk indicators of delayed gastric emptying of solids in patients with functional dyspepsia. Gastroenterology. 1996;110:1036–1042. doi: 10.1053/gast.1996.v110.pm8612991. [DOI] [PubMed] [Google Scholar]
- 10.Stanghellini V, Tosetti C, Paternicò A, et al. Predominant symptoms identify different subgroups in functional dyspepsia. Am J Gastroenterol. 1999;94:2080–2085. doi: 10.1111/j.1572-0241.1999.01281.x. [DOI] [PubMed] [Google Scholar]
- 11.Karamanolis G, Caenepeel P, Arts J, Tack J. Association of the predominant symptom with clinical characteristics and pathophysiological mechanisms in functional dyspepsia. Gastroenterology. 2006;130:296–303. doi: 10.1053/j.gastro.2005.10.019. [DOI] [PubMed] [Google Scholar]
- 12.Sarnelli G, Caenepeel P, Geypens B, Janssens J, Tack J. Symptoms associated with impaired gastric emptying of solids and liquids in functional dyspepsia. Am J Gastroenterol. 2003;98:783–788. doi: 10.1111/j.1572-0241.2003.07389.x. [DOI] [PubMed] [Google Scholar]
- 13.Stanghellini V, Tosetti C, Barbara G, et al. Dyspeptic symptoms and gastric emptying in the irritable bowel syndrome. Am J Gastroenterol. 2002;97:2738–2743. doi: 10.1111/j.1572-0241.2002.07062.x. [DOI] [PubMed] [Google Scholar]
- 14.Jones MP, Maganti K. Symptoms, gastric function, and psychosocial factors in functional dyspepsia. J Clin Gastroenterol. 2004;38:866–872. doi: 10.1097/00004836-200411000-00006. [DOI] [PubMed] [Google Scholar]
- 15.Pallotta N, Pezzotti P, Calabrese E, Baccini F, Corazziari E. Relationship between gastrointestinal and extra-gastrointestinal symptoms and delayed gastric emptying in functional dyspeptic patients. World J Gastroenterol. 2005;11:4375–4381. doi: 10.3748/wjg.v11.i28.4375. [DOI] [PMC free article] [PubMed] [Google Scholar]
- 16.Talley NJ, Verlinden M, Jones M. Can symptoms discriminate among those with delayed or normal gastric emptying in dysmotility-like dyspepsia? Am J Gastroenterol. 2001;96:1422–1428. doi: 10.1111/j.1572-0241.2001.03683.x. [DOI] [PubMed] [Google Scholar]
- 17.Bredenoord AJ, Chial HJ, Camilleri M, Mullan BP, Murray JA. Gastric accommodation and emptying in evaluation of patients with upper gastrointestinal symptoms. Clin Gastroenterol Hepatol. 2003;1:264–272. [PubMed] [Google Scholar]
- 18.Van Lelyveld N, Schipper M, Samsom M. Lack of relationship between chronic upper abdominal symptoms and gastric function in functional dyspepsia. Dig Dis Sci. 2008;53:1223–1230. doi: 10.1007/s10620-007-0012-1. [DOI] [PMC free article] [PubMed] [Google Scholar]
- 19.Talley NJ, Locke GR, 3rd, Lahr BD, et al. Functional dyspepsia, delayed gastric emptying, and impaired quality of life. Gut. 2006;55:933–939. doi: 10.1136/gut.2005.078634. [DOI] [PMC free article] [PubMed] [Google Scholar]
- 20.Jones KL, Russo A, Stevens JE, Wishart JM, Berry MK, Horowitz M. Predictors of delayed gastric emptying in diabetes. Diabetes Care. 2001;24:1264–1269. doi: 10.2337/diacare.24.7.1264. [DOI] [PubMed] [Google Scholar]
- 21.Samsom M, Vermeijden JR, Smout AJ, et al. Prevalence of delayed gastric emptying in diabetic patients and relationship to dyspeptic symptoms: a prospective study in unselected diabetic patients. Diabetes Care. 2003;26:3116–3122. doi: 10.2337/diacare.26.11.3116. [DOI] [PubMed] [Google Scholar]
- 22.Wang YR, Fisher RS, Parkman HP. Gastroparesis-related hospitalizations in the United States: trends, characteristics, and outcomes, 1995-2004. Am J Gastroenterol. 2008;103:313–322. doi: 10.1111/j.1572-0241.2007.01658.x. [DOI] [PubMed] [Google Scholar]
- 23.Jung HK, Choung RS, Locke GR, 3rd, et al. The incidence, prevalence and survival of gastroparesis in Olmsted County, Minnesota 1996-2006. Gastroenterology. 2008;134(suppl 1):A534–A535. [Google Scholar]
- 24.Choung RS, Locke GR, Schleck CD, Zinsmeister AR, Talley NJ. Do distinct dyspepsia subgroups exist in the community? A population-based study. Am J Gastroenterol. 2007;102:1983–1989. doi: 10.1111/j.1572-0241.2007.01381.x. [DOI] [PubMed] [Google Scholar]
- 25.Camilleri M, Dubois D, Coulie B, et al. Prevalence and socioeconomic impact of upper gastrointestinal disorders in the United States: results of the US Upper Gastrointestinal Study. Clin Gastroenterol Hepatol. 2005;3:543–552. doi: 10.1016/s1542-3565(05)00153-9. [DOI] [PubMed] [Google Scholar]
- 26.Tougas G, Chen Y, Hwang P, Liu MM, Eggleston A. Prevalence and impact of upper gastrointestinal symptoms in the Canadian population: findings from the DIGEST study. Domestic/International Gastroenterology Surveillance Study. Am J Gastroenterol. 1999;94:2845–2854. doi: 10.1111/j.1572-0241.1999.01427.x. [DOI] [PubMed] [Google Scholar]
- 27.Ricci JA, Siddique R, Stewart WF, Sandler RS, Sloan S, Farup CE. Upper gastrointestinal symptoms in a U.S. national sample of adults with diabetes. Scand J Gastroenterol. 2000;35:152–159. doi: 10.1080/003655200750024317. [DOI] [PubMed] [Google Scholar]
- 28.Maleki D, Locke GR, 3rd, Camilleri M, et al. Gastrointestinal tract symptoms among persons with diabetes mellitus in the community. Arch Intern Med. 2000;160:2808–2816. doi: 10.1001/archinte.160.18.2808. [DOI] [PubMed] [Google Scholar]
- 29.Bytzer P, Talley NJ, Leemon M, Young LJ, Jones MP, Horowitz M. Prevalence of gastrointestinal symptoms associated with diabetes mellitus: a population-based survey of 15,000 adults. Arch Intern Med. 2001;161:1989–1996. doi: 10.1001/archinte.161.16.1989. [DOI] [PubMed] [Google Scholar]
- 30.Locke GR, 3rd, Talley NJ, Fett SL, Zinsmeister AR, Melton LJ., 3rd Prevalence and clinical spectrum of gastroesophageal reflux: a population-based study in Olmsted County, Minnesota. Gastroenterology. 1997;112:1448–1456. doi: 10.1016/s0016-5085(97)70025-8. [DOI] [PubMed] [Google Scholar]
- 31.Talley NJ, Zinsmeister AR, Melton LJ., 3rd Irritable bowel syndrome in a community: symptom subgroups, risk factors, and health care utilization. Am J Epidemiol. 1995;142:76–83. doi: 10.1093/oxfordjournals.aje.a117548. [DOI] [PubMed] [Google Scholar]
- 32.West J, Logan RF, Hill PG, Khaw KT. The iceberg of celiac disease: what is below the waterline? Clin Gastroenterol Hepatol. 2007;5:59–62. doi: 10.1016/j.cgh.2006.10.020. [DOI] [PubMed] [Google Scholar]
- 33.Talley NJ, Phillips SF, Melton J, 3rd, Wiltgen C, Zinsmeister AR. A patient questionnaire to identify bowel disease. Ann Intern Med. 1989;111:671–674. doi: 10.7326/0003-4819-111-8-671. [DOI] [PubMed] [Google Scholar]
- 34.Talley NJ, Phillips SF, Wiltgen CM, Zinsmeister AR, Melton LJ., 3rd Assessment of functional gastrointestinal disease: the bowel disease questionnaire. Mayo Clin Proc. 1990;65:1456–1479. doi: 10.1016/s0025-6196(12)62169-7. [DOI] [PubMed] [Google Scholar]
- 35.Cremonini F, Mullan BP, Camilleri M, Burton DD, Rank MR. Performance characteristics of scintigraphic transit measurements for studies of experimental therapies. Aliment Pharmacol Ther. 2002;16:1781–1790. doi: 10.1046/j.1365-2036.2002.01344.x. [DOI] [PubMed] [Google Scholar]
- 36.Camilleri M, Zinsmeister AR, Greydanus MP, Brown ML, Proano M. Towards a less costly but accurate test of gastric emptying and small bowel transit. Dig Dis Sci. 1991;36:609–615. doi: 10.1007/BF01297027. [DOI] [PubMed] [Google Scholar]
- 37.Castillo EJ, Camilleri M, Locke GR, et al. A community-based, controlled study of the epidemiology and pathophysiology of dyspepsia. Clin Gastroenterol Hepatol. 2004;2:985–996. doi: 10.1016/s1542-3565(04)00454-9. [DOI] [PubMed] [Google Scholar]
- 38.Fasano A, Berti I, Gerarduzzi T, et al. Prevalence of celiac disease in at-risk and not-at-risk groups in the United States: a large multicenter study. Arch Intern Med. 2003;163:286–292. doi: 10.1001/archinte.163.3.286. [DOI] [PubMed] [Google Scholar]
- 39.Perri F, Clemente R, Festa V, et al. Patterns of symptoms in functional dyspepsia: role of Helicobacter pylori infection and delayed gastric emptying. Am J Gastroenterol. 1998;93:2082–2088. doi: 10.1111/j.1572-0241.1998.00597.x. [DOI] [PubMed] [Google Scholar]
- 40.Maes BD, Ghoos YF, Hiele MI, Rutgeerts PJ. Gastric emptying rate of solids in patients with nonulcer dyspepsia. Dig Dis Sci. 1997;42:1158–1162. doi: 10.1023/a:1018881419010. [DOI] [PubMed] [Google Scholar]


