

Abstract
Bacterial epidemics are often caused by strains that have acquired their increased virulence through horizontal gene transfer. Due to this association with disease, the detection of horizontal gene transfer continues to receive attention from microbiologists and bioinformaticians alike. Most software for detecting transfer events is based on alignments of sets of genes or of entire genomes. But despite great advances in the design of algorithms and computer programs, genome alignment remains computationally challenging. We have therefore developed an alignment-free algorithm for rapidly detecting horizontal gene transfer between closely related bacterial genomes. Our implementation of this algorithm is called alfy for “ALignment Free local homologY” and is freely available from http://guanine.evolbio.mpg.de/alfy/. In this comment we demonstrate the application of alfy to the genomes of Staphylococcus aureus. We also argue that—contrary to popular belief and in spite of increasing computer speed—algorithmic optimization is becoming more, not less, important if genome data continues to accumulate at the present rate.
Keywords: horizontal gene transfer, alignment, alignment-free, genome comparison, bacteria
Introduction
Horizontal gene transfer is a major source of bacterial genome diversity. While microbiologists have known this for decades,1 bacterial evolution by horizontal gene transfer occasionally also hits the headlines as seen recently during the Escherichia coli outbreak in Northern Germany. The infectious strain's ability to cause hemorrhagic colitis and its antibiotic resistance were probably acquired by horizontal gene transfer (www. genomics.cn).
Horizontal Gene Transfer
Abrupt changes in evolutionary history along a given genomic region are indicative of horizontal gene transfer. Figure 1A illustrates this for the genomes of three hypothetical strains of bacteria, a, b and c. Genome segment S1 has phylogeny [(a, b), c], while segment S2 contains a region that was horizontally transferred between an ancestor of a and an ancestor of c. As a result, the phylogeny of segment S2 is [(a,c),b]. In segment S3 the phylogeny reverts back to that of S1. This fluctuating evolutionary history leads to an increase in the number of pairwise mismatches between a and b along S2, and causes a decrease in the number of mismatches between a and c (Fig. 1B).
Figure 1.
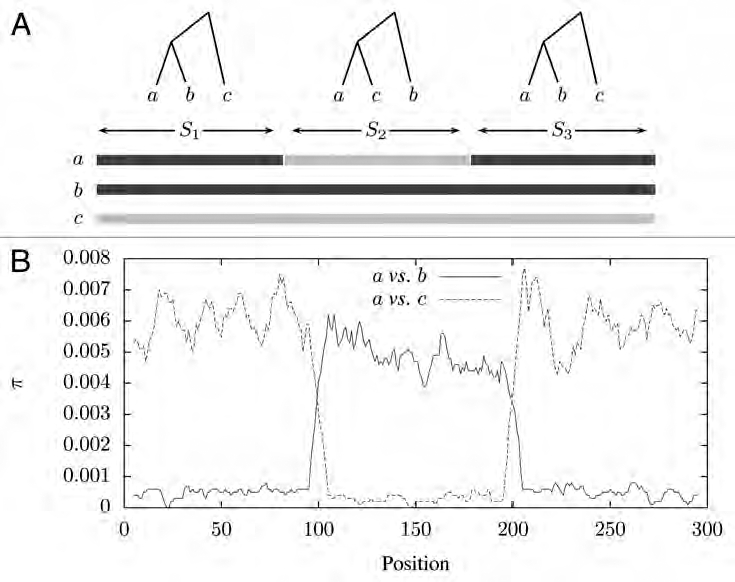
Illustration of the effect of horizontal gene transfer on the genomes of three bacterial strains. (A) The evolutionary history of the three genomes fluctuates along their length leading to distinct segments S1, S2 and S3; (B) as a result, the number of pairwise mismatches per position, π, also fluctuates.
Due to the medical importance of horizontal gene transfer among pathogenic microbes, there has been and continues to be great interest in devising automated methods for detecting these abrupt homology shifts. Some of the resulting computer programs are designed for particular organisms, such as HIV,2 while others can be applied to any set of bacterial genomes.3 However, a common feature of most methods for detecting horizontal gene transfer is that they are based on an alignment of the genomes of interest. In other words, they rely on homology information for every nucleotide contained in the data set analyzed. There have been great advances in alignment algorithms and tools over the past decade.4 But because alignment algorithms are not guaranteed to run in time proportional to the size of the data set, they still tend to be computationally expensive. Alignment-free methods may provide a more efficient alternative.
Alignment-Based vs. Alignment-Free Methods
Alignment-free methods of genome comparison have been explored for decades.5 These methods tend to be less accurate but much faster than alignment-based approaches. The most widely used strategy is to correlate the frequencies of words of some length, k, between pairs of sequences. Such k-mers can be looked up very efficiently in time linear in the size of the input data. This algorithmic optimality is the basis of the superior speed of alignment-free sequence comparison.
A disadvantage of k-mer methods is that it is difficult to convert word frequencies to evolutionary distances. To combine the speed of alignment-free methods with the biological relevance of distances computed from alignments, we have devised a new alignment-free strategy based on efficient matching of substrings between pairs of genomes.6,7 In the following we start by explaining this strategy and then use it to solve two interconnected problems in comparative genomics. First, we cluster all sequences belonging to one taxonomic group to get an overview of their relationships. Then we focus on a subset of these sequences to search for evidence of horizontal gene transfer.
SHortest Unique subSTRINGs: Shustrings
The basic idea for our approach is illustrated in Figure 2A, where two sequences S1 are compared. At every position in sequence we ask, what is the length of the shortest string starting at that position which is absent from. Consider, for example, the first query position in Figure 2A. The shortest substring that starts here and is absent from the subject is CGCCCT. Intuitively, if these “shortest unique substrings,” or shustrings, are long, S1 and S2 are closely related; if the shustrings are on average short, S1 and S2 are more distantly related.
Figure 2.
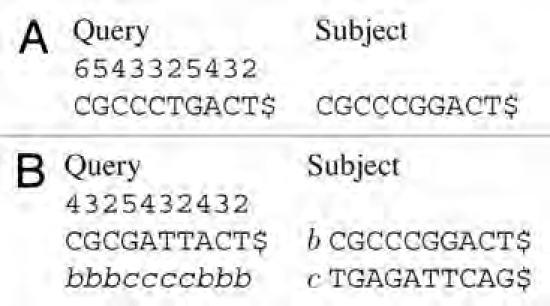
Shortest unique substrings. (A) Comparison between one query and a single subject sequence. The numbers above the query sequence indicate the length of the shortest unique substring (shustring) starting at that position that is absent from the subject. The sentinel character at the end of the sequence differs from every character, even from itself ($≠$), thus guaranteeing that a shustring length is defined at every query position. (B) Comparison between one query and two subject sequences, b and c. The characters below the query indicate the subject sequence to which the query is most similar at that particular position.
This intuition can be made mathematically precise,8 thereby yielding alignment-free estimates of Jukes-Cantor distances as implemented in our program kr.6 The advantage of this approach to distance computation is that, at least in theory, the time for looking up shustring lengths is linear in the size of the data set anlyzed. kr uses an approach that is slightly worse than this theoretical optimum, but is very efficient in practice, as we show below.
kr estimates global distances between genomes. However, we need estimates of local homology to detect horizontal gene transfer (Fig. 1). We have recently achieved the identification of local homology by generalizing the shustring approach, while retaining its efficiency.7 Instead of just asking for every position in a, what is the length of the shortest string that does not occur in b, we compare the query a to a set of subject sequences, consisting of, say, b and c. Then we ask two questions at every position i in a: (1) what is the length, l, of the shortest substring starting at i that is absent from b and c, and (2) which member of the subject set contains the match to the shustring trimmed by its rightmost position; that is, which member of the subject set contains an exact match to a[i..i+l−1]. For example, in Figure 2B the shustring at the first query position is CGCG, and subject b, but not c, contains an exact match to CGC. To a first approximation b is therefore locally the closest neighbor of a, as also illustrated in Figure 2B, where the closest neighbor is first b, before switching to c and then back to b again. We have implemented this idea in our program alfy (ALignment-free Local homologY). In the following section we give a tutorial-style example of applying first the global alignment-free analysis and then the local analysis to pinpoint candidate regions for horizontal transfer in the genomes of the human pathogen Staphylococcus aureus.
Example Application
Like the E. coli strain causing the recent German outbreak, certain S. aureus strains are notorious for high transmissibility combined with antibiotic resistance. The genome of S. aureus strain TW20, which consists of 3.1 Mb, has recently been sequenced.11 Apart from being highly transmissible, TW10 is also multi-antibiotic resistant and was identified as infecting patients in a London intensive care unit. We used kr to estimate pairwise distances between the 16 complete S. aureus genomes available at the time of analysis. They comprised 45.8 Mb and computation of the 120 pairwise distances between them took 2 min 25 s on a single CPU. TW20 is known to be a member of clonal complex 8 (CC8) and when we consult Table 1, we can see that the closest relatives of TW20 are the members of CC8. The cluster diagram Figure 3 summarizes the distances in Table 1. Unexpectedly, the strain TW20 groups with MRSA252. This disagreement between the cluster diagram and the underlying distances indicates that the distances do not fit on a phylogenetic tree, or, as phylogeneticists would say, the distances are not additive.9 When non-additive distances are clustered using the neighbor joining algorithm,10 the result may depend on the input order of the taxa.
Table 1.
(Part 1). All pairwise distances (x 1000) between the 16 Staphylococcus aureus genomes investigated in this paper; members of clonal complex 8 (CC8) and the distances between TW20 and members of CC8 are marked in bold
| N315 | Mu50 | COL | MRSA252 | MSSA476 | MW2 | RF122 | USA300_1 | |
| N315 | 0.00 | 0.07 | 3.21 | 5.82 | 3.04 | 3.04 | 9.79 | 3.22 |
| Mu50 | 0.07 | 0.00 | 3.29 | 6.07 | 3.14 | 3.14 | 10.04 | 3.20 |
| COL | 3.21 | 3.29 | 0.00 | 9.53 | 2.15 | 2.11 | 9.88 | 0.25 |
| MRSA252 | 5.82 | 6.07 | 9.53 | 0.00 | 9.98 | 9.57 | 10.78 | 9.16 |
| MSSA476 | 3.04 | 3.14 | 2.15 | 9.98 | 0.00 | 0.16 | 9.54 | 2.17 |
| MW2 | 3.04 | 3.14 | 2.11 | 9.57 | 0.16 | 0.00 | 9.67 | 2.01 |
| RF122 | 9.79 | 10.04 | 9.88 | 10.78 | 9.54 | 9.67 | 0.00 | 10.04 |
| USA300_1 | 3.22 | 3.20 | 0.25 | 9.16 | 2.17 | 2.01 | 10.04 | 0.00 |
| NCTC_8325 | 3.18 | 3.22 | 0.29 | 9.97 | 2.09 | 2.01 | 10.02 | 0.29 |
| JH9 | 0.18 | 0.23 | 3.28 | 6.57 | 3.04 | 3.06 | 10.00 | 3.24 |
| JH1 | 0.17 | 0.22 | 3.25 | 6.56 | 3.04 | 3.05 | 10.05 | 3.21 |
| Newman | 3.18 | 3.20 | 0.15 | 7.41 | 2.21 | 2.17 | 9.97 | 0.20 |
| Mu3 | 0.07 | 0.00 | 3.29 | 6.01 | 3.14 | 3.12 | 10.04 | 3.20 |
| USA300_2 | 3.21 | 3.20 | 0.25 | 9.13 | 2.16 | 2.01 | 10.03 | 0.02 |
| ED98 | 0.23 | 0.29 | 3.27 | 10.40 | 3.19 | 3.20 | 9.91 | 3.30 |
| TW20 | 3.76 | 3.60 | 0.49 | 2.33 | 2.88 | 2.85 | 10.85 | 0.40 |
Figure 3.
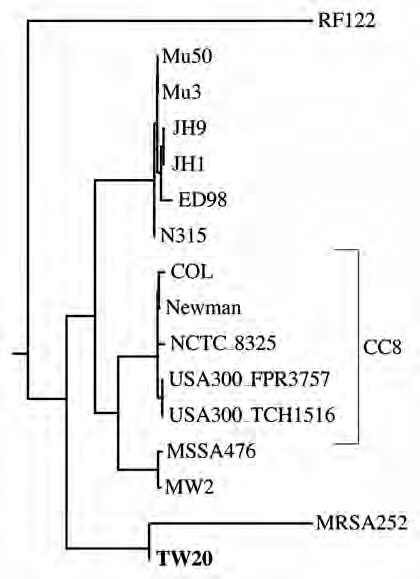
Cluster diagram of pairwise distances between 16 strains of S. aureus computed from their complete genomes using the program kr.7 Strain TW20 (shown in bold) is known to be a member of clonal complex 8 (CC8), as corroborated by the raw genetic distances in Table 1. However, application of the neighbor joining algorithm to these distances clusters strain TW20 with strain MRSA252.
To scan our data set for putative regions of horizontal gene transfer we used alfy to compare each of the 16 genomes in turn as query to the remaining 15 genomes as subject. When looking at TW20 as query the largest block of contiguous homology spanning 208 kb was to MRSA252. None of the other strains investigated displayed local homology to genomes outside of their closest clade mates. To further investigate the relationship between TW20, MRSA252 and CC8, we selected one of the two USA300 strains, USA300_TCH1516 as the closest relative of TW20 (Table 1). Next, we used alfy to compare TW20 as query to MRSA252 and USA300_TCH1516 as subject. Analysis of their combined 8.8 Mb took 15 s and revealed that 73.7% of the genome of TW20 are most closely related to USA300_TCH1516, as expected from its known membership of CC8 (Fig. 4). However, 19.4% of the TW20 genome are most closely related to MRSA252 and were thus most likely acquired by horizontal gene transfer. This is similar to the estimate of a 20.6% transfer from an ancestor of MRSA252 to an ancestor of TW20.11 We can also infer that the transfer took place after the recent divergence between the two USA300 strains and TW20.
Figure 4.

The genome of Staphylococcus aureus strain TW20 compared with two other S. aureus strains, USA300_TCH1516 and MRSA252.
To further investigate the horizontal gene transfer to an ancestor of TW20, we calculated two phylogenies: one for nucleotides 1–400 kb (Fig. 5A), and one for nucleotides 500 kb-2.8 Mb (Fig. 5B). As expected, in Figure 5A TW20 is the closest neighbor of MRSA252, while it is a member of CC8 in Figure 5B. Notice also that the branch connecting MRSA252 and TW20 in Figure 5A is longer than the branch connecting TW20 and its closest relative USA300_TCH1516 in Figure 5B. This indicates that the donor strain split from MRSA252 considerably earlier than the divergence of CC8.
Figure 5.

The phylogeny of Staphylococcus aureus changes along its genome. (A) Cluster diagram of the evolutionary distances between strains for the first 400 kb; (B) cluster diagram of the evolutionary distances between strains for the regions 500 kb-2.8 Mb (c.f. Fig. 4); TW20 is marked in bold.
Our analysis of S. aureus TW20 follows a well-established pattern. Given a new genome, it is first compared with all available closely related genomes to get an overview of their relationships (Fig. 3). This is usually followed by detailed investigations of local homology. In our analysis we used alfy to find that TW20 contained hundreds of kb homologous to MRSA252, a strain outside of its clonal cluster (Fig. 4). This explained why TW20 clustered with MRSA252 rather than CC8 (Fig. 3). Removal of the regions homologous to MRSA252 restored CC8 (Fig. 5B). But most of this had already been described;11 so why develop new sequence comparison methods when the alignment programs applied by previous authors and throughout biology seem to be perfectly adequate?
The alignment-free methods used in our application example are not designed to replace alignment-based approaches. Instead, they are meant to serve as rapid filtering methods for identifying regions that can then be investigated in more detail using alignments. Such filtering methods are developed in response to the fact that data analysis is increasingly becoming a more pressing issue in genomics than the traditional preoccupation with high-throughput data gathering.
Let's assume for the moment that the growth in the size of the data sets we wish to analyze is proportional to the growth in the speed of computer hardware. Even under this optimistic scenario only those analysis methods that run in time linear in the size of the input data will not eventually be overwhelmed by increases in the speed of data acquisition. This is why we stressed the potential of most alignment-free sequence comparison methods, including ours, to run in time and space that is linear in the size of the input data.
But there is a further snag: since the late 1960s hardware manufacturers have consistently doubled the number of microprocessor transistors roughly every two years. Somewhat alarmingly, though, between 1990 and 2008 GenBank has on average grown by a factor of 2.2 every two years (www.ncbi.nlm.nih.gov/genbank/genbankstats.html). So we do believe that work on fast analysis methods is a prerequisite for continuing to make the most of our investment in genome sequencing.
Table 1.
(Part 2).
| NCTC_8325 | JH9 | JH1 | Newman | Mu3 | USA300_2 | ED98 | TW20 | |
| N315 | 3.18 | 0.18 | 0.17 | 3.18 | 0.07 | 3.21 | 0.23 | 3.76 |
| Mu50 | 3.22 | 0.23 | 0.22 | 3.20 | 0.00 | 3.20 | 0.29 | 3.60 |
| COL | 0.29 | 3.28 | 3.25 | 0.15 | 3.29 | 0.25 | 3.27 | 0.49 |
| MRSA252 | 9.97 | 6.57 | 6.56 | 7.41 | 6.01 | 9.13 | 10.40 | 2.33 |
| MSSA476 | 2.09 | 3.04 | 3.04 | 2.21 | 3.14 | 2.16 | 3.19 | 2.88 |
| MW2 | 2.01 | 3.06 | 3.05 | 2.17 | 3.12 | 2.01 | 3.20 | 2.85 |
| RF122 | 10.02 | 10.00 | 10.05 | 9.97 | 10.04 | 10.03 | 9.91 | 10.85 |
| USA300_1 | 0.29 | 3.24 | 3.21 | 0.20 | 3.20 | 0.02 | 3.30 | 0.40 |
| NCTC_8325 | 0.00 | 3.24 | 3.21 | 0.23 | 3.22 | 0.28 | 3.25 | 0.51 |
| JH9 | 3.24 | 0.00 | 0.00 | 3.29 | 0.23 | 3.24 | 0.32 | 3.80 |
| JH1 | 3.21 | 0.00 | 0.00 | 3.26 | 0.21 | 3.20 | 0.30 | 3.74 |
| Newman | 0.23 | 3.29 | 3.26 | 0.00 | 3.20 | 0.21 | 3.34 | 0.44 |
| Mu3 | 3.22 | 0.23 | 0.21 | 3.20 | 0.00 | 3.20 | 0.29 | 3.59 |
| USA300_2 | 0.28 | 3.24 | 3.20 | 0.21 | 3.20 | 0.00 | 3.30 | 0.40 |
| ED98 | 3.25 | 0.32 | 0.30 | 3.34 | 0.29 | 3.30 | 0.00 | 4.02 |
| TW20 | 0.51 | 3.80 | 3.74 | 0.44 | 3.59 | 0.40 | 4.02 | 0.00 |
Acknowledgments
M.D.-L. was supported by a doctoral fellowship of the Max-Planck Society, and by the Croatian Ministry of Science, Education and Sports (grant 036-0361983-2012 to M.B.).
References
- 1.Smith JM, Dowson CG, Spratt BG. Localized sex in bacteria. Nature. 1991;349:29–31. doi: 10.1038/349029a0. [DOI] [PubMed] [Google Scholar]
- 2.Kosakovsky Pond SL, Posada D, Stawiski E, Chappey C, Poon AF, Hughes G, et al. An evolutionary model-based algorithm for accurate phylogenetic breakpoint mapping and subtype prediction in HIV-1. PLOS Comput Biol. 2009;5:e1000581. doi: 10.1371/journal.pcbi.1000581. [DOI] [PMC free article] [PubMed] [Google Scholar]
- 3.Didelot X, Lawson D, Darling A, Falush D. Inference of homologous recombination in bacteria using whole genome sequences. Genetics. 2010;186:1435–1449. doi: 10.1534/genetics.110.120121. [DOI] [PMC free article] [PubMed] [Google Scholar]
- 4.Dewey CN, Pachter L. Evolution at the nucleotide level: the problem of multiple whole-genome alignment. Hum Mol Genet. 2006:R51–R56. doi: 10.1093/hmg/ddl056. 15(Spec No 1) [DOI] [PubMed] [Google Scholar]
- 5.Vinga S, Almeida J. Alignment-free sequence comparison—a review. Bioinformatics. 2003;19:513–523. doi: 10.1093/bioinformatics/btg005. [DOI] [PubMed] [Google Scholar]
- 6.Domazet-Lošo M, Haubold B. Efficient estimation of pairwise distances between genomes. Bioinformatics. 2009;25:3221–3227. doi: 10.1093/bioinformatics/btp590. [DOI] [PubMed] [Google Scholar]
- 7.Domazet-Lošo M, Haubold B. Alignment-free detection of local similarity among viral and bacterial genomes. Bioinformatics. 2011;27:1466–1472. doi: 10.1093/bioinformatics/btr176. [DOI] [PubMed] [Google Scholar]
- 8.Haubold B, Pfaffelhuber P, Domazet-Lošo M, Wiehe T. Estimating Mutation Distances from Unaligned Genomes. J Comput Biol. 2009;16:1487–1500. doi: 10.1089/cmb.2009.0106. [DOI] [PubMed] [Google Scholar]
- 9.Swofford DL, Olsen GJ, Waddell PJ, Hillis DM. In: Phylogenetic inference in Molecular Systematics. 2nd ed. Hillis DM, Craig M, Marble BK, editors. Sunderland: Sinauer; 1996. pp. 407–514. [Google Scholar]
- 10.Saitou N, Nei M. The neighbor-joining method: a new method for reconstructing phylgenetic trees. Mol Biol Evol. 1987;4:406–425. doi: 10.1093/oxfordjournals.molbev.a040454. [DOI] [PubMed] [Google Scholar]
- 11.Holden MT, Lindsay JA, Corton C, Quail MA, Cockfield JD, Pathak S, et al. Genome sequence of a recently emerged, highly transmissible, multiantibiotic-and antiseptic-resistant variant of methicillin-resistant Staphylococcus aureus, sequence type 239 (TW) J Bacteriol. 2010;192:888–892. doi: 10.1128/JB.01255-09. [DOI] [PMC free article] [PubMed] [Google Scholar]