Figure 6.
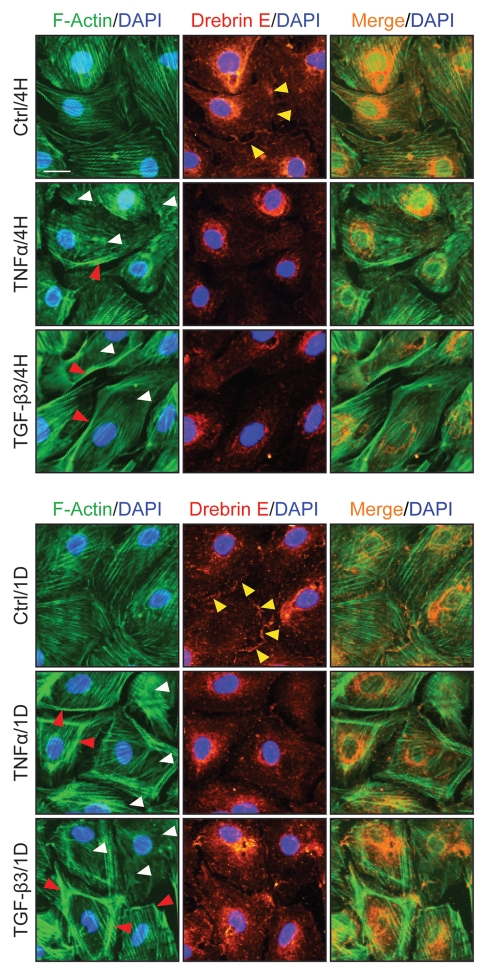
A study by dual-labeled immunofluorescence analysis to assess the effects of cytokines on the actin filament cytoskeleton and the distribution of drebrin E in Sertoli cells. Sertoli cells were cultured at 0.0125 × 10⁶ cells/cm2 on Matrigel-coated coverslips in F12/DMEM for 4 d at 35°C with 5% CO2/95% air (v/v) in a humidified atmosphere prior to treatment. This cell density was selected to ensure that Sertoli cell nuclei would be evenly distributed and changes in drebrin E (red fluorescence) and F-actin (green fluorescence) filament distribution at the Sertoli-Sertoli cell interface and cell cytosol would be readily visible. Also, at this cell density, ultrastructures of TJ, basal ES, desmosome, and GJ were detected at the Sertoli-Sertoli cell interface under electron microscopy, illustrating functional junctions were established in these cell epithelia as detailed elsewhere.38,54,77 It was noted that in the control Sertoli cells, F-actin formed an extensive network of filaments, which was used to maintain proper cell shape. Drebrin E was detected at the Sertoli-Sertoli cell interface (see “yellow” arrowheads in middle column) and in the cell cytosol. Co-localization of drebrin E was detected in the cell cytosol, surrounding the cell nucleus, as well as at the cell-cell interface. These findings are also consistent with findings shown in Figure 4A. However, following treatment of Sertoli cells with either TNFα or TGFβ3 for 4 h (hr), actin filaments were found to become truncated and appeared defragmented with some actin filaments being disrupted (see “white” arrowheads). Additionally, actin filaments at the cell-cell interface appeared to move away from the cell-cell interface, forming actin bundles at the cell periphery (see “red” arrowheads) after treatment of the Sertoli cell epithelium with cytokines for 1D (day). Also, drebrin E no longer co-localized with F-actin at the cell-cell interface (see merged images in both treatment groups vs. control group) and drebrin E was localized mostly in Sertoli cell cytosol. Sertoli cell nuclei were visualized by DAPI staining (blue). These micrographs are representative findings from one experiment, but this experiment was repeated three times using different batches of Sertoli cells, which yielded similar results. Bar = 30 µm, which applies to all micrographs.

