Abstract
Because stroke remains an important and time-sensitive health concern in developed nations, we present a system capable of fusing 3-D transcranial ultrasound volumes acquired from two sides of the head. This system uses custom sparse array transducers built on flexible multilayer circuits that can be positioned for simultaneous imaging through both temporal acoustic windows, allowing for potential registration of multiple real-time 3-D scans of cerebral vasculature. We examine hardware considerations for new matrix arrays—transducer design and interconnects—in this application. Specifically, it is proposed that SNR may be increased by reducing the length of probe cables. This claim is evaluated as part of the presented system through simulation, experimental data, and in vivo imaging. Ultimately, gains in SNR of 7 dB are realized by replacing a standard probe cable with a much shorter flex interconnect; higher gains may be possible using ribbon-based probe cables. In vivo images are presented, showing cerebral arteries with and without the use of microbubble contrast agent; they have been registered and fused using a simple algorithm which maximizes normalized cross-correlation.
I. Introduction
Stroke constitutes a significant public health concern [1] and is recognized by the World Health Organization as the second-leading cause of death globally and the leading cause in middle-income nations [2]. Computed tomography (CT) is the imaging modality most commonly used to assess the underlying nature of a potential stroke (i.e., hemorrhage, thrombus, general hypoperfusion). If the stroke can be determined to arise from the presence of a thrombus or embolus within a specified time window—currently 4.5 hours in the U.S. [3]—tissue plasminogen activator (tPA) can be administered intravenously to break up the thrombus, decreasing recovery times and improving patients’ functional outcomes [4]. As a diagnostic tool to aid in decision-making, transcranial ultrasound might constitute a safer, less expensive, more portable alternative to cT for the emergency room and ambulance settings. Several recent studies have found that performing ultrasound examinations in the field or ambulance does in fact add diagnostic value [5], [6]. In the case of stroke, a stroke team assembled at a hospital would be able to prepare tPA before the patient's arrival [7].
Although 1-D transcranial Doppler (TCD) has been used to non-invasively measure blood flow velocities in cerebral arteries since the 1960s [8], transcranial imaging with color flow provides real-time blood flow imaging in an exam that can be performed in approximately 15 min, an important consideration given the necessity of early treatment in stroke [9]. In addition, the vessels under examination are tortuous and prone to anatomical variants [10], making it difficult to visualize blood flow in a single imaging plane. Thus real-time three-dimensional (RT3D) ultrasound provides an attractive means of capturing a more complete view of a vessel's course [11].
The discovery [12] of a thinner [13], less aberrating region of the temporal bone measuring 2 to 3 cm in diameter provided a window for insonification of the internal carotid arteries and the arteries of Circle of Willis. Bone within this region—the temporal acoustic window—is comprised mainly of compact bone (α ≈ 2.8 dB·cm–1·MHz–1) and is more uniform in thickness and composition than the cancellous bone (α ≈ 25 to 70 dB·cm–1·MHz–1) [14] surrounding the window. Thus, imaging through the temporal acoustic window reduces the aberration and attenuation induced by the skull, although the nonlinear propagation of ultrasound waves in the skull has been shown to produce absorption and transference of energy to higher frequencies [15], [16]. An alternative approach uses a sub-occipital window, i.e., scanning via the foramen magnum, and is used to examine blood flow in the basilar and vertebral arteries [10]. Together, these windows can capture all paths by which blood enters the brain.
Imaging through the temporal acoustic window allows for transmit frequencies in the 1 to 3 MHz range, and also suggests the use of a phased array transducer with an aperture capable of fitting within the window. These technical specifications match closely with the probes in mass production for transthoracic echocardiography. In recent years, many groups have presented techniques for correcting the wavefront aberration caused by the human skull. Our own group has previously used the multi-lag least-mean-square cross-correlation algorithm [17]–[19] to demonstrate the first successful in vivo transcranial phase corrections on a matrix array [20], [21]. Other techniques improving transskull focusing in diagnostic or therapeutic applications include using time-reversal mirrors to correct on a point target or induced cavitation bubble [22]–[25], computing element delays based on MRI or CT mapping of skull structure [26], [27], using shear mode conversion to lessen the effects of aberration because of the similarity between shear wave velocity in the skull (1400 m/s) and longitudinal wave velocity in brain tissue (1530 m/s) [28], [29], and making use of a contralateral source [30], [31]. These approaches improve contrast and spatial resolution in imaging through the intact skull and suggest a promising future for in vivo transskull imaging with 2-D arrays.
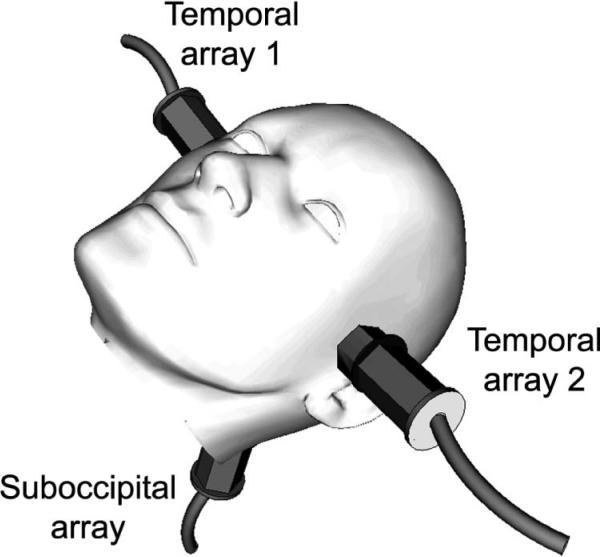
In light of these historical developments in transcranial ultrasound imaging and system considerations, we present the design and fabrication of sparse 2-D array probes for dual real-time 3-D transcranial imaging by simultaneously acquiring pulse-echo volumes from both temporal acoustic windows. We have previously proposed the system shown in Fig. 1, in which three matrix arrays simultaneously scan via both temporal and the single suboccipital acoustic window, which we called the ultrasound brain helmet [32]. Feasibility of this approach was demonstrated using two 3-D scanners and a screen splitter to simultaneously acquire two in vivo volumes, then using a single scanner with two commercial matrix arrays to simultaneously scan both temporal windows of a custom skull phantom. This previous work used microbubble contrast agent to enhance the in vivo color flow signal.
Fig. 1.
Probe placement for proposed transcranial imaging system using three 2-D arrays.
In this work, we present a system with custom transducers and interconnects capable of simultaneously scanning via both temporal acoustic windows. This system uses transducers built on short multilayer flexible circuits to increase SNR and reduce the need for microbubble contrast agent. Given the rapidly increasing number of commercially-available laptop scanners, adapting the proposed cable-less multi-transducer approach to a laptop scanner seems both technically possible and clinically useful for pre-hospital settings.
By constructing a system capable of simultaneously scanning both temporal windows, we have been able to acquire two time-varying 3-D data sets of cerebral vasculature which can be spatially registered and fused into a single 3-D volume rendering. There are several advantages to such a scheme: 1) Given the attenuation caused by brain parenchyma (α ≈1 dB·cm–1·MHz–1) [33] and the reflection and refraction caused by midline structures such as the falx cerebri, imaging contralateral cerebral structures becomes quite difficult; 2) the diagnostic value of the acquired data sets is increased by visualization of the entire Circle of Willis, which we achieve by registering and fusing the color Doppler data acquired by the two probes—thus we present a scheme for registering two simultaneously-acquired 3-D volumes; 3) direct comparison of flow on two sides of the head is now possible, adding clinical value and providing the potential to compute an asymmetry index [34].
II. Methods
A. Volumetrics 3-D Scanner Modifications
The experiments presented in this article were performed using the Volumetrics Model 1 scanner (Volumetrics Medical Imaging, Durham, NC), a real-time 3-D ultrasound system using 16:1 parallel receive processing [35], [36]. This system has 256 channels that only transmit and 256 shared transmit/receive channels. A 2-D phased array transducer typically transmits 256 broadened beams in succession. For each transmit beam, 16 receive beams are formed from echoes arranged in a 4 × 4 pattern at positions slightly off-axis from the center of the transmit beam, with a transmit beam spacing of 4° in a typical 64° × 64° scan. The scanner is capable of frame rates up to 30 volumes/sec and typically displays the following views in real-time: one slice in azimuth, one in elevation, and two C-scans parallel to the face of the transducer. It also features 3-D color flow imaging, pulsed spectral Doppler, and M-mode capabilities.
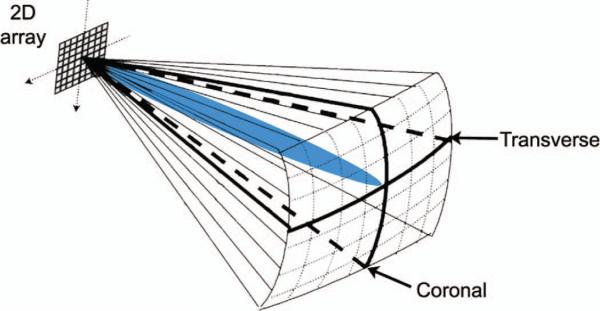
To enable the brain helmet, we have split the scanner's channels and its 4096 image lines equally between two matrix arrays so that two 64° × 64° pyramidal volumes may be acquired simultaneously. Each matrix array can now have a maximum of 128 elements that only transmit and 128 shared transmit/receive elements. As before, for each transmit beam, 16 receive beams are formed from one of the two transducers. However, transmit beam separation has now doubled in the elevation direction, so transmit beams in each 64° × 64° volume are now spaced at 4° in azimuth and 8° in elevation. We now display four slices from two probes in real-time: one azimuth and one elevation slice from each transducer, corresponding to coronal and transverse planes in transtemporal imaging (Fig. 2). The operator uses a trackball control to select any four slices in either volume for display. At the push of a button, system delays can be reloaded from memory to allow single-array scanning from either of the two probes, improving spatial sampling by restoring all 4096 image lines to a single matrix array. We retain 3-D color flow and spectral Doppler capabilities in both single- and dual-array scanning modes.
Fig. 2.
Volume interrogated during a typical transtemporal 3-D ultra-sound examination. Coronal and transverse plane views are displayed simultaneously. A steerable Doppler beam is shown (blue in the online version). 
B. Cable Modeling and Experiments
The technical advantages and disadvantages provided by 2-D array transducers are well known. In brief, although a 2-D or matrix array probe is capable of acquiring an entire 3-D volume in real time when used with parallel receive processing, each 2-D array element suffers from a poor electrical match with the cable it drives during echo reception. This arises from the simple fact that when electroded on two sides, each piezoelectric element becomes a capacitor having a capacitance on the order of 1 to 10 pF, whereas a typical system cable connecting the probe to the scanner is approximately 2 m in length and has a capacitance on the order of 90 pF/m. Because the source (element) and load (cable) impedances are poorly matched, power transfer is poor but noise sources (thermal, preamp) are unaffected, resulting in an SNR that is severely diminished from the optimum case [37].
Although in this work we only address the electrical impedance mismatch between the probe and the cable, matching at the opposite end of the cable, between the cable and the pre-amplifier, is of equal importance. To optimize SNR, it has been proposed that preamp noise source impedance should be matched to element impedance for preamps located in the transducer handle, although it is acknowledged that such a preamp design may not be achievable [37], [38]. Although matching at the cable-preamp interface undoubtedly produces an even greater sensitivity gain, our proposal for improving impedance matching only at the probe-cable interface can be more readily implemented on existing scanners and still provides an increase in SNR. Given the length dependence of the cable capacitance, we propose that for certain applications such as transcranial imaging, the cable may be eliminated and replaced by a short flexible multilayer circuit, or flex, on which the probe is fabricated, thus improving matching and increasing receive sensitivity.
In proposing reduction of cable length as a practical modification for increasing SNR, we have thus far discussed impedance matching as though each trace was a simple circuit. Although circuit analysis predicts the effect of varying the element, cable, and preamp impedances on the amplitude of the signal at the preamp, this model obviously oversimplifies the behavior of the cable by treating it as a lumped element rather than a distributed element, i.e., a transmission line. For this reason, we used the software package PiezoCAD (Sonic Concepts, Bothell, WA) to model a piezoelectric element with varying cable loads using the KLM model [39]. For the control case, these simulations were performed using the actual specifications of our existing volumetrics 2.5-MHz 2-D cardiac array as input parameters [40], including its actual cable length of 2.23 m. A typical cable capacitance was determined from manufacturer's specifications to be 88.6 pF/m (Tyco Electronics, Berwyn, PA). The actual input impedance of the scanner's preamplifiers was also used. For the test case, the cable length was set to the length of the shortest flex circuit capable of extending from the scanner to a patient's temporal acoustic window, approximately 0.30 m. Capacitances for both the multilayer flex circuit and the FR-4 printed circuit board were computed using microstrip equations as in [41], and depend on the trace dimensions and dielectric materials. We computed the total capacitance for a typical trace traversing both the flex and printed circuit board to be 66.4 pF. Simulated pulse-echo voltages were compared for the two cases.
We have previously examined the effect of reducing interconnect length while maintaining a common cable construction both in simulations and experimentally [42]. These results showed a simulated 16 dB and measured 14 dB increase in SNR caused by decreasing the length of MicroFlats cabling (W.L. Gore, Pleinfeld, Germany) from 2.87 to 0.40 m. It should be noted that the inter-trace dielectric most commonly used in flex circuits is polyimide, which has a relative dielectric constant (εr) of approximately 3.4 [41]. Griffith and Lebender estimate that for MicroFlats-type cable, εr ≈ 1.75 [43]. However, for this project, we believe the manufacturability and mechanical stability provided by the polyimide flex circuit outweigh the benefits of a ribbon-based probe cable.
C. Transducer Design
In designing a transcranial probe, we assumed that the entire footprint of the probe should fit within a patient's temporal acoustic window, generally 2 to 3 cm in diameter but varying widely among individuals [44]. If the aperture partially exceeds the window, signals received on this portion of the array will experience much greater attenuation given the aforementioned differences in bone structure inside and outside of the window. This drastic signal dropout over part of the array degrades the SNR of the beamformed signal. Vignon et al. recently underscored the importance of placing the probe within the window by demonstrating a 20 dB improvement in image brightness at 3.2 MHz when beamsummed data from a contralateral source were used to optimize probe placement on ex vivo temporal bones [45].
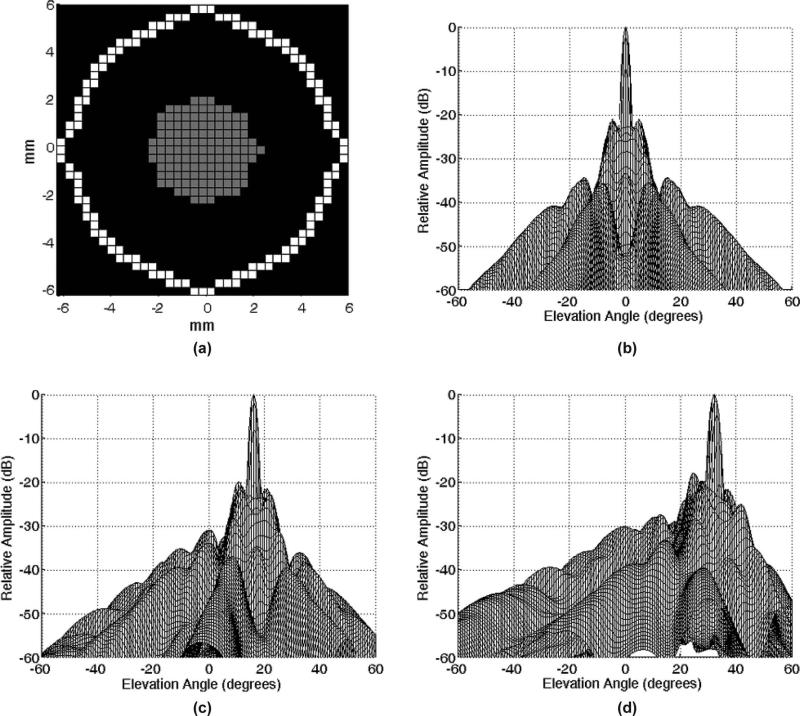
Because our system channels have been split to drive two transducers, we are further limited in the size of the aperture we can design; we can have at most 128 receive and 256 transmit elements per probe, where all receive elements are shared transmitters/receivers. Given the general elliptical shape of the window, we have adopted a sparse phased array design with the bull's eye pattern of active elements shown in Fig. 3(a). Element pitch is 0.35 mm, which is 0.57λ at 2.5 MHz or 0.41λ at 1.8 MHz, the expected frequency range of operation. This configuration was designed using concepts of grating lobe suppression and side lobe tradeoff presented in 2-D array design methodologies [46], [47] and was selected from several simulated apertures on the basis of Field II simulations (Fig. 3) [48].
Fig. 3.
(a) Designed aperture (gray elements only transmit, white elements transmit and receive) and (b) resultant on-axis beamplot simulated using Field II. Simulations of the aperture steered to (c) +16° and (d) +32° in both azimuth and elevation at 2.5 MHz and a 7-cm focus.
D. Transducer Fabrication and Integration
Constructing this system with integrated transducers required the fabrication of two types of circuit boards: the flexible circuit on which the transducers are to be built and a rigid FR-4 printed circuit board (PCB) to couple these two transducers to the scanner. In collaboration with Microconnex (Snoqualmie, WA), we designed a polyimide-substrate multilayer flexible circuit 279 mm in length. The narrow end contains gold pads spaced at 0.35 × 0.35 mm and arranged as in Fig. 3(a). The traces for 256 active elements are brought out to two rows of gold pads at the wide end of the flex for connection to a 300-pin electronic connector (BTH-150, Samtec Inc., New Albany, IN). Microconnex performed the layout and fabrication of this flex circuit. The fabricated circuit has two trace layers with a dedicated ground layer for each. The total thickness is 210 μm, or approximately 0.2λ at 2.5 MHz, assuming cpolyimide = 2170 m/s. Typical trace length is approximately 270 mm; typical inter-trace separation is 0.20 mm at the narrow end and 0.50 mm at the wide end of the flex.
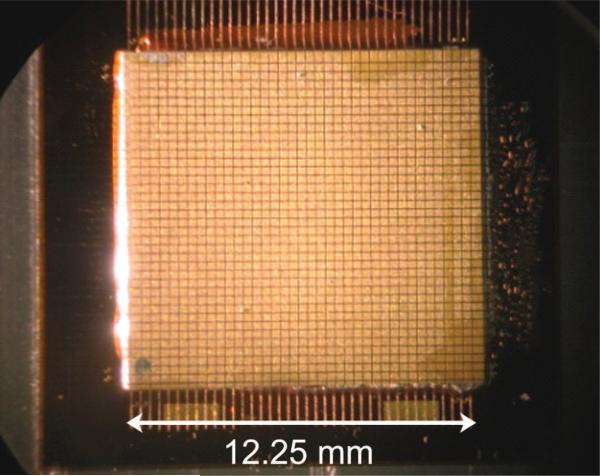
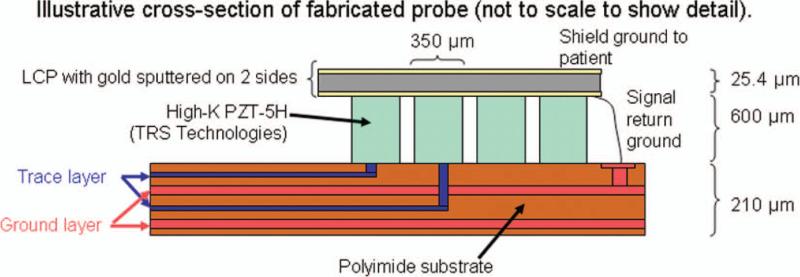
In building a single transducer, a piece of high-dielectric PZT-5H (TRS Technologies Inc., State College, PA) is cut to size and bonded to the flex circuit with conductive epoxy (Chomerics, Woburn, Ma). Next elements are diced at 0.35 × 0.35 mm using a programmable dicing saw (DAD3220, Disco Corp., Tokyo, Japan). A photograph of an array after dicing is shown in Fig. 4. Then, a piece of liquid crystal polymer (LCP) with gold sputtered on two sides is bonded to the diced elements, forming the ground electrode and a shield ground. These separate grounds are maintained on the coupling board. An illustrative cross-section of this stack is shown in Fig. 5. Finally, an acoustically lossy backing is cast and bonded to the back of the flex. Connectors are hand-soldered to each flex to be mated with the PCB.
Fig. 4.
Photograph of an array after completion of dicing. 
Fig. 5.
Illustrative stack of transducer fabrication (not to scale). PZT is bonded to the polyimide flex circuit and diced, then two-sided LCP is bonded to the PZT. A lossy backing is bonded to the back of the flex (not shown). 
The six-layer FR-4 coupling board was fabricated for us by Moog Components (formerly PCSM), Galax, Va. It contains two connectors that mate with the two transducers (Samtec BSH-150) and two connectors mating with the scanner (DLM6–360P, ITT Interconnect Solutions, Santa Ana, CA). This board was designed to be slightly thicker (total thickness = 2.36 mm) than a standard FR-4 board, so it would have the rigidity to support the weight of the probes. Once two fabricated probes were connected to the coupling board, a Plexiglas plate was used to clamp them in place, preventing any flexing or tearing at the solder joints and insulating exposed pads from the environment.
E. Performance Testing
Tests were performed on the completed transducers to measure pitch-catch sensitivity and bandwidth, 50-Ω insertion loss, and crosstalk. The pitch-catch characteristics were tested using a function generator (33250A, Agilent Technologies, Santa Clara, CA) and RF power amplifier (ENI 525 LA, Electronic Navigation Industries, Rochester, NY) to produce a 3-cycle pulse at 2.3 MHz into an aluminum block in a water tank. Oscilloscope data were read into a personal computer at 250 MHz using LabView (National Instruments, Austin, TX) and spectra were computed in Matlab (The MathWorks, Natick, MA).
50-Ω insertion loss was measured on 20 pairs of elements using a similar setup, with element input and output impedances both at 50 Ω. Peak-to-peak voltage was measured with the aluminum block positioned as close as possible to the face of the transducer to limit diffraction effects. Worst-case crosstalk was similarly measured on the 20 pairs of adjacent elements with traces running in parallel over the greatest distances. Here, the receive element was loaded to match the input impedance of scanner's preamplifier.
F. Processing for Offline Registration
Although we have described our real-time display for dual transducers, to realize the full potential of 3-D ultra-sound in imaging blood flow in cerebral arteries, acquired volumes must be displayed in 3-D. This section describes our first attempt at registering and fusing acquired volumes into the 3-D figures presented in this paper. This approach for registration and rendering of saved volumes is performed offline in Matlab. As will be discussed, our methods are simple but nonetheless address the problem of registering and fusing 3-D volumes of ultrasound rapidly and with limited user intervention.
The nature of ultrasound data presents unique challenges to the visualization of volumetric data sets, as tasks such as segmentation and rendering become difficult in the presence of speckle and blurred boundaries of varying intensity levels [49], [50]. Approaches to registration commonly optimize a measurement of correspondence between a reference volume and a test, or homologous, volume. Registration of multimodality scans of the brain has previously been performed using intraoperative ultrasound volumes acquired with the skull removed [51]–[53]; however, to our knowledge, this is the first attempt at registration of transcranial ultrasound volumes of the brain.
Metrics that have been used in the context of 3-D ultrasound registration include normalized cross-correlation [50], [54], [55], mutual information [56], [57], and local orientation and phase [58] using the monogenic signal [59]. Optimizing mutual information (MI) is a popular approach in the image processing community and has demonstrated rapid performance for affine and elastic transformations in medical ultrasound [57], [60], [61]. The use of correlation coefficient as a voxel similarity metric has been shown to provide measures of registration error in volumetric ultrasound data sets similar to MI as a function of both noise level and degree of deformation [57]. In addition, the skull-encased brain is a highly rigid organ, so the need for elastic or shearing transformations would not seem to be as great as in registration of abdominal or thoracic ultrasound images [61]. Thus, we have elected to use a correlation coefficient-based approach with only rigid transformations, i.e., translation and rotation.
Because of the limited computational power of our scanner, acquired volumes are transferred to a personal computer adjacent to the scanner for 3-D display at the patient's bedside. The following scheme for pre-processing and volume rendering has been implemented in Matlab. When the scanner saves a volume, it is stored as a block of envelope-detected echo data in r-θ-ϕ coordinates followed by a block of color flow (or doppler) in r-θ-ϕ coordinates. For Doppler data, both magnitude and signed velocity data are saved. A file header contains information such as scan depth and Doppler gate position which is necessary for offline reconstruction. Care was taken during our transcranial studies to set the compression curve to linear so that saved data were not log-compressed.
The basic data flow for offline processing of two 3-D volumes is as follows: data transfer and scan conversion, pre-processing for correlation search algorithm, 3-D correlation search, thresholding, and display of fused volumes. This flow is discussed in detail in the following subsections.
1) Data Transfer and Scan Conversion
When a color flow volume is acquired, saved volumes typically include approximately 16 frames from each transducer and can be as large as 64 MB in size. (Note that the term “frame” indicates an entire 3-D volume at a single snapshot in time.) All frames are saved to the scanner's hard drive and transferred to a PC via UDP transfer over an Ethernet cable. Upon reception by the PC, data are read into Matlab and split into two volumes for the two acquiring transducers. In the elevation dimension—which is spatially sampled at half the frequency of the azimuth dimension—data are interpolated using low-pass interpolation to maintain symmetric voxels. Each volume of echo data is scan converted to x-y-z Cartesian coordinates with a voxel size of 1.16 × 1.16 × 0.94 mm. Doppler data are similarly scan-converted, with volume sizes varying according to the size of the region defined by the Doppler gates during scanning.
2) Pre-Processing
Next, data are run through 3-D median and low-pass filters of length 3 × 3 × 3. Median filters have been commonly used to reduce speckle in registration of 3-D ultrasound volumes [61] and to smooth flow data in both sum-absolute-difference (SAD) and cross-correlation algorithms [62], [63], whereas a low-pass filter improves long-range correlation and helps avoid entrapment in local maxima [60].
Finally, although we hope to achieve sufficient SNR to visualize the time variation of blood flow in 3-D, the in vivo color flow SNR without contrast agent is not high enough to identify vessels in this way. For this reason, because we are simply seeking to locate and identify cerebral arteries, we average the acquired frames of the Doppler magnitude data (backscattered Doppler intensity), increasing SNR by √N where N is number of frames. Although this removes information pertaining to blood flow in time, our primary objective with the 3-D display is to identify the spatial course of cerebral vessels; temporal information is still available on the real-time display. This is analogous to increasing the scanner's persistence to its maximum level.
3) Correlation Search
A rigid transform approach to registering the two Doppler volumes acquired from opposing transducers was implemented which maximizes the normalized cross-correlation:
| (1) |
This is similar to multi-modality approaches which use vessels as fiducials [54], [55]. A(x, y, z) and B(x, y, z) are two scan-converted Doppler volumes; α, β, and γ indicate the distance by which volume B is shifted relative to volume A in the x, y, and z directions. The values of α, β, and γ at which ρα,β,γ is at its maximum are determined. These translation indices are denoted αo, βo, and γo. Next, a second correlation search maximizes rotation of the volumes in azimuth and elevation (the probes cannot rotate about the third axis). This sequential approach is used because investigating all translation-rotation combinations produced prohibitively long runtimes. The rotational normalized cross-correlation function is given as
| (2) |
where the operator rot[V, θ, ϕ] is used to indicate rigid rotation of some volume V about angle θ in azimuth and ϕ in elevation. Rotation is maximized in two dimensions by determining θo and ϕo, the values of θ and ϕ which maximize ρθ,ϕ. Because only slight tilts in the transducers are expected, the extents of θ and ϕ are set to ± 20° in 2° increments.
To decrease the runtime of the correlation search program, a time-of-flight measurement is used to reduce the set of search values in z, the range direction. During the first image line of every frame, the central nine transmit elements of transducer A are fired in phase while all receive elements on transducer B are enabled. All remaining elements on both transducers are disabled. During the second line of each volume, the reverse occurs: transducer B fires nine central elements and transducer A receives on all elements. The two times at which the fired pulses are received are averaged and a bulk speed of sound of 1540 m/s is assumed to compute the separation between the two transducers. This method was first tested in a custom water tank having aligned, side-viewing silicone rubber panels on either side. Here, the speed of sound was assumed to be 1500 m/s and the measured distance across the tank was compared with ten time-of-flight measurements made with aligned transducers. The time-of-flight measurement was 18.12 ± 0.05 cm; the dimension of the tank was 18.10 cm. In the correlation search described by (1), the value of γ—variation in range z—is only varied within ± 5.5 mm of the time-of-flight estimate. Values of α and β—shifts in x and y—include all possible overlaps between the two Doppler volumes. Registration was not optimized at this time.
Using the described procedure for maximizing normalized cross-correlation of Doppler volumes in rigid body transformations, we have observed in vitro values of ρθ,ϕ—the correlation coefficient after successive maximizations of translation and rotation—of approximately 0.7 when registering flow in a tube within the polymer casting of the skull. In vivo correlation coefficients have typically been lower, in the range of 0.5 to 0.6. Runtimes of the entire described processing are < 10 min on a Dell PC (Dell Inc., Round Rock, TX) running Windows (Microsoft Corp., Redmond, WA) with a single 3.2-GHz Pentium 4 processor (Intel Corp., Santa Clara, CA). However, transferring a volume takes approximately 10 min because of the Volumetrics scanner's bus speed.
4) Validation of Algorithm
Registration error was evaluated for the described algorithm, in which time-offlight data restricts the search region of correlation search. This was done using a simple flow phantom consisting of a 5-mm-diameter latex tube in the side-viewing water tank with agitated saline pumped through at approximately 100 cm/s. Both transducers acquired color flow volumes of flow in the same tube and the tubes were registered using the described algorithm. The long axis of the tube was oriented parallel to the beam of the transducers to produce the highest possible detection of flow. Three different acquisitions were performed for each of three different transmit power levels (50%, 25%, 5%). The center of mass of each 3-D tube rendering was computed in x and y (directions perpendicular to flow) to create two curves in 3-D space having height and width of a single voxel. Registration error was taken to be the measured distance between these curves in x, y, and z directions.
5) Thresholding and Display
A simple segmentation is performed to prepare the data for volume rendering. To render, we wish to set thresholds for both echo and Doppler data for each volume. Although segmentation of ultrasound images is a complex topic which has received much attention [64], [65], we merely wish to extract vessels and bony surfaces from noise so that they may be identified in a simple 3-D display; thus, we elected to set thresholds manually at the end of the rendering process. Although this requires user intervention and re-rendering, this process is analogous to adjusting the echo or color flow reject on the scanner and usually required no more than 5 re-renderings in practice to achieve a suitable image. All voxels having values equal to or greater than the selected threshold will be rendered following registration, producing a single fused image in an interactive display which allows viewing from any angle.
Although the described programs perform a registration within approximately 20 min of acquisition in our lab (additional time is due to saving and transfer of volume), because of concerns regarding space and maintaining workflow, we elected not to perform registration and rendering at the bedside in the medical center for our human study. Instead, acquired volumes were saved to disk and registration was performed offline afterward using the same programs.
G. Human Study Protocol
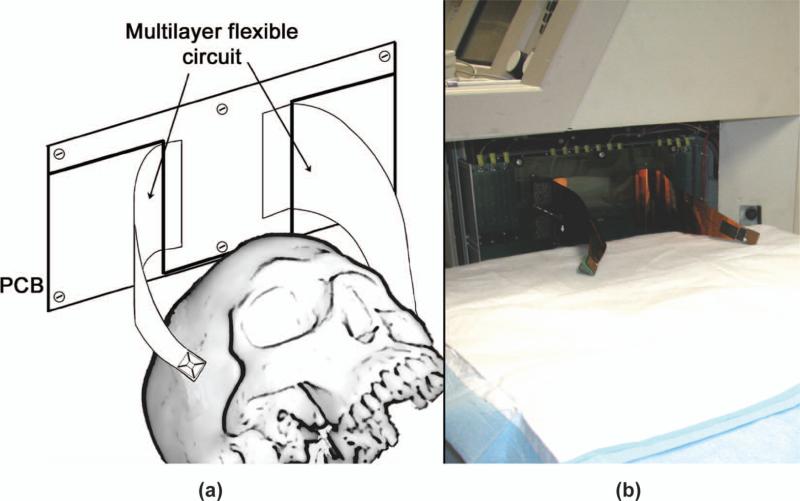
Following an institutional review board-approved protocol, and in collaboration with Duke University Medical Center, we have scanned six healthy individuals using the described brain helmet system. The last four of these six subjects received an intravenous infusion of Definity microbubble contrast agent (Lantheus Medical Imaging, N. Billerica, MA) at a concentration of 1.3 mL in 50 mL saline. These early scans allow us to evaluate the suitability of the device for performing clinical scans and to assess the quality of the resulting images and renderings. To scan a human, a patient bed with adjustable height is positioned adjacent to the scanner [Fig. 6(b)]. The two probes are placed on the temporal acoustic windows of a supine patient while scanning in echo mode. Once probes have been positioned for optimal viewing of blood flow in either the middle or posterior cerebral arteries, the volunteer is given the intravenous injection. Scans were performed under the supervision of a neurologist, a registered nurse, and a registered vascular technologist.
Fig. 6.
(a) schematic and (b) photograph of the completed system for in vivo scanning. 
III. Results
A. Cable Modeling and Experiments
When modeling two probes which are identical except for their cable lengths (2.23 and 0.30 m), PiezoCAD simulations predict an increase in sensitivity of 16.0 dB. However, the commercial probe used as a control has an acoustic matching layer, whereas our proposed prototype probe does not. Additionally, the commercial probe contains individual wires partially separated by air, thus having a relative permittivity (εr) close to 1, whereas for polyimide, the inter-trace dielectric most commonly used in flex circuits, εr ≈ 3.4 at 1 MHz [41]. Taking these differences into account, when PiezoCAD simulations were used to directly compare the two physical probes—the control probe, having a long cable and an acoustic matching layer, versus the probe to be constructed, having a short flex interconnect, printed circuit board, and no matching layer—the expected sensitivity gain was 7.2 dB for a typical trace.
B. Transducer Aperture Characteristics
The designed sparse array having 128 transmit and 128 transmit/receive elements produces the beamplots shown in Fig. 3. The dual-transducer system was constructed as in Fig. 6. On-axis Field II simulations showed –6-dB beam width of 2.1° and side lobe level of –22.9 dB at a depth of 7 cm. In comparison, the re-configured Volumetrics cardiac array (6.3 mm aperture) used previously [32] has a –6-dB beam width of 4.5° and side lobe level of –33.6 dB at 7 cm.
The fabricated probes used in testing and in vivo evaluation had element yields of 110/128 (86%) receivers and 220/256 transmitters (86%) and 109/128 (86%) receivers and 217/256 transmitters (85%).
C. Performance Testing Results
Mean center frequency was measured at 2.3 MHz with a fractional bandwidth of 20%. Insertion loss was measured at –80 dB. Crosstalk was measured at –30 dB and is primarily due to electrical crosstalk in the printed circuit board. This was evidenced by observation of the transmit pulse bleeding across to adjacent channels and an observed decrease in severity of crosstalk in channels which do not traverse the entire length of this board.
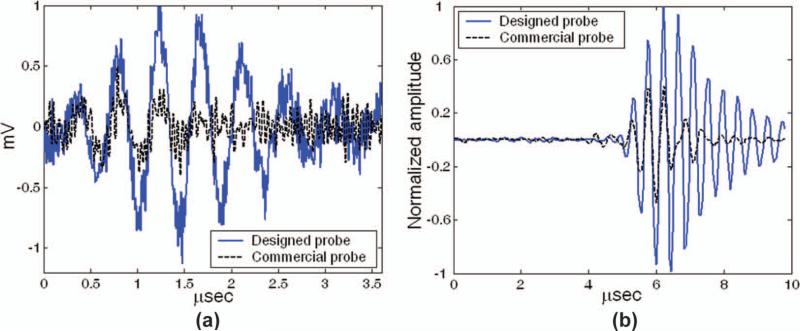
The measured gain in SNR was 6.8 dB in per-channel testing and 7.1 dB in beamformed testing, in close agreement with simulations. Typical results from these tests are shown in Figs. 7(a) (per channel) and 7(b) (beamformed). The average element-plus-cable capacitance of the probe on the 0.279 m flex circuit was 60 pF, compared with 156 pF for the probe with the 2.23-m cable.
Fig. 7.
(a) Single-element pulse echo-waveform from aluminum block reflector. (b) A 128-channel beamformed reflection from target at 7-cm focus. 
D. Validation of Registration Algorithm
Mean errors were: 2.43 mm in x, 3.52 mm in y, and 3.89 mm in z. Shekhar and Zagrodsky also report error in z that is approximately as large as in one lateral dimension [61]. Although registration error would ideally be smaller for clinical practice, these tests validate the suitability of the correlation coefficient as a metric and confirm the implementation of the algorithm. In vivo registered volumes are presented in Figs. 9–11.
Fig. 9.
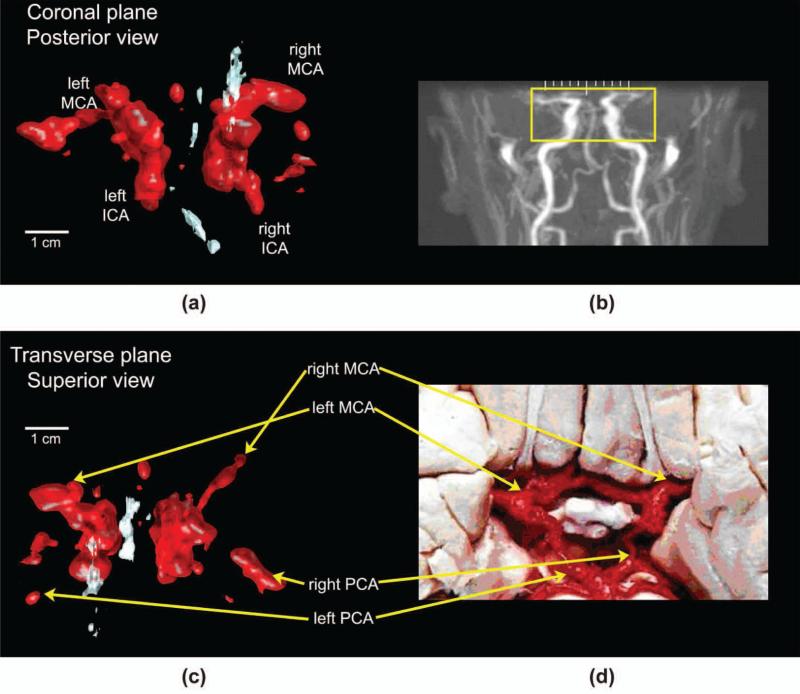
(a) Ultrasound rendering in the coronal plane and (b) representative magnetic resonance angiogram (MRA) (not the same subject) showing the area under ultrasound examination. (c) Paired ultrasound rendering in the transverse plane and (d) dissection image indicating anatomy in vessels of the Circle of Willis. ICA = internal carotid artery, MCA = middle cerebral artery, PCA = posterior cerebral artery. Original MRA image (b) produced by Ofir Glazer, Biomedical Engineering Department, Tel Aviv University, Israel. Reproduced with permission of the author. Original photograph (d) produced by Prof. John a. Beal, Department of Cellular Biology and Anatomy, Louisiana State Health Sciences Center, Shreveport, LA. Reproduced with permission of the author. 
Fig. 11.
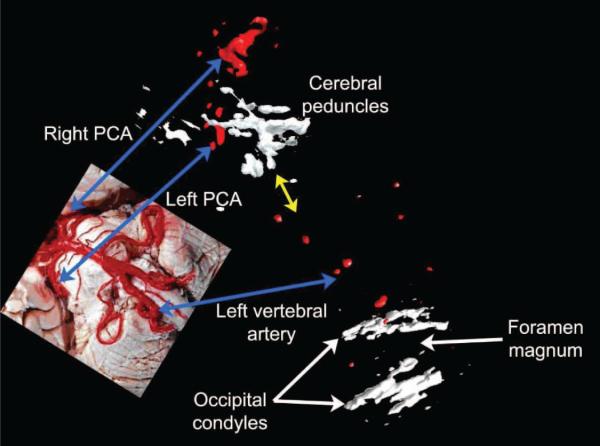
Automatically registered rendering of posterior cerebral arteries from simultaneous transtemporal scans along with manually registered (yellow arrow) transforaminal scan. Vessels are paired with a dissection image (inset), with blue arrows indicating common structures. No microbubble contrast agent was used. Dissection image reproduced with permission of the author, Prof. John A. Beal. 
E. Human Study
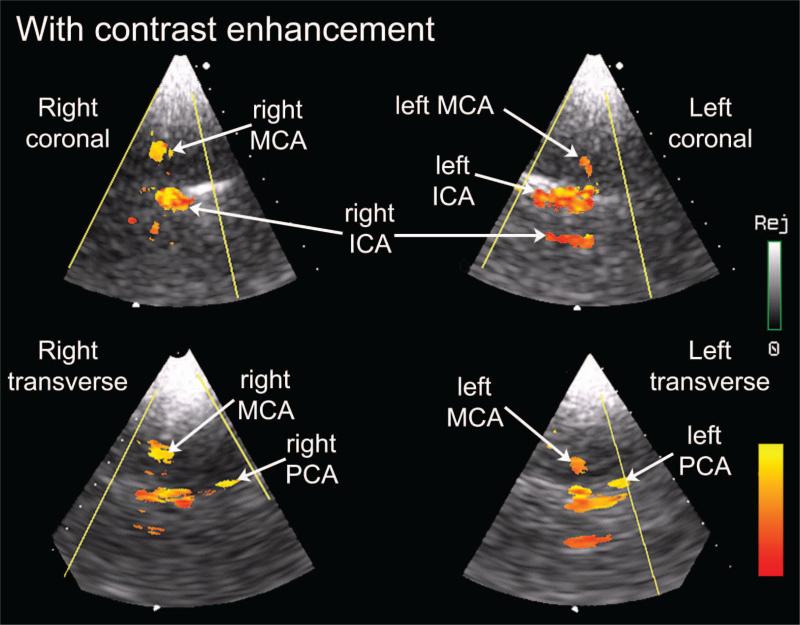
With contrast enhancement, cerebral blood flow was imaged in color Doppler mode in 4 of 4 subjects. We have successfully visualized flow without contrast agent in at least one cerebral artery in 4 of 6 volunteers. Without contrast agent, one or more internal carotid artery (ICA) was detected in 4 of 6 subjects, one or more middle cerebral artery (MCA) in 2 of 6 subjects, and one or more posterior cerebral artery (PCA) in 2 of 6 subjects. With contrast agent, one or more ICA was detected in 4 of 4, one or more MCA in 4 of 4, and one or more PCA in 4 of 4 subjects. In previous work, we had been unable to visualize 3-D color flow without contrast agent [11], [42]. Fig. 8 shows a labeled screen shot from the real-time display in one subject, a 24-year-old female.
Fig. 8.
Real-time display view of contrast-enhanced flow in middle cerebral arteries (MCA), internal carotid arteries (ICA), and posterior cerebral arteries (PCA) using described system. Directional information of flow has been discarded. Labels have been added to indicate anatomy as well as the sectors displaying the subject's right coronal, right transverse, left coronal, and left transverse imaging planes. 
From the same subject, we also present registered renderings of bilateral middle and posterior cerebral arteries in both the coronal [Fig. 9(a)] and transverse planes [Fig. 9(c)]. For these renderings, all Doppler data are shown in red and all echo data in white, with the echo data depicting midline structures such as the falx cerebri. The coronal view is paired with a typical (not the same subject) magnetic resonance angiogram [Fig. 9(b)] to indicate the field of view captured by the ultrasound rendering [Fig. 9(a)]. For the transverse view [Fig. 9(c)], common vessels are identified in an adjacent dissection image [Fig. 9(d)].
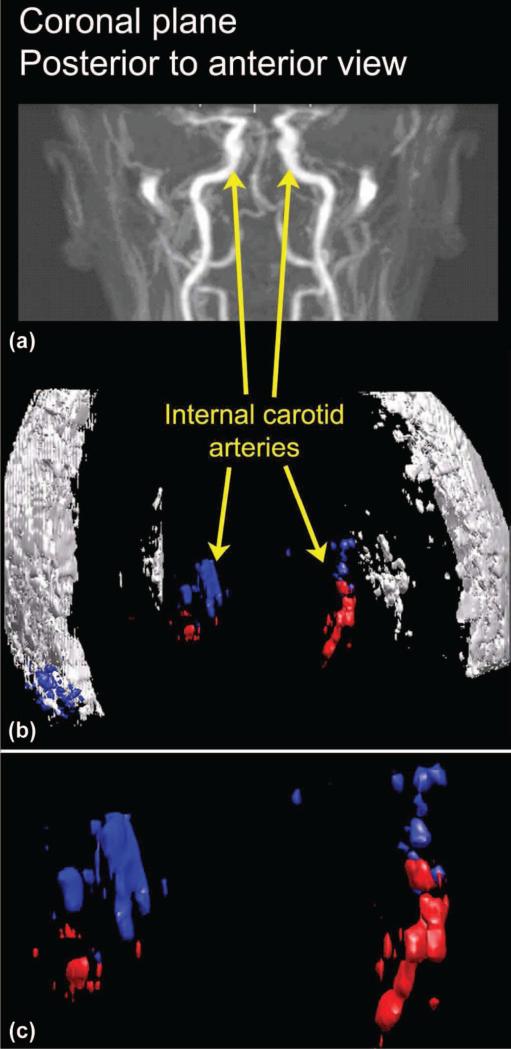
A successfully registered rendering without contrast enhancement is shown in Fig. 10 for a 42-year-old male. For the Doppler data, color (either red or blue) is used to indicate the acquiring transducer (left or right), whereas all echo data are shown in white. The rendered Doppler and echo data [Fig. 10(b)] is shown paired with a typical (not the same subject) magnetic resonance angiogram [Fig. 10(a)] to indicate anatomy. An enlarged view of the vessels, identified as bilateral internal carotid arteries, is also presented [Fig. 10(c)].
Fig. 10.
(a) The same magnetic resonance angiogram of Fig. 9 is used to indicate the field of view for the registered, (b) rendered ultrasound data acquired without microbubble contrast agent. (c) an enlargement of the color flow data. Blue indicates data acquired by the right transducer; red indicates data acquired by the left transducer. (a) is reproduced with permission of the author, Ofir Glazer, Department of Biomedical Engineering, Tel Aviv University, Israel. 
Finally, we present in Fig. 11 a volume rendering of three different views from a single subject using the probe positions proposed in Fig. 1 without contrast agent. First, two transtemporal volumes were acquired from this 42-year-old male subject, which were later registered using the described algorithm. In these volumes, both posterior cerebral arteries as well as midline structures were visible. Next, the subject was rotated to lie on his side and a single transforaminal volume was acquired using all of the image lines on a single transducer. The yellow arrow indicates the manual positioning of the transforaminal volume with respect to the other two volumes, as a vertebral artery rises toward posterior cerebral arteries. Integration in time of several volumes of pulsatile flow likely contributes to the bulbous appearance of vessels.
IV. Discussion
Several potential improvements in materials and fabrication have been illuminated by this process. Although the use of the multilayer flex circuit has reduced fabrication times and provided mechanical stability during imaging, the high εr of the polyimide substrate limits sensitivity. Bandwidth could also be improved through the use of one or more acoustic matching layers.
Our in vivo imaging experiences have led us to believe that it may be worthwhile to investigate the effects on image quality of increasing aperture size in conjunction with decreasing transmit frequency. The impact of aberration and frequency-dependent attenuation would be reduced in this scenario and might address a need for imaging a greater percentage of the population, because anywhere from 8% to 29% of individuals have temporal windows deemed insufficient for TCD or transcranial imaging [66]–[69]. The proposed modifications would also potentially improve the ability of personnel with limited training to acquire useful scans, because the importance of positioning the entire probe within the window would be diminished.
Although we are encouraged by the diagnostic potential of this still-experimental system, any future diagnostic value is dependent on the image quality of the two acquired volumes, the ability to display them simultaneously, and the ability to increase diagnostic information over that present in single-transducer scanning. These considerations will need to be evaluated in future work. Several additional improvements are necessary to extend the proof-of-concept prototype presented in this paper to the proposed three-transducer system capable of remotely transferring 3-D volumes, though all should be technically feasible on a portable scanner. Real-time phased array 3-D ultrasound is not yet available in a laptop scanner, although the GE Voluson i provides 3-D fetal scanning with a mechanically scanning 1-D array probe. Pre-processing and registration could be performed in the laptop, allowing a single fused data set to be sent over the Internet to a hospital.
Registration could be improved by using multiple iterations or increasing the number of transformation parameters. Optimization of registration using a cost function or a coarse-to-fine approach could improve runtimes and allow for multiple iterations. Graphics processing units (GPUs) have also been demonstrated in processing of 3-D ultra-sound data and could vastly improve runtimes for this application [70], [71]. In clinical scanning of a diseased individual, registration error could impose a limitation on the ability to detect abnormal flow, emphasizing the importance of reducing this error and further underscoring the significance of SNR. It is also worth noting that the aberrating and refractive properties of the skull differ on the two sides of the head, suggesting that non-rigid registration may eventually be necessary to account for the entrance angles at which the ultrasound beams enter the brain.
A third transducer could be added by splitting the channels even further, however image quality obviously suffers because of decreases in spatial sampling and in beamformed SNR with a reduced number of active elements per transducer. This problem might be addressed by multiplexing, although high-voltage switches typically carry high capacitances which would reverse most of the gains presented here. For example, the Supertex HV20220 (Supertex, Sunnyvale, CA) carries typical on and off shunt capacitances of 48 pF and 152 pF, respectively, for a 4:1 configuration. This dilemma underscores the importance of total interconnect design for 2-D arrays, taking into account the electrical characteristics of the transducer element, the cable, and the preamplifier or switching electronics [37], [38].
In combination, the proposed improvements might yield several additional decibels of SNR and further increase un-enhanced image quality. In this work, we have not used any of the many schemes for phase or amplitude correction [72], which could also contribute to the desired gains.
V. Conclusion
We have presented in vivo results from automated registration of two simultaneously-acquired transcranial volumes, the first known result of this kind. It is our belief that a system such as this—particularly when no contrast injection is required—shows significant potential for rapid cerebrovascular imaging of stroke and related conditions. Improvement of SNR from reduction in interconnect length has been demonstrated through simulation and experimental validation for a dual-transducer transcranial imaging system, where this improved sensitivity allowed real-time in vivo 3-D color flow imaging without microbubble contrast agent.
Acknowledgments
The authors wish to thank K. Strub and J. Toptine of the Duke Echo Lab and L. Boland of the Neurodiagnostic Lab for their assistance with the human study.
This work was supported by grants R01HL089507 and T32EB001040 from the NIH.
Biography
 Brooks D. Lindsey (S’10) was born in Liberty, MO, in 1984. In 2007, he received the B.S. degree in electrical engineering from the University of Illinois at Urbana-Champaign. He is currently pursuing a Ph.D. degree in biomedical engineering at Duke University, Durham, NC. His ultrasound research interests include array design, fabrication, and beamforming for diagnostic imaging.
 Edward D. Light (M’00) was born in Charlottesville, VA, in 1967. He received the B.S.E. and M.S. degrees in biomedical engineering from Duke University, Durham, NC, in 1989 and 1997, respectively. Since 1989, he has worked as an R&D Engineer at Duke, developing 2-D arrays for real-time volumetric imaging. He holds several patents in the field of catheter-based ultrasound imaging. He is currently pursuing his research interests in novel applications of 2-D arrays to the areas of catheter-based and endoscopic-based ultrasound imaging.
Heather A. Nicoletto received the B.S. degree in vascular technology in 2000 from the Oregon Institute of Technology, Klamath Falls, OR, and is a registered vascular technologist with the American Registry for Diagnostic Medical Sonography. From 2000 to 2005, she worked as a cerebrovascular technologist at Harborview Medical Center, Seattle, WA, including as lead cerebrovascular technologist from 2004 to 2005. Since 2005, she has been with the Neurodiagnostic Lab at Duke University Medical Center and is currently manager of the Neurovascular Lab.
 Ellen R. Bennett received the B.S. and Ph.D. degrees in microbiology and immunology from McGill University, Montreal, Canada, in 1984 and 1991, respectively. From 1990 to 1993, she was a postdoctoral fellow at the University of North Carolina, Chapel Hill. She has been with Duke University Medical Center since 1994 and is currently an assistant professor in the Division of Neurology, Department of Medicine. Her research interests include genetic influences in predicting outcome following brain injury.
 Daniel T. Laskowitz received the M.D. degree from Duke University in 1991. He completed postgraduate training in neurology at the Hospital of the University of Pennsylvania (1991 to 1995) and in cerebrovascular disease and neurocritical care at Duke University Medical Center (1995 to 1997). He is currently an associate professor of medicine in the division of neurology at Duke University School of Medicine. He also holds appointments in anesthesiology and neurobiology. His clinical and research interests include stroke and central nervous system response to acute injury.
 Stephen W. Smith (M’91) was born in Covington, KY, on July 27, 1947. He received the B.A. degree in physics (summa cum laude) in 1967 from Thomas More College, Ft. Mitchell, KY; the M.S. degree in physics in 1969 from Iowa State University, Ames; and the Ph.D. degree in biomedical engineering in 1975 from Duke University, Durham, NC.
In 1969, he became a Commissioned Officer in the U.S. Public Health Service, assigned to the Food and Drug Administration, Center for Devices and Radiological Health, Rockville, MD, where he worked until 1990 in the study of medical imaging, particularly diagnostic ultrasound and in the development of performance standards for such equipment. In 1978, he became an adjunct associate professor of radiology at Duke University Medical Center. In 1990, he became an associate professor of biomedical engineering and radiology, and Director of Undergraduate Studies in Biomedical Engineering at Duke University. He holds 16 patents in medical ultrasound and has authored more than 100 publications in the field.
Dr. Smith is cofounder of Volumetrics Medical Imaging. He has served on the education committee of the American Institute of Ultrasound in Medicine, the executive board of the American Registry of Diagnostic Medical Sonographers, the editorial board of Ultrasonic Imaging, and the Technical Program Committee of IEEE-UFFC. He was co-recipient of the American Institute of Ultrasound in Medicine Matzuk Award in 1988 and 1990 and co-recipient of the IEEE-UFFC Outstanding Paper Award in 1983 and 1994.
Contributor Information
Brooks D. Lindsey, Department of Biomedical Engineering, Duke University, Durham, NC (bdl14@duke.edu)..
Edward D. Light, Department of Biomedical Engineering, Duke University, Durham, NC..
Heather A. Nicoletto, Division of Neurology, Duke University Medical Center, Durham, NC.
Ellen R. Bennett, Division of Neurology, Duke University Medical Center, Durham, NC.
Daniel T. Laskowitz, Division of Neurology, Duke University Medical Center, Durham, NC.
Stephen W. Smith, Department of Biomedical Engineering, Duke University, Durham, NC..
References
- 1.Carandang R, Seshadri S, Beiser A, Kelly-Hayes M, Kase CS, Kannel WB, Wolf PA. Trends in incidence, lifetime risk, severity, and 30-day mortality of stroke over the past 50 years. JAMA. 2006;29627:2939–2946. doi: 10.1001/jama.296.24.2939. Dec. [DOI] [PubMed] [Google Scholar]
- 2.World Health Organization The top 10 causes of death: Fact sheet no. 310. 2008.
- 3.Del Zoppo GJ, Saver JL, Jauch EC, Adams HP., Jr Expansion of the time window for treatment of acute ischemic stroke with intravenous tissue plasminogen activator: A science advisory from the American Heart Association/American Stroke Association. Stroke. 2009 Aug.40:2945–2948. doi: 10.1161/STROKEAHA.109.192535. [DOI] [PMC free article] [PubMed] [Google Scholar]
- 4.Hacke W, Kaste M, Fieschi C, Toni D, Lesaffre E, von Kummer R, Boysen G, Bluhmki E, Hoxter G, Mahagne MH, Hennerici M. ECASS Study Group, “Intravenous thrombolysis with recombinant tissue plasminogen activator for acute hemispheric stroke. The European Cooperative Acute Stroke Study (ECASS) JAMA. 1995 Oct.2744:1017–1025. [PubMed] [Google Scholar]
- 5.Holscher T, Schlachetzki F, Zimmermann M, Jakob W, Ittner KP, Haslberger J, Bogdahn U, Boy S. Transcranial ultrasound from diagnosis to early stroke treatment. 1. Feasibility of prehospital cerebrovascular assessment. Cerebrovasc. Dis. 2008;26(6):659–663. doi: 10.1159/000166844. [DOI] [PubMed] [Google Scholar]
- 6.Hoyer HX, Vogl S, Schiemann U, Haug A, Stolpe E, Michalski T. Prehospital ultrasound in emergency medicine: Incidence, feasibility, indications and diagnoses. Eur. J. Emerg. Med. 2010 Oct.17:254–259. doi: 10.1097/MEJ.0b013e328336ae9e. [DOI] [PubMed] [Google Scholar]
- 7.Bowman J. Ultrasound applications in EMS. J. Emerg. Med. Serv. JEMS. 2010 Sep.35:36–47. [Google Scholar]
- 8.Miyazaki M, Kato K. Measurement of cerebral blood flow by ultrasonic Doppler technique. Jpn. Circ. J. 1965 Apr.29:375–382. doi: 10.1253/jcj.29.375. [DOI] [PubMed] [Google Scholar]
- 9.Hacke W, Kaste M, Bluhmki E, Brozman M, Davalos A, Guidetti D, Larrue V, Lees KR, Medeghri Z, Machnig T, Schneider D, von Kummer R, Wahlgren N, Toni D. Thrombolysis with alteplase 3 to 4.5 hours after acute ischemic stroke. N. Engl. J. Med. 2008 Sep. 25359:1317–1329. doi: 10.1056/NEJMoa0804656. [DOI] [PubMed] [Google Scholar]
- 10.Valdueza JM, Schreiber SJ, Roehl J-E, Klingebiel R. Neurosonology and Neuroimaging of Stroke. Thieme; New York: 2008. [Google Scholar]
- 11.Smith SW, Chu K, Idriss SF, Ivancevich NM, Light ED, Wolf PD. Feasibility study: Real-time 3-D ultrasound imaging of the brain. Ultrasound Med. Biol. 2004 Oct.30:1365–1371. doi: 10.1016/j.ultrasmedbio.2004.08.012. [DOI] [PubMed] [Google Scholar]
- 12.Aaslid R, Markwalder TM, Nornes H. Noninvasive transcranial Doppler ultrasound recording of flow velocity in basal cerebral arteries. J. Neurosurg. 1982 Dec.57:769–774. doi: 10.3171/jns.1982.57.6.0769. [DOI] [PubMed] [Google Scholar]
- 13.Furuhata H. Historical development of transcranial-color tomography. In: Bogdahn U, Becker G, Schlachetzki F, editors. Echoenhancers and Transcranial Color Duplex Sonography. Blackwell Science; Berlin, Germany: 1998. pp. 3–15. [Google Scholar]
- 14.White DN, Stevenson RJ. The acoustic characteristics of the skull. Ultrasound Med. Biol. 1978;4(3):225–252. doi: 10.1016/0301-5629(78)90054-6. [DOI] [PubMed] [Google Scholar]
- 15.Pinton GF, Aubry JF, Tanter M, Fink M. IEEE Ultrasonics Symp. Rome, Italy: 2009. Effects of nonlinearity on propagation through the skull; pp. 389–392. [Google Scholar]
- 16.Pinton GF, Pernot M, Bossy E, Aubry JF, Muller M, Tanter M. IEEE Ultrasonics Symp. San Diego, CA: 2010. Mechanisms of attenuation and heating dissipation of ultrasound in the skull bone: Comparison between simulation models and experiments. to be published. [Google Scholar]
- 17.Flax SW, O'Donnell M. Phase-aberration correction using signals from point reflectors and diffuse scatterers—Basic principles. IEEE Trans. Ultrason. Ferroelectr. Freq. Control. 1988;35(6):758–767. doi: 10.1109/58.9333. [DOI] [PubMed] [Google Scholar]
- 18.Liu DL, Waag RC. Time-shift compensation of ultrasonic pulse focus degradation using least-mean-square error estimates of arrival time. J. Acoust. Soc. Am. 1994 Jan.95:542–555. doi: 10.1121/1.408348. [DOI] [PubMed] [Google Scholar]
- 19.Gauss R, Trahey GE, Soo MS. Wavefront estimation in the human breast. Proc. SPIE. 2001:172–181. [Google Scholar]
- 20.Ivancevich NM, Pinton GF, Nicoletto HA, Bennett E, Laskowitz DT, Smith SW. Real-time 3D contrast-enhanced transcranial ultrasound and aberration correction. Ultrasound Med. Biol. 2008;34:1387–1395. doi: 10.1016/j.ultrasmedbio.2008.01.015. [DOI] [PMC free article] [PubMed] [Google Scholar]
- 21.Ivancevich NM, Dahl JJ, Smith SW. Comparison of 3-D multi-lag cross- correlation and speckle brightness aberration correction algorithms on static and moving targets. IEEE Trans. Ultrason. Ferroelectr. Freq. Control. 2009 Oct.56:2157–2166. doi: 10.1109/TUFFC.2009.1298. [DOI] [PMC free article] [PubMed] [Google Scholar]
- 22.Fink M. Time reversal of ultrasonic fields. I. Basic principles. IEEE Trans. Ultrason. Ferroelectr. Freq. Control. 1992;39(5):555–566. doi: 10.1109/58.156174. [DOI] [PubMed] [Google Scholar]
- 23.Pernot M, Montaldo G, Tanter M, Fink M. “Ultrasonic stars” for time-reversal focusing using induced cavitation bubbles. Appl. Phys. Lett. 2006;88(3):1–3. [Google Scholar]
- 24.Haworth KJ, Fowlkes JB, Carson PL, Kripfgans OD. Towards aberration correction of transcranial ultrasound using acoustic droplet vaporization. Ultrasound Med. Biol. 2008 Mar.34:435–445. doi: 10.1016/j.ultrasmedbio.2007.08.004. [DOI] [PMC free article] [PubMed] [Google Scholar]
- 25.Gateau J, Marsac L, Pernot M, Aubry JF, Tanter M, Fink M. Transcranial ultrasonic therapy based on time reversal of acoustically induced cavitation bubble signature. IEEE Trans. Biomed. Eng. 2009 Jan.57:134–144. doi: 10.1109/TBME.2009.2031816. [DOI] [PMC free article] [PubMed] [Google Scholar]
- 26.Clement GT, Hynynen K. A non-invasive method for focusing ultrasound through the human skull. Phys. Med. Biol. 2002 Apr. 2147:1219–1236. doi: 10.1088/0031-9155/47/8/301. [DOI] [PubMed] [Google Scholar]
- 27.Aubry JF, Tanter M, Pernot M, Thomas JL, Fink M. Experimental demonstration of noninvasive transskull adaptive focusing based on prior computed tomography scans. J. Acoust. Soc. Am. 2003 Jan.113:84–93. doi: 10.1121/1.1529663. [DOI] [PubMed] [Google Scholar]
- 28.Clement GT, White PJ, Hynynen K. Enhanced ultrasound transmission through the human skull using shear mode conversion. J. Acoust. Soc. Am. 2004 Mar.115:1356–1364. doi: 10.1121/1.1645610. [DOI] [PubMed] [Google Scholar]
- 29.Yousefi A, Goertz DE, Hynynen K. Transcranial shear-mode ultrasound: Assessment of imaging performance and excitation techniques. IEEE Trans. Med. Imaging. 2009 May;28:763–774. doi: 10.1109/TMI.2008.2012017. [DOI] [PubMed] [Google Scholar]
- 30.Miller-Jones SM. Ph.D. dissertation. Dept. of Biomedical Engineering, Duke University; Durham, NC: 1980. Automated arrival time correction for ultrasonic cephalic imaging. [Google Scholar]
- 31.Vignon F, Aubry JF, Tanter M, Margoum A, Fink M. Adaptive focusing for transcranial ultrasound imaging using dual arrays. J. Acoust. Soc. Am. 2006;120(5)(pt. 1):2737–2745. doi: 10.1121/1.2354073. [DOI] [PubMed] [Google Scholar]
- 32.Smith SW, Ivancevich NM, Lindsey BD, Whitman JJ, Light ED, Fronheiser MP, Nicoletto HA, Laskowitz DT. The ultrasound brain helmet: Feasibility study of multiple simultaneous 3D scans of cerebral vasculature. Ultrasound Med. Biol. 2009;35(2):329–338. doi: 10.1016/j.ultrasmedbio.2008.08.016. [DOI] [PubMed] [Google Scholar]
- 33.Bamber JC. Ultrasonic properties of tissues. In: Duck FA, Baker AC, Starritt HC, editors. Ultrasound in Medicine. Inst. of Physics Pub.; Bristol, England: 1998. pp. 57–88. [Google Scholar]
- 34.Kenton AR, Martin PJ, Abbott RJ, Moody AR. Comparison of transcranial color-coded sonography and magnetic resonance angiography in acute stroke. Stroke. 1997 Aug.28:1601–1606. doi: 10.1161/01.str.28.8.1601. [DOI] [PubMed] [Google Scholar]
- 35.Smith SW, Pavy HG, von Ramm OT. High speed ultrasound volumetric imaging system. Part I: Transducer design and beam steering. IEEE Trans. Ultrason. Ferroelectr. Freq. Control. 1991;38(2):100–108. doi: 10.1109/58.68466. [DOI] [PubMed] [Google Scholar]
- 36.von Ramm OT, Smith SW, Pavy HG. High speed ultrasound volumetric imaging system. Part II: Parallel processing and display. IEEE Trans. Ultrason. Ferroelectr. Freq. Control. 1991;38(2):109–115. doi: 10.1109/58.68467. [DOI] [PubMed] [Google Scholar]
- 37.Lu XM. IEEE Ultrasonics Symp. Beijing, China: 2008. Comprehensive design considerations for 2D matrix arrays; pp. 1134–1137. [Google Scholar]
- 38.Oakley CG. Calculation of ultrasonic transducer signal-to-noise ratios using the KLM model. IEEE Trans. Ultrason. Ferroelectr. Freq. Control. 1997;44(5):1018–1026. [Google Scholar]
- 39.Krimholtz R, Leedom DA, Matthaei GL. New equivalent circuits for elementary piezoelectric transducers. Electron. Lett. 1970;6(13):398–399. [Google Scholar]
- 40.Light ED, Davidsen RE, Fiering JO, Hruschka TA, Smith SW. Progress in two-dimensional arrays for real-time volumetric imaging. Ultrason. Imaging. 1998;20(1):1–15. doi: 10.1177/016173469802000101. [DOI] [PubMed] [Google Scholar]
- 41.Davidsen RE, Smith SW. Two-dimensional arrays for medical ultrasound using multilayer flexible circuit interconnection. IEEE Trans. Ultrason. Ferroelectr. Freq. Control. 1998;45(2):338–348. doi: 10.1109/58.660144. [DOI] [PubMed] [Google Scholar]
- 42.Lindsey BD, Ivancevich NM, Light ED, Smith SW, Nicoletto HA, Bennett E, Laskowitz DT. IEEE UlTrasonics Symp. Rome, Italy: 2009. The ultrasound brain helmet for 3D transcranial Doppler imaging; pp. 1395–1398. [Google Scholar]
- 43.Griffith J, Lebender R. IEEE Ultrasonics Symp. Lake Tahoe, NV: 1999. Electrical characteristics of ribbon-based probe cables; pp. 1085–1090. [Google Scholar]
- 44.Bogdahn U, Becker G, Schlachetzki F. Echoenhancers and Transcranial Color Duplex Sonography. Blackwell Science; Boston, MA: 1998. [Google Scholar]
- 45.Vignon F, Shi WT, Erkamp R, Radulescu E, Shamdasani V, Powers JE. IEEE Ultrasonics Symp. Rome, Italy: 2009. Mapping skull attenuation for optimal probe placement in transcranial ultrasound applications; pp. 2336–2339. [Google Scholar]
- 46.Lockwood GR, Foster SF. Optimizing the radiation pattern of sparse periodic two-dimensional arrays. IEEE Trans. Ultrason. Ferroelectr. Freq. Control. 1996;43(1):15–19. [Google Scholar]
- 47.Ullate LG, Godoy G, Martinez O, Sanchez T. Beam steering with segmented annular arrays. IEEE Trans. Ultrason. Ferroelectr. Freq. Control. 2006 Oct.53:1944–1954. [PubMed] [Google Scholar]
- 48.Jensen JA, Svendsen NB. Calculation of pressure fields from arbitrarily shaped, apodized, and excited ultrasound transducers. IEEE Trans. Ultrason. Ferroelectr. Freq. Control. 1992;39(2):262–267. doi: 10.1109/58.139123. [DOI] [PubMed] [Google Scholar]
- 49.Sakas G, Walter S. Extracting surfaces from fuzzy 3D-ultrasound data. INt. Conf. Computer Graphics and Interactive Techniques. 1995:465–474. [Google Scholar]
- 50.Rohling RN, Gee AH, Berman L. Automatic registration of 3-D ultrasound images. Ultrasound Med. Biol. 1998;24(6):841–854. doi: 10.1016/s0301-5629(97)00210-x. [DOI] [PubMed] [Google Scholar]
- 51.Pennec X, Cachier P, Ayache N. Tracking brain deformations in time sequences of 3D US images. Pattern Recognit. Lett. 2002;24:801–813. [Google Scholar]
- 52.Letteboer MMJ, Viergever MA, Niessen WJ. Computer Assisted Radiology and Surgery. London, UK: 2003. Rigid registration of 3D ultrasound data of brain tumors; pp. 433–439. [Google Scholar]
- 53.Comeau RM, Sadikot AF, Fenster A, Peters TM. Intraoperative ultrasound for guidance and tissue shift correction in image-guided neurosurgery. Med. Phys. 2000 Apr.27:787–800. doi: 10.1118/1.598942. [DOI] [PubMed] [Google Scholar]
- 54.Porter BC, Rubens DJ, Strang JG, Smith J, Totterman S, Parker KJ. Three-dimensional registration and fusion of ultrasound and MRI using major vessels as fiducial markers. IEEE Trans. Med. Imaging. 2001 Apr.20:354–359. doi: 10.1109/42.921484. [DOI] [PubMed] [Google Scholar]
- 55.Slomka P, Mandel J, Downey D, Fenster A. Evaluation of voxel-based registration of 3-D power Doppler and 3-D magnetic resonance angiographic images of carotid arteries. Ultrasound Med. Biol. 2001;27(7):945–955. doi: 10.1016/s0301-5629(01)00387-8. [DOI] [PubMed] [Google Scholar]
- 56.Meyer CR, Boes JL, Kim B, Bland PH, Zasadny KR, Kison PV, Koral K, Frey KA, Wahl RL. Demonstration of accuracy and clinical versatility of mutual information for automatic multimodality image fusion using affine and thin-plate spline warped geometric deformations. Med. Image Anal. 1997 Apr.1:195–206. doi: 10.1016/s1361-8415(97)85010-4. [DOI] [PubMed] [Google Scholar]
- 57.Krucker JF, Lecarpentier GL, Fowlkes JB, Carson PL. Rapid elastic image registration for 3-D ultrasound. IEEE Trans. Med. Imaging. 2002 Nov.21:1384–1394. doi: 10.1109/TMI.2002.806424. [DOI] [PubMed] [Google Scholar]
- 58.Grau V, Becher H, Noble JA. Registration of multiview real-time 3-D echocardiographic sequences. IEEE Trans. Med. Imaging. 2007 Sep.26:1154–1165. doi: 10.1109/TMI.2007.903568. [DOI] [PubMed] [Google Scholar]
- 59.Felsberg M, Sommer G. The monogenic signal. IEEE Trans. Signal Process. 2001;49(12):3136–3144. [Google Scholar]
- 60.Meyer CR, Boes JL, Kim B, Bland PH, Lecarpentier GL, Fowlkes JB, Roubidoux MA, Carson PL. Semiautomatic registration of volumetric ultrasound scans. Ultrasound Med. Biol. 1999 Mar.25:339–347. doi: 10.1016/s0301-5629(98)00148-3. [DOI] [PubMed] [Google Scholar]
- 61.Shekhar R, Zagrodsky V. Mutual information-based rigid and nonrigid registration of ultrasound volumes. IEEE Trans. Med. Imaging. 2002 Jan.21:9–22. doi: 10.1109/42.981230. [DOI] [PubMed] [Google Scholar]
- 62.Bohs LN, Trahey GE. A novel method for angle independent ultrasonic imaging of blood flow and tissue motion. IEEE Trans. Biomed. Eng. 1991 Mar.38:280–286. doi: 10.1109/10.133210. [DOI] [PubMed] [Google Scholar]
- 63.Bohs LN, Friemel BH, Mcdermott BA, Trahey GE. A real time system for quantifying and displaying two-dimensional velocities using ultrasound. Ultrasound Med. Biol. 1993;19(9):751–761. doi: 10.1016/0301-5629(93)90092-3. [DOI] [PubMed] [Google Scholar]
- 64.Noble JA, Boukerroui D. Ultrasound image segmentation: A survey. IEEE Trans. Med. Imaging. 2006 Aug.25:987–1010. doi: 10.1109/tmi.2006.877092. [DOI] [PubMed] [Google Scholar]
- 65.Slabaugh G, Unal G, Wels M, Fang T, Rao B. Statistical region-based segmentation of ultrasound images. Ultrasound Med. Biol. 2009;35(5):781–795. doi: 10.1016/j.ultrasmedbio.2008.10.014. [DOI] [PubMed] [Google Scholar]
- 66.Hashimoto H, Etani H, Naka M, Kinoshita N, Nukada T. [Assessment of the rate of successful transcranial Doppler recording through the temporal windows in Japanese with special reference to aging and sex] Nippon Ronen Igakkai Zasshi. 1992 Feb.29:119–122. doi: 10.3143/geriatrics.29.119. (in Japanese) [DOI] [PubMed] [Google Scholar]
- 67.Marinoni M, Ginanneschi A, Forleo P, Amaducci L. Technical limits in transcranial Doppler recording: Inadequate acoustic windows. Ultrasound Med. Biol. 1997;23(8):1275–1277. doi: 10.1016/s0301-5629(97)00077-x. [DOI] [PubMed] [Google Scholar]
- 68.Baumgartner RW, Arnold M, Gonner F, Staikow I, Herrmann C, Rivoir A, Muri RM. Contrast-enhanced transcranial color-coded duplex sonography in ischemic cerebrovascular disease. Stroke. 1997 Dec.28:2473–2478. doi: 10.1161/01.str.28.12.2473. [DOI] [PubMed] [Google Scholar]
- 69.Gahn G, Gerber J, Hallmeyer S, Hahn G, Ackerman RH, Reichmann H, von Kummer R. Contrast-enhanced transcranial color-coded duplex sonography in stroke patients with limited bone windows. AJNR Am. J. Neuroradiol. 2000 Mar.21:509–514. [PMC free article] [PubMed] [Google Scholar]
- 70.Zhang Q, Huang X, Eagleson R, Guiraudon G, Peters TM. Proc. SPIE Medical Imaging. San Diego, CA: 2007. 2007. Real-time dynamic display of registered 4D cardiac MR and ultrasound images using a GPU. art. no. 65092d. [Google Scholar]
- 71.Kuo J, Bredthauer GR, Castellucci JB, von Ramm OT. Interactive volume rendering of real-time three-dimensional ultrasound images. IEEE Trans. Ultrason. Ferroelectr. Freq. Control. 2007 Feb.54:313–318. doi: 10.1109/tuffc.2007.245. [DOI] [PubMed] [Google Scholar]
- 72.Tanter M, Thomas JL, Fink M. Focusing and steering through absorbing and aberrating layers: Application to ultrasonic propagation through the skull. J. Acoust. Soc. Am. 1998 May;103:2403–2410. doi: 10.1121/1.422759. [DOI] [PubMed] [Google Scholar]


