

Abstract
Recently, certain C-terminal fragments (CTFs) of Aβ42 have been shown to be effective inhibitors of Aβ42 toxicity. Here, we examine the interactions between the shortest CTF in the original series, Aβ(39–42) and full-length Aβ. Mass spectrometry results indicate that Aβ(39–42) binds directly to Aβ monomers and to the n=2,4, and 6 oligomers. The Aβ42:Aβ(39–42) complex is further probed using in molecular dynamics simulations. Although the CTF was expected to bind to the hydrophobic C-terminus of Aβ42, the simulations show that Aβ(39–42) binds at several locations on Aβ42, including the C-terminus, other hydrophobic regions, and preferentially in the N-terminus. Ion mobility-mass spectrometry (IM-MS) and electron microscopy experiments indicate that Aβ(39–42) disrupts the early assembly of full-length Aβ. Specifically, the ion-mobility results show that Aβ(39–42) prevents the formation of large decamer/dodecamer Aβ42 species and, moreover, can remove these structures from solution. At the same time, thioflavin T fluorescence and electron microscopy results show that the CTF does not inhibit fibril formation, lending strong support to the hypothesis that oligomers and not amyloid fibrils are the Aβ form responsible for toxicity. The results emphasize the role of small, soluble assemblies in Aβ-induced toxicity and suggest that Aβ(39–42) inhibits Aβ-induced toxicity by a unique mechanism, modulating early assembly into non-toxic heterooligomers, without preventing fibril formation.
Keywords: Alzheimer's Disease, Amyloid, Ion Mobility, Molecular Dynamics
Numerous studies have shown that amyloid β-protein (Aβ) plays a significant etiologic role in Alzheimer's disease (AD)(1). Aβ forms by proteolytic cleavage of the amyloid β-protein precursor and exists in vivo primarily as 40- or 42-residue peptides (Aβ40 and Aβ42, respectively). Both species aggregate and are neurotoxic, yet Aβ42 fibrillizes faster, forms distinct oligomers(2–4), and is significantly more toxic than Aβ40(5). These differences are attributed to the presence of two additional hydrophobic residues, Ile41 and Ala42, in the C-terminus of Aβ42:
DAEFRHDSGY10EVHHQKLVFF20AEDVGSNKGA30IIGLMVGGVV40IA
The presence of these two amino acids renders the C-terminus of Aβ42 more rigid and structured(6–8).
As reported previously(9), several C-terminal fragments (CTFs) of Aβ42 were investigated for their potential to disrupt important interactions controlling Aβ42 oligomerization and thereby inhibit Aβ42-induced toxicity. CTFs ranging from Aβ(29–42) to Aβ(39–42) were found to inhibit Aβ42-induced neurotoxicity with different potencies. Interestingly, the smallest CTF in this series, Aβ(39–42), was particularly effective, inhibiting Aβ42-induced cell death and rescuing disruption of synaptic activity by Aβ42 at low micromolar concentration. This inhibition was found to correlate with stabilization of Aβ42:Aβ(39–42) heterooligomers with hydrodynamic radii (RH) of 6±3 and 30±10 nm, determined by dynamic light scattering (DLS). These two oligomer population were smaller than those formed in the absence of the CTF (RH = 10±2 and 40±20 nm). In addition, growth of these oligomer populations and formation of large aggregates, measured as intensity spikes in DLS experiments, were attenuated by Aβ(39–42)(9–10). The results suggested that Aβ(39–42) acted as an inhibitor by coassembling with Aβ42, stabilizing non-toxic oligomers, and decreasing Aβ interaction with its cellular targets(10–11). Further intrinsic fluorescence investigation suggested that the interaction of Aβ(39–42) with Aβ42 was not limited to the C-terminus, as previously thought(12). In addition, discrete molecular dynamic simulations suggested that multiple Aβ(39–42) peptides bound to Aβ42(9, 11), though direct evidence for this mechanism has been difficult to obtain due to the limitations of conventional experimental techniques, such as X-ray crystallography and solution-state NMR.
Here, ion-mobility-based mass spectrometry(13) (IM-MS) and all-atom molecular dynamics (MD) simulations are used to investigate the interactions between full-length Aβ and Aβ(39–42). This combined approach already has been successfully employed to study Aβ and several other aggregating peptides and proteins(2, 14–18), and is used here to study the interaction of Aβ(39–42) with both Aβ40 and Aβ42. To explore the relationship between modulation of early oligomerization and later aggregation of Aβ in the presence of Aβ(39–42), IM-MS is used in conjunction with thioflavin T (ThT) fluorescence and electron microscopy (EM) measurements. Our results indicate that Aβ(39–42) disrupts Aβ oligomerization but not fibril formation.
Methods
Peptides and Sample Preparation
Full-length Aβ40 and Aβ42, and Aβ(39–42) were synthesized by N-(9-fluorenyl)methoxycarbonyl chemistry(9). The samples were purified by reverse-phase HPLC and their integrity validated by mass spectrometry and amino acid analysis.
Ion Mobility-Mass Spectrometry Measurements
Lyophilized peptides were dissolved in 10 mM ammonium acetate, pH 7.4. Aβ40 and Aβ42 concentrations were kept at 20 μM for all experiments. Mass Spectra were recorded using an in-house built instrument(19), in which ions are generated continuously by a nanoelectrospray ionization source, guided through an ion funnel, pass through a 5-cm temperature-controlled drift cell filled with ~5 Torr He, are mass-selected by a quadrupole mass filter, and are detected.
For ion-mobility measurements, ions are stored in the ion funnel and pulsed into the drift cell. The injection energy of the ions can be varied from ~20 to ~150 eV. At low injection energies, the ions are rapidly thermalized by collisions with the He buffer gas in the cell. At high injection voltages, the ions initially are collisionally excited which can lead to either annealing or dissociation of large, non-covalent complexes. A full description of this process is given elsewhere13. The analyte passes through the cell under the influence of a weak electric field. The velocity of the ions in the drift cell, vD is determined by equilibration of the force of the electric field and the frictional drag of the collisions with He. The velocity is proportional to the electric field, E with the proportionality constant, K, termed the ion mobility:
| (1) |
After exiting the drift cell, the ions are mass-selected and continue to the detector, where their arrival times are recorded. The ion mobility is related to the ion–He collision cross-section σ, which in turn can be related to the ion's arrival time, tA, at the detector (20):
| (2) |
Here, q is the ion charge, kB is the Boltzman constant, T is the temperature, μ is the reduced mass of the ion–He collision, N is the He number density at STP, l is the drift cell length (4.503 cm), and t0 is the time the ion spends outside of the drift cell. All of these quantities are either known constants or are measured for each experiment so that σ can be determined.
Molecular Dynamics Simulations
System preparation
Our two binding simulation systems contained one Aβ peptide (Aβ42 or Aβ40), one Aβ(39–42) peptide, ~7000 water molecules, and three Na+ ions to neutralize the system. The initial structures of three uncapped peptides were the most abundant ones from the previous study by Garcia and coworkers(21) for Aβ42 and Aβ40, and from our own previous study(22) for Aβ(39–42) (Figure S5 of the supporting material). Aβ(39–42) was initially placed ~15 Å away from the Aβ surface. The solute was immersed in a truncated octahedral box (a = b = c = ~69 Ǻ, α = β = γ = 109.47°) filled with water molecules. The solute was at least ~9 Å away from the water box surface and thus the minimum distance between the solute and its image under periodic conditions is ~18 Å.
The Duan et al. all-atom point-charge force field (AMBER ff03)(23) was used to represent the peptides. This force field has been successfully used to model the binding of zinc to Aβ(24), Aβ protofibrils(25), the binding between Aβ protofibrils(26), and the binding of fluorescent dyes to Aβ protofibrils(27). The water solvent was explicitly represented by the TIP3P(28) model. In order to validate our choice of force field, we have carried out an additional MD simulation of Aβ42 only using the same protocol as our binding simulations for comparison with the NMR data (Figure S6). The calculated J-coupling data show a moderate agreement with the experimental data, which is comparable to the performance by the OPLS force field, the best one among others (AMBER ff94, ff96, GROMOS) examined by Sgourakis et al(21). In addition, strong propensity to form helical structure was not observed. This is consistent with the recent study(29) that shows that both AMBER ff03 and ff99SB offer significant improvements in the balance between helix and β-sheet, compared to early versions (ff94, ff96 and ff99).
Binding Simulations
The AMBER 9 simulation suite(30) was used in molecular dynamics simulations and data analysis. Periodic boundary conditions were imposed on the system by imaging and discrete Fourier transform used in the Particle Mesh Ewald method(31). After an initial energy minimization, a total of eight simulations (four runs for each system) were performed with different initial random velocities. The random velocities of atoms were generated according to the Maxwell-Boltzmann distribution at 500 K. A 10 ps run at 500 K was used to randomize the orientations and positions of the two peptides. The production run (150 ns) was at 310 K, including a short, 1-ns molecular dynamics in the NPT ensemble mode (constant pressure and temperature) to equilibrate the solvent and 149-ns dynamics in the NVT ensemble mode (constant volume and temperature). The Particle Mesh Ewald method(31) was used to treat the long-range electrostatic interactions. SHAKE(32) was applied to constrain all bonds connecting hydrogen atoms, enabling a 2-fs time step used in the dynamics. To reduce computation time, non-bonded forces were calculated using a two-stage RESPA approach(33) where the short-range forces within a 10 Å radius were updated every step and the long range forces beyond 10 Å were updated every two steps. The Langevin dynamics was used to control the temperature (310K) using a collision frequency of 1 ps−1. The center of mass translation and rotation were removed every 500 steps, which removes the “block of ice” problem(34–35). The trajectories were saved at 10-ps intervals for analysis. In total, 128 Opteron CPU cores (2.3 GHz) were used for ~50 days to complete the 8 binding simulations (a cumulative MD time of 1.2 μs for the two systems).
Clustering analysis
To gain a better understanding of the binding interactions, the stable complexes (atom contacts >20, see Fig. S7–S8) were grouped into different structural families based on the Cα Root Mean Square Deviation (RMSD) of the complex (cutoff of 5 Å) using the GROMACS protocol.(36) Representative structures (centroids) of the top abundant clusters (>2% of total stable complex snapshots) from the combined 4 runs of each system are shown in the Supplementary Material (Fig. S9–S10).
Binding energy calculation
The binding energy was evaluated on the centroid structure of a structural family using the Molecular Mechanics-Generalized Born/Surface Area (MM-GBSA) module in the AMBER package. The solvation energy is represented by the Generalized Born term (the polar part of the solvation) plus a Surface Area term (the hydrophobic part of the solvation free energy). Due to lack of solute entropy, the MM-GBSA binding energy tends to overestimate the absolute binding affinity. But when the solute entropies in different binding modes are comparable, the relative binding affinities can be estimated from the relative MMGBSA binding energies(37).
Collision Cross Section Calculation
The centroids of the top abundant clusters are also used to calculate their collision cross sections by a trajectory method(38–39). To correlate better with the solvent-free experiments, these solution-phase structures are converted to `dehydrated' structures via a 500,000-step energy minimization in vacuum prior to cross-section calculations. This “dehydration” generally reduces the overall size of the structures, while maintaining their solution structural features and in this paper these structures are referred to as “dehydrated solution structures”.
Thioflavin T (ThT) Fluorescence Assay
Twenty μM Aβ40 or Aβ42 were incubated in 10 mM phosphate buffer, pH 7.4, at 37°C with agitation using an orbital shaker at 100 rpm, in the absence and presence of Aβ(39–42) at 1:1 or 1:5 concentration ratios. Twenty five μL of these solutions were added to 300 μL of 20 μM ThT dissolved in the same buffer and then the mixture was vortexed briefly and incubated for additional 5 min. Fluorescence was determined using a Hitachi F-4500 fluorometer as described previously(40–41). The data are presented as mean ± SEM of at least 3 independent experiments.
Electron microscopy (EM)
Eight-μL of each solution used for the ThT fluorescence experiments were spotted onto glow-discharged, carbon-coated Formvar grids (Electron Microscopy Sciences), fixed with 5 μL of 2.5% glutaraldehyde, stained with 5 μL of 1% uranyl acetate for 1 min (Electron Microscopy Sciences), and examined using a JEOL CX100 transmission electron microscope as described previously(40–41). Oligomer and fibril diameters were analyzed using ImageJ (available at http://rsbweb.nih.gov/ij/). Fifty separate measurements were averaged and the data reported as mean ± SD.
MTT Reduction Assay
Aβ(39–42) inhibition of Aβ-induced toxicity was measured using the 3-(4,5-dimethylthiazol-2-yl)-2,5-diphenyltetrazolium bromide (MTT) cell-metabolism assay as described previously(9). Briefly, PC-12 cells were differentiated into a neuronal phenotype by incubation with nerve growth factor (100 ng/mL) for 48 h. Ten μM Aβ42 or 25 μM Aβ40 in the absence or presence of different concentrations of Aβ(39–42) were used and cell viability was determined using a CellTiter 96® kit (Promega, Madison, WI). At least 3 independent experiments with 6 replicates (n ≥ 18) were performed for each data point. The results were averaged and presented as mean ± SEM.
Results
Aβ(39–42) shifts the oligomer size frequency distribution of Aβ42 towards small oligomers
To probe the effect of Aβ(39–42) on the early oligomer distribution of full-length Aβ, mixtures of Aβ40 or Aβ42 with the CTF were analyzed using ion mobility-mass spectrometry (IM-MS). A 1:1 Aβ:CTF ratio showed no effect on Aβ oligomerization in these experiments (see supplemental information). In contrast, at a 1:5 ratio the CTF modulated the oligomer size distributions and therefore this ratio was used in most experiments. Figure 1 shows the mass spectra of Aβ42 (a) and a 1:5 Aβ42:Aβ(39–42) mixture (b). The mass spectrum of Aβ42 contains peaks for z/n = −4/1, −3/1, −5/2 and −2/1 (where z is the ion's charge and n is the oligomeric order) at m/z = 1128, 1504, 1805, and 2257.5, respectively. The same peaks are present in the mass spectrum of the Aβ42:Aβ(39–42) mixture (Fig 1b), as well as three additional peaks at m/z=1639, 1774, 1885, which correspond to z/n = −3 with one and two Aβ(39–42) peptides bound to Aβ42 and the z/n = −5/2 peak of one CTF bound to at least a dimer of Aβ42.
Figure 1.
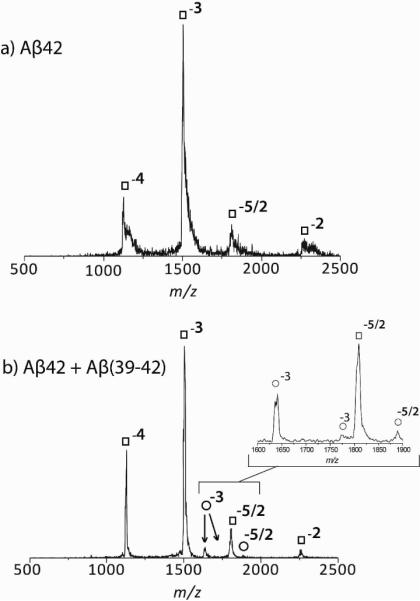
Mass Spectra of Aβ42 (a) and a 1:5 mixture of Aβ42 and Aβ(39–42) (b). Aβ42 peaks are noted with the symbol, □ and Aβ42-CTF peaks with the symbol, ∘. Note the increased signal to noise in the bottom spectrum indicating less aggregation is occurring.
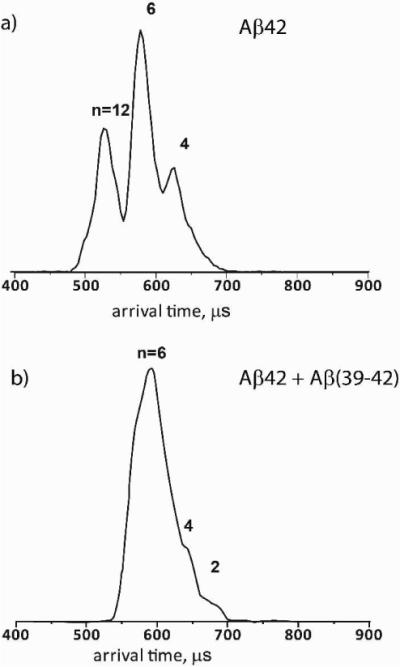
Ion-mobility spectrometry was used to analyze Aβ42 z/n = −5/2 in each case (Figure 2). For the Aβ42 sample, the ATD shows several features, which we have previously shown correspond to dimer, tetramer, hexamer, decamer, and dodecamer(2, 17) (Cross sections of the features shown here may be found in the supplemental information). In the case of the Aβ42:Aβ(39–42) mixture, the ATD has only three features, which may be assigned as the dimer, tetramer, and hexamer of Aβ42, based on their collision cross sections and an injection energy study (see supplemental information for cross sections and injection energy study). There are no features at shorter arrival times, indicating that the decamer and dodecamer of Aβ42 are not present in this mixture. Examination of the same samples three weeks following their preparation showed lower signal, suggesting that some of the peptide has aggregated and precipitated out of solution. Nonetheless, the ATD still showed only dimer through hexamer and no larger assemblies (Figure S2). Thus, the soluble fraction of Aβ42 in the presence of Aβ(39–42) comprises an oligomer size distribution distinct from that of Aβ42 alone, even though aggregation still occurs. In agreement with previous observations, inhibition of formation of Aβ42 decamers and dodecamers requires excess Aβ(39–42) and correlates with inhibition of Aβ42-induced toxicity, whereas at 1:1 Aβ42:Aβ(39–42) concentration ratio, the oligomer size distribution is similar to that of Aβ42 alone (see SI for data of the 1:1 mixture) and little or no inhibition of toxicity was observed(9).
Figure 2.

ATDs of the z/n=−5/2 charge state for Aβ42 (a) and a 1:5 mixture of Aβ42 and Aβ(39–42) (b). For Aβ42, features corresponding to the dimer through dodecamer are present (n=12, 10, 6, 4, 2). in contrast, for the mixture of Aβ42 and Aβ(39–42) only peaks corresponding to the dimer through hexamer are present.
To test whether Aβ(39–42) could reverse Aβ42 aggregation, a sample of Aβ42 was incubated at room temperature without agitation for 2 h and analyzed by IM-MS. The ATD of z/n= −5/2 is given in Fig 3a with dodecamer, hexamer, and tetramer clearly evident (confirmed by cross section measurements). Aβ(39–42) was added directly to this Aβ42 solution at a final Aβ(39–42):Aβ42 concentration ratio of 5:1, (by using a concentrated Aβ(39–42) stock solution, the concentration of Aβ42 remained at 20 μM). Ion-mobility data was recorded ~20 min after preparing the mixture. An ATD of z/n= −5/2 shows three features corresponding to the hexamer, tetramer and dimer of Aβ42 (Figure 3b) with no peaks at shorter arrival times, suggesting that Aβ(39–42) disassembled the Aβ42 dodecamer into smaller oligomers.
Figure 3.
Dissaggregation of Aβ42 by Aβ(39–42). The ATD of the z/n=−5/2 charge state of Aβ42, after two hours of incubation at room temperature (a) and the ATD of the z/n=−5/2 charge state of the same Aβ42 sample, after addition of Aβ(39–42) (b).
An arrival time distribution was also recorded for the peak at m/z=1884 in Figure 1 which represents a n[2Aβ42 + Aβ(39–42)]−5n species (Figure 4). The signal for this ATD is lower, due to the weak intensity of this peak in the mass spectrum. However, three features are present with cross sections that, although slightly larger than those of Aβ42 alone, closely correspond to a dimer, tetramer, and hexamer of Aβ (2847 Å2, 2408 Å2, 1313 Å2, respectively). This result indicates that the CTF binds not only to the dimer, but to larger assemblies like the tetramer and hexamer of Aβ42, in addition to monomer.
Figure 4.

ATDs of z/n=−5/2 for n[2Aβ42 + Aβ(39–42)]−5n. Features corresponding to the dimer (n=2) through hexamer (n=6) are present, as determined by cross section measurements. The ATD indicates that the tetramer with 2 CTFs attached is most prominent, with smaller contributions from the dimer with 1 CTF and the hexamer with CTF under the conditions of the experiment.
Aβ(39–42) does not change the oligomer size distribution of Aβ40
Aβ40 has a nearly identical sequence to that of Aβ42, but exhibits very different aggregative(2–4) and pathological properties(5), which are attributed to the absence of the C-terminal residues Ile41 and Ala42. Consequently it is interesting to study how Aβ(39–42) affects Aβ40 aggregation. The mass spectrum of an Aβ(39–42):Aβ40 5:1 mixture is shown in Figure 5. Peaks at m/z=1081, 1442, 1623, 1776, and 2162 correspond to Aβ40 z/n = −4, −3, −8/3 −5/2, and −2. Additional peaks in the mass spectrum represent z/n = −4 and −3 with one and two Aβ(39–42) peptides bound to Aβ40 and a peak at m/z = 1810 represents a n[2Aβ40 + Aβ(39–42)]−5n species. Past ion-mobility experiments using Aβ40 showed that the z/n = −5/2 peak of Aβ40 contained both dimer and tetramer(2, 42). In the presence of Aβ(39–42), the ATD of this peak contains a main peak at 675 μs and a shoulder at 650 s (Figure 5, inset). From their measured cross sections, these features are assigned as Aβ40 dimer and tetramer, suggesting no change in the oligomer size distribution of Aβ40 in the presence of Aβ(39–42). A nearly identical ATD with dimer and tetramer peaks results for n[2Aβ40 + Aβ(39–42)]−5n (Figure S4), indicating that the CTF binds to oligomers of Aβ40, as well.
Figure 5.

Mass Spectra of a 1:5 mixture of Aβ40 and Aβ(39–42). Aβ40 peaks are noted with the symbol, □ and Aβ40-CTF peaks with the symbol, ∘. Inset: ATD of the z/n = −5/2 peak of Aβ40. Peaks corresponding to the dimer and tetramer are present (n=−2, 4).
Aβ(39–42) does not inhibit Aβ fibril formation
The observation that Aβ(39–42) shifted the oligomer size distribution of Aβ42 towards smaller oligomers than those formed in the absence of the CTF, but at the same time did not prevent aggregation in samples incubated for 3 weeks, was intriguing and prompted us to examine whether Aβ(39–42) disrupted Aβ assembly into β-sheet-rich amyloid fibrils. We used the ThT fluorescence assay(43) to monitor temporal changes in β-sheet conformation in samples of Aβ40 and Aβ42 in the absence or presence of 1- or 5-equivalents of Aβ(39–42).
In the absence of Aβ(39–42), the fluorescence of Aβ42 increased steadily without an apparent lag phase, indicating β-sheet formation, and the reaction appeared to be complete by ~24 h (Figure 6A). The fluorescence of Aβ40 increased similarly following a lag phase of ~8 h and then reached a plateau at ~36 h (Figure 6B). Addition of 1- or 5-fold excess Aβ(39–42) had no apparent effect on β-sheet formation by either Aβ40 or Aβ42, suggesting that despite changing the oligomer size distribution of Aβ42, Aβ(39–42) did not inhibit its later aggregation.
Figure 6.

The interference of fibril formation of Aβ42 and Aβ40 in the absence and presence of Aβ(39–42). A) Aβ42 (20 μM), 1:1 and 1:5 mixtures of Aβ42 and Aβ(39–42) and B) Aβ40 (20 μM), 1:1 and 1:5 mixtures of Aβ40 and Aβ(39–42) were incubated at 37 degree with agitation. β–sheet structure was monitored using ThT fluorescence C) and D) Electron microscopy photos of all samples mentioned above at time 0 and at 72 hours incubation. The scale bar represents 100 nm.
Supporting the ThT fluorescence data, morphological examination of Aβ40 and Aβ42 in the absence or presence of 1- or 5-equivalents of Aβ(39–42) showed that following 72 h of incubation, both Aβ alloforms formed abundant fibrils (Figure 6C and D), regardless of the presence of the CTF. Interestingly, however, Aβ(39–42) did change the initial morphology in the solutions of Aβ40 and Aβ42. The morphology of Aβ42 at t = 0 consisted of a mixture of small globular assemblies and protofibrils with an average diameter = 8±2 nm. In the presence of 1- or 5-equivalents of Aβ(39–42), the relative contribution of protofibrillar structures increased and the average diameters observed were 10±2 and 10±2 nm, respectively (Figure 6C). In the absence of Aβ(39–42), the morphology of Aβ40 at t = 0 was amorphous, consistent with previous reports(3), whereas in the presence of equimolar concentration of Aβ(39–42) globular structures with average diameter = 7±1 nm were observed (Figure 6D), and in the presence of 5-fold excess Aβ(39–42) two distinct structure sizes were observed with diameters of 12±4 and 22±5 nm (Figure 6D).
Aβ(39–42) inhibits Aβ40-induced toxicity
The previous observation that Aβ(39–42) was a potent inhibitor of Aβ42-induced toxicity(9) suggested that the mechanism by which Aβ(39–42) works is formation of heterooligomers with Aβ42, which are not grossly distinct from those of Aβ42 alone, yet are not toxic. Here, we asked whether Aβ(39–42) could also inhibit the toxicity of Aβ40. To answer this question, we incubated differentiated PC-12 cells with Aβ40 (or Aβ42 as a positive control) in the absence or presence of increasing concentrations of Aβ(39–42). Because Aβ40 is less toxic than Aβ42, 25 μM Aβ40 were required to achieve the same level of toxicity as that induced by 10 μM Aβ42. Addition of increasing concentrations of Aβ(39–42) resulted in dose-dependent inhibition of the toxicity induced by Aβ42 (Figure 7), as observed previously(9). Similarly, Aβ(39–42) showed dose-dependent inhibition of Aβ40-induced toxicity. The half-maximal value (IC50) of inhibition of Aβ40-induced toxicity by Aβ(39–42) was 17±5 μM whereas inhibition of Aβ42-induced toxicity was obtained with IC50 = 7±10 μM. The difference between the IC50 values was not statistically significant (p = 0.83, student's t-test).
Figure 7.
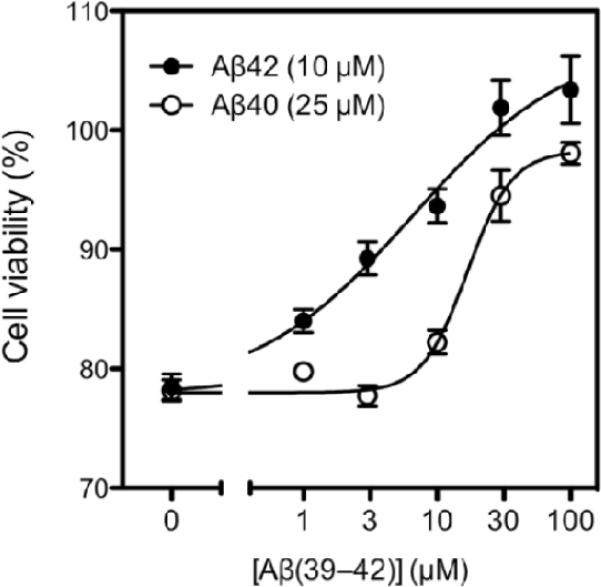
Aβ(39–42) inhibited both Aβ42- and Aβ40- induced toxicity dose-dependently. Aβ42 10 μM or Aβ40 25 μM with addition of different concentration of Aβ(39–42) were incubated with differentiated PC-12 cells and cell viability were determined by MTT assay.
Modeling the Aβ(39–42)-Aβ interaction
To probe the interaction between Aβ(39–42) and full-length Aβ at an atomic level, we constructed a system consisting of one Aβ(39–42) and one Aβ40 or Aβ42 molecule for all-atom molecular dynamics (MD) binding simulations. The most populated conformations of the peptides from previous studies(21–22) were used as the initial conformations in our simulations. This enabled sampling the most important conformations efficiently. The convergence of the binding simulations at 310 K was confirmed by many reversible binding events of Aβ(39–42) to Aβ40/Aβ42 (Figures S7–S8 of the supporting material).
To visualize the overall binding, we superimposed the stable complexes (those with atom contacts >20) identified from the trajectories in Figure 8. Both Aβ peptides in the complexes show great flexibility, as indicated by a widespread cloud of the overall backbones. This result is expected, as both Aβ alloforms are natively disordered. Although Aβ(39–42) is a C-terminal fragment of Aβ42, its binding (cyan balls) to both Aβ alloforms is not limited to their C-termini (small red balls). In fact, it binds to multiple sites on each Aβ alloform. Nonetheless, the binding of Aβ(39–42) to Aβ42 appears to be more specific than its binding to Aβ40. Figure 8 shows three abundant clusters of Aβ(39–42) on Aβ42 whereas the distribution of Aβ(39–42) binding sites on Aβ40 is more disperse. Another apparent difference between Aβ42 and Aβ40 is that Aβ42 in the Aβ:CTF complex is slightly more rigid and extended than Aβ40. These subtle differences highlight the importance of the C-terminus of Aβ42 and the role it plays in determining the peptide's conformation and interaction with the CTF.
Figure 8.
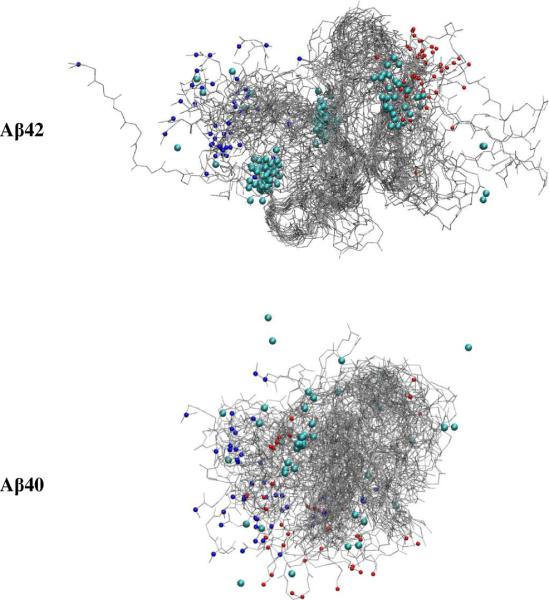
Binding of Aβ(39–42) to Aβ42 and to Aβ40. The positively charged N-termini and negatively charged C-termini are indicated by small blue and red balls, respectively. The CTF is noted by the larger cyan balls.
To gain further insight into the different binding modes, the stable complexes were classified into different structural families. Given the large structural fluctuations, we used a large Cα RMSD cutoff of 5Å to capture the major complex folds. The centroids of the top structural families (>2% of the population) for both Aβ alloforms are shown in Supplementary Figures S7 and S8, and selected ones are shown in Figure 9. The collision cross section of each centroid structure was calculated and listed together with the structures. For Aβ42, the top 8 structural families (panels a–h in Figure S10) comprise 85% of the total stable complex snapshots. Some important features are summarized as follows: I) Aβ(39–42) mainly adopts an extended conformation (~67%; families a–b, d–e and g–h) rather than a turn conformation (~18%, families c and f); II) The C-terminal β-hairpin of Aβ42 is persistent in all eight structural families and an additional short β-hairpin forms in the middle of Aβ42 in families a and c. A short 3–10 or α-helix forms in the middle Aβ42 in families b–e and g–h and Aβ42 becomes more extended in families e, g, and h, which comprise 14% of total complex snapshots. III) The intramolecular salt bridge between K28 and E22/D23 only forms in family a (29%, data not shown). IV) Aβ(39–42) binds to the C-terminal region (22%, c, f and g), the middle region (26%, b, d and h) and the N-terminal region (37%, a and e) of Aβ42. V) There is a moderate preference for Aβ(39–42) to insert into the inside of Aβ42 (as in the cases of families a, b, c, g and h, 63%) compared to the surface (families d, e and f, 22%) of Aβ42. VI) Aβ(39–42) interacts with the β-strands of Aβ42 either by forming cross-strand, main-chain hydrogen bonds (family a) or by hydrophobic interactions (families c, h, and g). One or two intermolecular salt bridges form in families b–e.
Figure 9.

Selected representative structures of Aβ·Aβ(39–42) complexes from the populated structural families (see Figure S9–S10 for structures from all families, a–f for Aβ42 and A–F for Aβ40). The abundance and collision cross section are noted below each structure. Only the side-chains in contact with Aβ(39–42) are shown (blue positively charged; red, negatively charged and black, hydrophobic). α-helical, 3–10-helical, β-extended, β-bridged, turn and coiled conformation are colored in purple, blue, yellow, tan, cyan and white, respectively. The positively charged N-termini and negatively charged C-termini are indicated by blue and red balls, respectively.
For Aβ40, the top six structural families (panels A–F of Figure S10) contain 94% of total stable complex snapshots. Again, important features of these complexes are summarized as follows: I) Aβ(39–42) mainly adapted an extended conformation (~76%) rather than a turn conformation (~18%). II) The central β-hairpin is not persistent except in family E. The initial two short 3–10 helices at the N-terminus and in the middle region of the peptide are persistent or converted into α-helix in most families except for D and E. Aβ40 is overall compact in all families. III) The intramolecular salt bridge between K28 and E22/D23 forms only in family E (11%, data not shown). IV) Aβ(39–42) binds to the C-terminal region (~16%, C and F), the middle region (~29%, B and E), and the N-terminal region (~49%, A and D) of Aβ40. V) There is a moderate preference for Aβ(39–42) to bind to the surface (families B–F, 56%), compared to the inside of Aβ40 (family A, 38%).; VI) Aβ(39–42) interacts with the β-strand of Aβ40 by forming cross-strand main-chain hydrogen-bonds and by a salt bridge between the N-terminus of Aβ40 and its C-terminus (family A). One or two intermolecular salt bridges form in families B and F.
To compare the experimental data with the MD simulations, experimental collision cross sections of z/n = −3 of Aβ42 or Aβ40 bound with one or two Aβ(39–42) peptides were measured and are listed in Table S1 (ATDs shown in Figure S11). The z/n= −3 was chosen because z/n= −3 it is the natural charge state for the monomer (n=1) in solution. A comparison of the experimental cross sections (Table S1) with the cross sections of the dehydrated MD structures (Figure 9) demonstrates good agreement for some of the calculated structural families (family c for Aβ42 and family B for Aβ40). MD simulations were not performed for two Aβ(39–42) peptides binding to Aβ42, although experimental cross sections were recorded. Cross sections of Aβ40 and Aβ42 with two CTFs bound show no significant increase in size, beyond that for adding the small CTF, suggesting that no large structural change occurs when two CTFs are bound to Aβ (See supplemental information for more discussion of the ATDs and cross sections of the Aβ:CTF complexes).
To gain a quantitative understanding of the interaction between Aβ(39–42) and Aβ42/Aβ40, we averaged the binding energies over the top binding modes (see Table 1). The overall binding energy (−22.2 ± 13.6 kcal/mol) of Aβ(39–42) to Aβ42 is comparable to its binding to Aβ40 (−22.5 ± 20.7 kcal/mol). Decomposition of the total binding energy (see Table 1) reveals that the van der Waals (vdW) interaction between Aβ(39–42) and Aβ42 is stronger than that between Aβ(39–42) and Aβ40 by −9.7 kcal/mol, whereas the electrostatic contributions (Generalized Born desolvation + gas phase electrostatics) are stronger for Aβ40 than for Aβ42 by 10.7 kcal/mol. These differences may reflect that Aβ(39–42) tends to insert inside Aβ42 to form favorable vdW interactions, but binds to the surface of Aβ40 to have favorable electrostatic interactions.
Table 1.
Binding energies of Aβ(39–42) to Aβ42 and Aβ40.
| Unit (kcal/mol) | ΔEVDW | ΔESUR | ΔEGBELE | ΔETOT |
|---|---|---|---|---|
| Aβ42 | −23.1±9.9 | −3.2±1.1 | 4.1±6.4 | −22.2±13.6 |
| Aβ40 | −13.4±8.6 | −2.5±1.6 | −6.6±13.3 | −22.5±20.7 |
| Change (ΔΔE) | −9.7 | −0.7 | 10.7 | 0.3 |
ΔEVDW The change of Van der Waals energy in gas phase upon complex formation.
ΔESUR The change of energy due to surface area change upon complex formation.
ΔEGBELE The change of GB reaction field energy + gas phase Elec. energy upon complex formation.
ΔETOT =ΔEVDW +ΔESUR +ΔEGBELE The change of potential energy in water upon complex formation.
Discussion and Conclusions
Aβ(39–42) has been shown to be a potent inhibitor of Aβ42 toxicity(9–10). To develop this peptide further as an effective drug candidate, it is important to understand the mechanism of inhibition. Due to the apparent relationship between Aβ42 toxicity and aggregation, we sought to understand if the effectiveness of Aβ(39–42) as an inhibitor of Aβ42 toxicity corresponds to inhibition of Aβ42 aggregation. We predicted that Aβ(39–42) might interact with full-length Aβ42 and form non-toxic heterooligomers, thus disrupting the protein's self-assembly and inhibiting the toxicity of Aβ42 oligomers(9–10).
Our MS data demonstrate that Aβ(39–42) interacts directly with both monomeric and oligomeric (n=2, 4, 6) Aβ42 and that at least two CTF molecules bind to monomer Aβ42 (Fig 1). It is also possible that more than two CTFs bind simultaneously to Aβ in solution, as suggested by prior discrete molecular dynamics simulations(9, 11), but dissociate during the ionization and dehydration steps of the MS experiments. The MD simulations show that Aβ(39–42) does not bind extensively to the C-terminus of Aβ42. Instead, it primarily binds in three locations along the full-length protein: the C-terminal region (22%), the middle region (26%), and the N-terminal region (37%). These results are consistent with recent tyrosine fluorescence experiments, which suggested that Aβ(39–42) binds primarily at the N-terminus of Aβ42(12). In addition, the binding of the CTF to areas other than the C-terminus of full-length Aβ42is supported by the finding that Aβ(39–42) also binds to Aβ40 (Figure 5). Aβ40 shares most of its primary sequence with Aβ42 but lacks the C-terminal Ile41 and Ala42 residues and the C-terminal turn stabilized by the presence of these residues. Although the overall binding energy of Aβ(39–42) to Aβ42 is very similar to its binding affinity to Aβ40, important differences are observed in the MD simulations. First, the interaction of Aβ(39–42) with Aβ42 is mediated predominantly via vdW interactions and is characterized by penetration of the tetrapeptide into Aβ42 oligomers, whereas binding to Aβ40 occurs mainly on the oligomer surface and involves mainly electrostatic interactions. Second, the binding of Aβ(39–42) to Aβ42 appears to be more specific than its binding to Aβ40, as indicated by three populated binding sites on Aβ42 in contrast to a more even distribution along the Aβ40 sequence (Figure 8).
The IM-MS and EM data show differences in the early oligomerization of Aβ42 in the presence of Aβ(39–42), where the CTF disrupts the formation of larger oligomers. Neat Aβ42, which normally forms multiple oligomers in IM-MS experiments, from dimers to dodecamers(2), but does not form the latter species in the presence of 5-fold excess Aβ(39–42) (Figure 2). Over time, this distribution of small, soluble Aβ42 oligomers does not change. These data are consistent with DLS results showing attenuation of Aβ42 aggregation in the presence of Aβ(39–42)(10). The results are interesting, as CTF addition also results in inhibition of toxicity. Importantly, the CTF does not inhibit formation of amyloid fibrils by Aβ40 or Aβ42, as shown by EM, lending strong support to the hypothesis that oligomers, and not amyloid fibrils are the Aβ form responsible for toxicity. This finding also has important implications both for our understanding of the mechanisms underlying Aβ-related neuropathology in AD and for screening campaigns based on assays that measure inhibition of β-sheet/fibril formation. Such assays may produce false positive and/or false negative results simply because they use the wrong outcome measure.
Notably, the IM-MS data suggest that Aβ(39–42) can dissociate pre-formed dodecamers, which presumably are toxic(44–45), into smaller, putatively non-toxic heterooligomers (Figure 3). This disaggregation may be due to an equilibrium effect: the CTF may sequester Aβ42 in Aβ:CTF heterooligomers, thereby reducing the amount of these small Aβ42 species in solution and shifting the steady-state distribution of large and small aggregates towards the latter, effectively disaggregating large, toxic Aβ42 oligomers (Le Chatlier principle).
The EM data suggest that in the presence of Aβ(39–42), Aβ42 forms protofibril-like assemblies, relative to globular oligomers, and that the protofibrils have larger diameters than those formed by Aβ42 in the absence of CTF, suggesting a possible structural rearrangement or reorganization of these large assemblies. Protofibril-like heterooligomers were observed in a recent discrete molecular dynamics study of Aβ42:Aβ(39–42) complexes(11), consistent with the morphologic data observed here.
Similar to Aβ42, at least two CTFs bind directly to Aβ40, according to the MS data. This is consistent with previous experiments with this CTF that demonstrated a preference for the N-terminus of Aβ42(12). However, the IM-MS data shows no changes in the oligomeric distribution of Aβ40 in the presence of Aβ(39–42), suggesting that either the CTF does not interfere with the aggregation of Aβ40 or, if it does disrupt Aβ40 aggregation, this event occurs at a later assembly step that is not detected in our experiments. Nonetheless, Aβ(39–42) inhibits Aβ40-induced toxicity. As this inhibition presumably occurs neither by modulating the oligomer size distribution nor by inhibiting fibril formation, and because Aβ(39–42) binds predominantly on the surface of Aβ40 oligomers, we speculate that the mechanism of inhibition involves prevention of interactions of the oligomers with their cellular targets, presumably the plasma membrane.
The binding of Aβ(39–42) to both Aβ40 and Aβ42 and its ability to inhibit the toxicity of each isoform is intriguing and suggests similarities in the pathogenic properties of these two proteins. Specifically, it suggests that the C-terminus of Aβ42 may not be as important in the toxic effects of this protein as previously thought. Rather, the N-terminus may play a more important role in Aβ's toxicity to cells than previously thought. Moreover, the inhibition of toxicity may be due to disruption of electrostatic interactions between the N-termini of oligomeric Aβ and charged cellular targets, such as the plasma membrane.
In this study we sought to connect the inhibition of Aβ42-induced toxicity by Aβ(39–42) to potential changes in the assembly of the full-length protein. The absence of the decamer and dodecamer species in the ion-mobility results and differences in the early morphology of aggregates demonstrate that the CTF modulates the formation of early, soluble aggregates. Intriguingly, at later assembly stages, the putative Aβ42:Aβ(39–42) heterooligomers transform into amyloid fibrils that are indistinguishable from those of Aβ42, yet this alternative assembly pathway appears not to involve formation of toxic species, while the kinetics of β-sheet and fibril formation is not affected by the presence of Aβ(39–42). Taken together, our findings suggest that in the presence of the CTF, Aβ follows alternative aggregation pathways, which allow bypassing formation of toxic assemblies (Scheme 1).
Scheme 1.
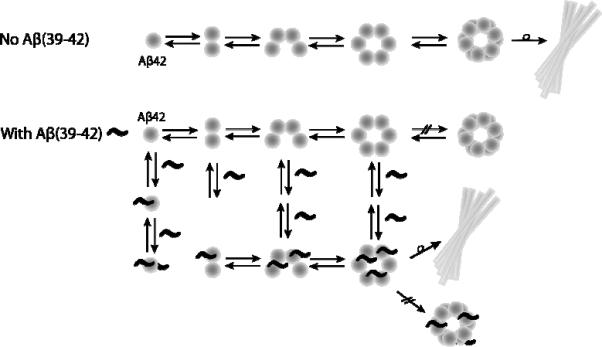
Aggregation mechanism of Aβ42 in the absence or presence of Aβ(39–42), consistent with the results presented here. Normally Aβ42 forms soluble, neurotoxic oligomers before forming larger, fibrillar structures. Aβ(39–42), binds directly to Aβ42 monomer and oligomeric species (n=2 4, 6), and eliminates the formation of large Aβ42 oligomers, driving the formation of non-toxic oligomeric species which also eventually form fibrils.
Supplementary Material
Acknowledgement
We thank Margaret Condron for synthesizing the Aβ40 and Aβ42 peptides used in this work. Simulations were performed on the ranger cluster at Texas Advanced Computing Center (LRAC MCA05S027 to JES).
The work has been supported by the National Institute of Health grant AG027818 (MTB, GB, and JES), the David and Lucile Packard Foundation (JES), and the National Science Foundation grant MCB-0642088 (JES).
Footnotes
Supplemental Information Additional ion mobility data of Aβ:CTF mixtures, starting structures for the MD simulations, and representative structures of the Aβ:CTF complexes from the most populated structural families. This material may be accessed free of charge via the Internet at http://pubs.acs.org.
References
- 1.Roychaudhuri R, Yang M, Hoshi MM, Teplow DB. Amyloid β-protein assembly and Alzheimer disease. J. Biol. Chem. 2009;284:4749–4753. doi: 10.1074/jbc.R800036200. [DOI] [PMC free article] [PubMed] [Google Scholar]
- 2.Bernstein SL, Dupuis NF, Lazo ND, Wyttenbach T, Condron MM, Bitan G, Teplow DB, Shea JE, Ruotolo BT, Robinson CV, Bowers MT. Amyloid-β protein oligomerization and the importance of tetramers and dodecamers in the aetiology of Alzheimer's disease. Nat. Chem. 2009;1:326–331. doi: 10.1038/nchem.247. [DOI] [PMC free article] [PubMed] [Google Scholar]
- 3.Bitan G, Kirkitadze MD, Lomakin A, Vollers SS, Benedek GB, Teplow DB. Amyloid beta-protein (Aβ) assembly: Aβ40 and Aβ42 oligomerize through distinct pathways. Proc. Natl. Acad. Sci. U.S.A. 2003;100:330–335. doi: 10.1073/pnas.222681699. [DOI] [PMC free article] [PubMed] [Google Scholar]
- 4.Ahmed M, Davis J, Aucoin D, Sato T, Ahuja S, Aimoto S, Elliott JI, Van Nostrand WE, Smith SO. Structural conversion of neurotoxic amyloid-β(1–42) oligomers to fibrils. Nat. Struct. Mol. Biol. 17:561–556. doi: 10.1038/nsmb.1799. [DOI] [PMC free article] [PubMed] [Google Scholar]
- 5.Dahlgren KN, Manelli AM, Stine WB, Baker LK, Krafft GA, LaDu MJ. Oligomeric and fibrillar species of amyloid-β peptides differentially affect neuronal viability. J. Biol. Chem. 2002;277:32046–32053. doi: 10.1074/jbc.M201750200. [DOI] [PubMed] [Google Scholar]
- 6.Yan Y, Wang C. Aβ42 is more rigid than Aβ40 at the C terminus: Implications for Aβ aggregation and toxicity. J. Mol. Biol. 2006;364:853–862. doi: 10.1016/j.jmb.2006.09.046. [DOI] [PubMed] [Google Scholar]
- 7.Urbanc B, Cruz L, Yun S, Buldyrev SV, Bitan G, Teplow DB, Stanley HE. In silico study of amyloid β-protein folding and oligomerization. Proc. Natl. Acad. Sci. U.S.A. 2004;101:17345–17350. doi: 10.1073/pnas.0408153101. [DOI] [PMC free article] [PubMed] [Google Scholar]
- 8.Lazo ND, Grant MA, Condron MC, Rigby AC, Teplow DB. On the nucleation of amyloid β-protein monomer folding. Protein Sci. 2005;14:1581–1596. doi: 10.1110/ps.041292205. [DOI] [PMC free article] [PubMed] [Google Scholar]
- 9.Fradinger EA, Monien BH, Urbanc B, Lomakin A, Tan M, Li H, Spring SM, Condron MM, Cruz L, Xie CW, Benedek GB, Bitan G. C-terminal peptides coassemble into Aβ42 oligomers and protect neurons against Aβ42-induced neurotoxicity. Proc. Natl. Acad. Sci. U.S.A. 2008;105:14175–14180. doi: 10.1073/pnas.0807163105. [DOI] [PMC free article] [PubMed] [Google Scholar]
- 10.Li H, Monien BH, Lomakin A, Zemel R, Fradinger EA, Tan M, Spring SM, Urbanc B, Xie C-W, Benedek GB, Bitan G. Mechanistic investigation of the inhibition of Aβ42 assembly and neurotoxicity by Aβ42 C-terminal fragments. Biochem. 2010;49:6358–6364. doi: 10.1021/bi100773g. [DOI] [PMC free article] [PubMed] [Google Scholar]
- 11.Urbanc B, Betnel M, Cruz L, Li H, Fradinger EA, Monien BH, Bitan G. Structural Basis for Aβ(1–42) Toxicity inhibition by Aβ C-terminal fragments: discrete molecular dynamics study. J. Mol. Biol. 2011;410:316–328. doi: 10.1016/j.jmb.2011.05.021. [DOI] [PMC free article] [PubMed] [Google Scholar]
- 12.Li H, Du Z, Fradinger EA, Wang C, Bitan G. C-terminal tetrapeptides inhibit Aβ42-induced neurotoxicity primarily through specific interactino at the N-terminus of Aβ42. Submitted for publication. 2011 doi: 10.1021/jm200982p. [DOI] [PMC free article] [PubMed] [Google Scholar]
- 13.Wyttenbach T, Bowers MT. Gas-phase conformations: The ion mobility/ion chromatography method. Mod. Mass Spec. 2003;225:207–232. [Google Scholar]
- 14.Bleiholder C, Dupuis NF, Wyttenbach T, Bowers MT. Ion mobility-mass spectrometry reveals a conformational conversion from random assembly to β-sheet in amyloid fibril formation. Nat. Chem. 2011;3:172–177. doi: 10.1038/nchem.945. [DOI] [PMC free article] [PubMed] [Google Scholar]
- 15.Grabenauer M, Wyttenbach T, Sanghera N, Slade SE, Pinheiro TJT, Scrivens JH, Bowers MT. Conformational Stability of Syrian Hamster Prion Protein PrP(90–231) J. Amer. Chem. Soc. 2010;132:8816–8818. doi: 10.1021/ja100243h. [DOI] [PMC free article] [PubMed] [Google Scholar]
- 16.Dupuis NF, Wu C, Shea JE, Bowers MT. Human Islet Amyloid Polypeptide Monomers Form Ordered β-hairpins: A Possible Direct Amyloidogenic Precursor. J. Amer. Chem. Soc. 2009;131:18283–18292. doi: 10.1021/ja903814q. [DOI] [PMC free article] [PubMed] [Google Scholar]
- 17.Bernstein SL, Wyttenbach T, Baumketner A, Shea JE, Bitan G, Teplow DB, Bowers MT. Amyloid β-protein: Monomer structure and early aggregation states of Aβ42 and its Pro(19) alloform. J. Amer. Chem. Soc. 2005;127:2075–2084. doi: 10.1021/ja044531p. [DOI] [PubMed] [Google Scholar]
- 18.Baumketner A, Bernstein SL, Wyttenbach T, Bitan G, Teplow DB, Bowers MT, Shea JE. Amyloid β-protein monomer structure: A computational and experimental study. Protein Sci. 2006;15:420–428. doi: 10.1110/ps.051762406. [DOI] [PMC free article] [PubMed] [Google Scholar]
- 19.Wyttenbach T, Kemper PR, Bowers MT. Design of a new electrospray ion mobility mass spectrometer. Int. J. Mass Spectrom. 2001;212:13–23. [Google Scholar]
- 20.Gidden J, Baker ES, Ferzoco A, Bowers MT. Structural motifs of DNA complexes in the gas phase. Int. J. Mass Spectrom. 2005;240:183–193. [Google Scholar]
- 21.Sgourakis NG, Yan YL, McCallum SA, Wang CY, Garcia AE. The Alzheimer's peptides Aβ40 and 42 adopt distinct conformations in water: A combined MD/NMR study. J. Mol. Biol. 2007;368:1448–1457. doi: 10.1016/j.jmb.2007.02.093. [DOI] [PMC free article] [PubMed] [Google Scholar]
- 22.Wu C, Murray MM, Bernstein SL, Condron MM, Bitan G, Shea JE, Bowers MT. The Structure of Aβ42 C-Terminal Fragments Probed by a Combined Experimental and Theoretical Study. J. Mol. Biol. 2009;387:492–501. doi: 10.1016/j.jmb.2009.01.029. [DOI] [PMC free article] [PubMed] [Google Scholar]
- 23.Duan Y, Chowdhury S, Xiong G, Wu C, Zhang W, Lee T, Cieplak P, Caldwell J, Luo R, Wang J, Kollman PA. A point-charge force field for molecular mechanics simulations of proteins based on condensed-phase QM calculations. J. Comp. Chem. 2003;24:1999–2012. doi: 10.1002/jcc.10349. [DOI] [PubMed] [Google Scholar]
- 24.Li WF, Zhang J, Su Y, Wang J, Qin M, Wang W. Effects of zinc binding on the conformational distribution of the amyloid-β peptide based on molecular dynamics simulations. J. Phys. Chem. B. 2007;111:13814–13821. doi: 10.1021/jp076213t. [DOI] [PubMed] [Google Scholar]
- 25.Yamazaki T, Blinov N, Wishart D, Kovalenko A. Hydration Effects on the HET-s Prion and Amyloid-β Fibrillous Aggregates, Studied with Three-Dimensional Molecular Theory of Solvation. Biophys. J. 2008;95:4540–4548. doi: 10.1529/biophysj.107.123000. [DOI] [PMC free article] [PubMed] [Google Scholar]
- 26.Wu C, Bowers MT, Shea JE. Molecular Structures of Quiescently Grown and Brain-Derived Polymorphic Fibrils of the Alzheimer Amyloid Aβ(9–40) Peptide: A Comparison to Agitated Fibrils. PLoS Comput. Biol. 2010;6 doi: 10.1371/journal.pcbi.1000693. [DOI] [PMC free article] [PubMed] [Google Scholar]
- 27.Wu C, Wang ZX, Lei HX, Zhang W, Duan Y. Dual binding modes of Congo red to amyloid protofibril surface observed in molecular dynamics simulations. J. Amer. Chem. Soc. 2007;129:1225–1232. doi: 10.1021/ja0662772. [DOI] [PubMed] [Google Scholar]
- 28.Jorgensen WL, Chandrasekhar J, Madura JD, Impey RW, Klein ML. Comparisons of simple potential functions for simulating liquid water. J. Chem. Phys. 1983;79:926–935. [Google Scholar]
- 29.Hornak V, Abel R, Okur A, Strockbine B, Roitberg A, Simmerling C. Comparison of multiple amber force fields and development of improved protein backbone parameters. Proteins: Struct., Funct., Bioinfo. 2006;65:712–725. doi: 10.1002/prot.21123. [DOI] [PMC free article] [PubMed] [Google Scholar]
- 30.Wang JM, Wolf RM, Caldwell JW, Kollman PA, Case DA. Development and testing of a general amber force field. J. Comp. Chem. 2004;25:1157–1174. doi: 10.1002/jcc.20035. [DOI] [PubMed] [Google Scholar]
- 31.Essmann U, Perera L, Berkowitz ML, Darden TA, Lee H, Pedersen LG. A smooth particle mesh Ewald method. J. Chem. Phys. 1995;103:8577–8593. [Google Scholar]
- 32.Ryckaert J-P, Ciccotti G, Berendsen HJC. Numerical Integration of the Cartesian Equations of Motion of a System with Constraints: Molecular Dynamics of n-Alkanes. J. Chem. Phys. 1977;23:327–341. [Google Scholar]
- 33.Procacci P, Berne BJ. Multiple Time-Scale Methods For Constant-Pressure Molecular-Dynamics Simulations Of Molecular-Systems. Molec. Phys. 1994;83:255–272. [Google Scholar]
- 34.Chiu SW, Clark M, Subramaniam S, Jakobsson E. Collective motion artifacts arising in long-duration molecular dynamics simulations. J. Comp. Chem. 2000;21:121–131. [Google Scholar]
- 35.Harvey SC, Tan RKZ, Cheatham TE. The flying ice cube: Velocity rescaling in molecular dynamics leads to violation of energy equipartition. J. Comp. Chem. 1998;19:726–740. [Google Scholar]
- 36.Daura X, Gademann K, Jaun B, Seebach D, van Gunsteren WF, Mark AE. Peptide folding: When simulation meets experiment. Angew. Chem. Int. Ed. 1999;38:236–240. [Google Scholar]
- 37.Kongsted J, Soderhjelm P, Ryde U. How accurate are continuum solvation models for drug-like molecules? J. Comput.-Aided Mol. Des. 2009;23:395–409. doi: 10.1007/s10822-009-9271-6. [DOI] [PubMed] [Google Scholar]
- 38.Mesleh MF, Hunter JM, Shvartsburg AA, Schatz GC, Jarrold MF. Structural information from ion mobility measurements: Effects of the long-range potential. J. Phys. Chem. 1996;100:16082–16086. [Google Scholar]
- 39.Shvartsburg AA, Jarrold MF. An exact hard-spheres scattering model for the mobilities of polyatomic ions. Chem Phys Lett. 1996;261:86–91. [Google Scholar]
- 40.Rahimi F, Shanmugam A, Bitan G. Structure-function relationships of prefibrillar protein assemblies in Alzheimer's disease and related disorders. Curr. Alzh. Res. 2008;5:319–341. doi: 10.2174/156720508784533358. [DOI] [PMC free article] [PubMed] [Google Scholar]
- 41.Rahimi F, Murakami K, Summers JL, Chen CH, Bitan G. RNA aptamers generated against oligomeric Aβ40 recognize common amyloid aptatopes with low specificity but high sensitivity. PLoS One. 2009;4:e7694. doi: 10.1371/journal.pone.0007694. [DOI] [PMC free article] [PubMed] [Google Scholar]
- 42.Murray MM, Bernstein SL, Nyugen V, Condron MM, Teplow DB, Bowers MT. Amyloid beta Protein: Aβ40 Inhibits Aβ42 Oligomerization. JACS. 2009;131:6316–+. doi: 10.1021/ja8092604. [DOI] [PMC free article] [PubMed] [Google Scholar]
- 43.LeVine H., III . Methods in Enzymology; Amyloid, prions, and other protein aggregates. Vol. 309. 1999. Quantification of β-sheet amyloid fibril structures with thioflavin T; pp. 274–284. [DOI] [PubMed] [Google Scholar]
- 44.Lesne S, Koh MT, Kotilinek L, Kayed R, Glabe CG, Yang A, Gallagher M, Ashe KH. A specific amyloid β-protein assembly in the brain impairs memory. Nature. 2006;440:352–357. doi: 10.1038/nature04533. [DOI] [PubMed] [Google Scholar]
- 45.Gong YS, Chang L, Viola KL, Lacor PN, Lambert MP, Finch CE, Krafft GA, Klein WL. Alzheimer's disease-affected brain: Presence of oligomeric Aβ ligands (ADDLs) suggests a molecular basis for reversible memory loss. Proc. Natl. Acad. Sci. U.S.A. 2003;100:10417–10422. doi: 10.1073/pnas.1834302100. [DOI] [PMC free article] [PubMed] [Google Scholar]
Associated Data
This section collects any data citations, data availability statements, or supplementary materials included in this article.