

Abstract
With the advent of Internet-based 24-hour recall (24HR) instruments, it is now possible to envision their use in cohort studies investigating the relation between nutrition and disease. Understanding that all dietary assessment instruments are subject to measurement errors and correcting for them under the assumption that the 24HR is unbiased for usual intake, here the authors simultaneously address precision, power, and sample size under the following 3 conditions: 1) 1–12 24HRs; 2) a single calibrated food frequency questionnaire (FFQ); and 3) a combination of 24HR and FFQ data. Using data from the Eating at America’s Table Study (1997–1998), the authors found that 4–6 administrations of the 24HR is optimal for most nutrients and food groups and that combined use of multiple 24HR and FFQ data sometimes provides data superior to use of either method alone, especially for foods that are not regularly consumed. For all food groups but the most rarely consumed, use of 2–4 recalls alone, with or without additional FFQ data, was superior to use of FFQ data alone. Thus, if self-administered automated 24HRs are to be used in cohort studies, 4–6 administrations of the 24HR should be considered along with administration of an FFQ.
Keywords: combining dietary instruments, data collection, dietary assessment, energy adjustment, epidemiologic methods, measurement error, nutrient density, nutrient intake
One of the greatest challenges for nutritional epidemiologists investigating the relations between dietary intake and disease is obtaining accurate estimates of dietary intakes using available self-report tools. The most practical, affordable, and common dietary assessment instrument used in prospective cohort studies is the food frequency questionnaire (FFQ). Investigators using as reference instruments unbiased recovery biomarkers for protein, potassium, and energy intakes have evaluated measurement error structure in FFQs for those dietary components. These studies have indicated that FFQs may contain substantial measurement error, both random and systematic, leading to serious biases and loss of statistical power and therefore potentially masking some important diet-disease relations (1–4). This concern is especially related to absolute nutrient intakes; energy adjustment appears to correct for some of this measurement error, supporting its continued use in multivariate modeling (2, 4).
Correction for bias in estimated diet-disease relations due to measurement error in FFQs requires calibration substudies, preferably with recovery biomarkers, or alternatively with quantitative dietary assessment reference instruments such as food records or 24-hour dietary recalls (24HRs). Such biomarkers/reference instruments may include error, but the error should be independent of true intake and error in the FFQ (2). The statistical power to detect diet-disease relations, however, is not improved by bias correction and requires an increased sample size (4). Besides, bias correction requires statistical modeling and may strongly depend on modeling assumptions—for example, on how to handle systematic biases in FFQs due to subject characteristics. For all of these reasons, improving dietary assessment remains a key element in nutritional epidemiology.
Short-term quantitative instruments, such as food records or 24HRs, assess details about a person’s entire dietary intake for single days. Regarding usual intake (i.e., long-term average intake), the construct of interest in chronic disease epidemiology, there is evidence that the detailed information obtained from food records or 24HRs may provide more accurate (less biased) estimates than information from FFQs (4, 5). Although their within-person random error may be relatively large because of high day-to-day variability in intake, it may be reduced by repeated administrations, with the remaining error corrected by statistical modeling. Some research suggests that food records may provide high-quality data without interviewer review when participants are instructed prior to recording their food intake (6, 7). In addition, 2 studies (8, 9) have found statistically significant diet-disease relations with food records but not with FFQs.
However, use of short-term instruments in large cohort studies continues to be limited by the costs and logistics of data collection and is often restricted to providing reference measurements in calibration substudies. More recently, though, new technology-driven tools are being or have been developed that might overcome some of the cost and feasibility issues related to collection of food records or multiple dietary recalls in large-scale studies. Food records are being developed using mobile phone technology to take digital images of foods before, after, or throughout consumption (10–12). Additionally, self-administered 24HRs, such as the Automated Self-Administered 24-Hour Recall, are available for use (13–16) or are under development (17). Such tools eliminate the high labor costs associated with interviewer administration (24HRs) and coding (24HRs, food records).
Even assuming unbiasedness, the number of repeat administrations of 24HRs or food records needed to capture intake of episodically consumed foods or nutrients (i.e., those that are not consumed every day by most people, such as dark green vegetables, fish, beta-carotene, or omega-3 fatty acids) may become impractical because of respondent burden. The FFQ, despite its imprecision and cognitive difficulty, has the strength of querying about long-term intake, thereby aiming to obtain data on usual intake with a single administration.
The purpose of the current analysis was to assess the precision, power, and sample size of 3 alternative design strategies to inform the study design for future dietary cohort studies. The 3 strategies are: 1) 1–12 24HRs; 2) a single calibrated FFQ; and 3) a combination of the 24HR and FFQ. Because unbiased estimation of disease risk is important in nutritional epidemiology, we consider these different design strategies after correction for corresponding measurement error. In this analysis, we assume that the 24HR provides an unbiased estimate of usual intake and contains only random within-person error.
MATERIALS AND METHODS
Data
We used data from the 1997–1998 Eating at America’s Table Study (EATS) (18), which collected dietary data from a nationally representative sample of US adults. We considered 965 respondents who successfully completed 4 telephone-administered 24HRs over 1 calendar year (1 recall per season) and an FFQ at the end of the year.
The 24HRs were collected using the multiple-pass method developed for the US Department of Agriculture’s 1994–1996 Continuing Survey of Food Intakes by Individuals (19). The 24HR data were coded using the Food Intake Analysis System, version 3.0, which was developed at the University of Texas using US Department of Agriculture data files (data collected through 1997). In addition to nutrients, intakes of food groups were also derived on the basis of the My Pyramid Equivalents Database (MPED) (20), obtained by matching identical or similar US Department of Agriculture food codes in the EATS recall data set to those in MPED.
The FFQ used in EATS was the National Cancer Institute’s Diet History Questionnaire. The methods used to create the nutrient and food group database for the Diet History Questionnaire have been previously described (21).
We analyzed fat, carbohydrate, protein, fiber, vitamin C, and MPED servings of fruit, red meat, fish, dark green vegetables, and whole grains. The MPED values for red meat were constructed by summing the MPED values for “total meat” for all beef, ham, and pork-containing 24HR and FFQ items. The above nutrients and food groups were selected for analysis because they provide consumption patterns ranging from nearly daily by everyone in the population to episodically by most.
Dietary instruments and assumptions
The dietary instruments available are a 24HR (with 1–12 possible repeats), called R, and an FFQ, called Q. We assume that 1) measurement error in both the 24HR and the FFQ is nondifferential with respect to disease and 2) intakes reported on the 24HR are unbiased at the individual level for usual intake of any nutrient or food. The second assumption may not be exactly true, at least not for all foods and nutrients (2), and hence we are in effect defining an individual’s usual intake to be the long-term mean of his or her 24HR reports (see the Discussion). To make our analysis feasible, we consider univariate risk models containing only 1 dietary exposure. Therefore, when dietary intake is adjusted for energy intake, we assume that energy itself is not related to disease.
Risk models
We let Y represent the disease response. If we could observe the true usual intake T, then a standard logistic regression or survival analysis would be performed. For example, in a logistic regression analysis of a binary response Y (disease present or absent), our model is
| (1) |
A diet-disease association exists if the regression slope αT, which represents the log odds ratio per unit change in intake, is different from zero.
Review of regression calibration
In a statistical analysis of risk, corrections for dietary measurement error typically use regression calibration (22–25). We generically write C as dietary data that are available to help understand the distribution of usual intake from each instrument.
Since true usual intake T cannot be observed exactly, regression calibration simply replaces T in the standard analysis with its best prediction by C—that is, its conditional mean given C, or, in symbols, E(T|C). How this prediction is done depends on the problem context.
In regression calibration, for relatively rare diseases and for relative risks that are not very large, the relation between disease and exposure E(T|C) is well approximated by a logistic regression model with the same slope as in equation 1,
| (2) |
Important consequences
The most important consequence of equation 2 is that the precision of the estimated regression slope αT and therefore the statistical power to detect the effect depends not on the dietary data C themselves but on the properties of E(T|C). For example, in a study which uses only an FFQ, the power depends not on the FFQ itself but on the regression of usual intake on the FFQ.
Let R2 denote the squared correlation coefficient for the correlation between true usual intake T and its predictor E(T|C). It is shown in the Appendix that R2 is equal to the ratio of Var{E(T|C)} to Var(T). There are a few well-known facts about the relation between equations 1 and 2 and its consequences. These are justified in both the article by Carroll et al. (25) and the supplementary material for the article by Kipnis et al. (26) (available under “Paper Information” at http://www.biometrics.tibs.org). Basically, as R2 between T and E(T|C) increases, the better we can estimate the risk parameter αT, the greater the statistical power for testing a diet-disease relation, and the smaller the sample size necessary to detect diet-disease relations.
Energy-adjusted nutrients and foods
We use energy-adjusted usual intakes T, defined here as the residual of the regression of usual intake of a nutrient or food on energy. To accomplish this, recently described models (27, 28) are necessary. The models and their use in estimating energy-adjusted usual intakes T are described in Web Appendices 1 and 2 (available on the Journal’s Web site (http://aje.oxfordjournals.org/)).
Alternative design strategies
We consider 3 possible design strategies.
24HR only: Here only 24HRs are available in the main study, and C is the collection of these 24HRs.
FFQ only: C refers to the FFQ, the only instrument in the main study.
24HR + FFQ: Here we use 24HRs plus the FFQ, and C refers to the collection of the 24HRs and the FFQ in the main study.
In our calculations, we assume that the calibrated predictor function E(T|C) is known. Except in the case of 1 FFQ only or 1 24HR only, the calibration study size would equal the main study size, and the E(T|C) equation would be estimated so precisely that it would have a minimal impact on the standard errors of risk. Indeed, an extra advantage of having more than 1 instrument in the main study is the “automatic” receipt of a very large calibration study. This should further increase the efficiency of FFQ + 24HRs over FFQ alone, since the FFQ alone will (presumably) be analyzed using a calibration study of smaller size than the one available in the combined instrument design.
To investigate these alternative strategies, we fit the models for each nutrient/food plus energy (27–29). We then estimate energy-adjusted usual intake as described in Web Appendices 1 and 2.
We also are interested in predicting the effect of using more than the four 24HRs employed in EATS, with and without the FFQ, and in comparing multiple 24HRs with or without the FFQ to an FFQ alone. To understand these effects, we simulated data from the models fitted using EATS (see Web Appendices 3 and 4 for how this was done). We found that the results for the simulated data and the actual data, when both were available, were very similar, so we report results for only the former.
For illustrative purposes, we concentrate on the results among women for fat, vitamin C, whole grains, and dark green vegetables, all energy-adjusted; results among men were similar. These foods and nutrients provide a representative view of the results for all examined nutrients and foods (see Web Appendices 5 and 6).
Comparison criteria
We compare the 3 strategies outlined above using 3 measures: 1) R2 between energy-adjusted usual intake and the predictions; 2) the power for detecting a diet-disease relation; and 3) the relative sample size needed to have 90% power to detect a diet-disease relation. (See the Appendix for technical details of calculations.)
RESULTS
Data analysis
For the 2 nutrients and 2 foods selected for presentation, Figure 1 displays the comparison of relative R2 values between T and the 3 design strategies with 1–12 24HRs to the R2 for 12 24HRs plus the FFQ. We then set the statistical power for testing a diet-disease relation to be 90% when using 12 24HRs plus the FFQ (see Appendix for details), and in Figure 2 we compare the statistical power of the design strategies. In Figure 3, we compare the relative sample sizes required to obtain 90% power relative to the strategy of using 12 24HRs plus the FFQ. On the Journal’s Web site, we present the values of R2 in tabular form (Web Appendices 5 and 6) and graphical versions of Figures 1–3 (Web Appendix 7) for the full set of nutrients and foods in women and men.
Figure 1.

Ratio of R2 to the use of the calibrated combination of 12 24-hour dietary recalls (24HRs) plus a food frequency questionnaire (FFQ), Eating at America’s Table Study, 1997–1998. The solid line shows results for calibrated 24HR(s) only. The dashed line shows results for a calibrated combination of 24HR(s) + FFQ. The dotted line shows results for the calibrated FFQ only. A) Energy-adjusted total fat intake; B) energy-adjusted vitamin C intake; C) energy-adjusted intake of whole grains; D) energy-adjusted intake of dark green vegetables. See Web Appendix 7 for plots for the other dietary components.
Figure 2.

Comparison of statistical powers (%) when the use of a calibrated combination of 12 24-hour dietary recalls (24HRs) plus a food frequency questionnaire (FFQ) leads to 90% power, Eating at America’s Table Study, 1997–1998. The solid line shows results for calibrated 24HR(s) only. The dashed line shows results for a calibrated combination of 24HR(s) + FFQ. The dotted line shows results for the calibrated FFQ only. A) Energy-adjusted total fat intake; B) energy-adjusted vitamin C intake; C) energy-adjusted intake of whole grains; D) energy-adjusted intake of dark green vegetables. See Web Appendix 7 for plots for the other dietary components.
Figure 3.

The relative sample size necessary to achieve 90% power compared with the sample size necessary to achieve 90% power using the calibrated combination of 12 24-hour dietary recalls (24HRs) plus a food frequency questionnaire (FFQ), Eating at America’s Table Study, 1997–1998. The solid line shows results for calibrated 24HR(s) only. The dashed line shows results for a calibrated combination of 24HR(s) + FFQ. The dotted line shows results for the calibrated FFQ only. The vertical axis shows the relative sample size as a percentage; for example, a value of 200 means that the relative sample size is 200% of that required when using 12 24HRs plus an FFQ. A) Energy-adjusted total fat intake; B) energy-adjusted vitamin C intake; C) energy-adjusted intake of whole grains; D) energy-adjusted intake of dark green vegetables. See Web Appendix 7 for plots for the other dietary components.
Inspection of the Web appendices indicates that the R2 values for men and women are generally quite similar, with the biggest difference being observed for red meat, where the R2 values for men and women when using an FFQ only are 0.47 and 0.63, respectively. However, the observed patterns in terms of the comparisons of FFQ only, 24HRs only, or 24HRs + FFQ are similar by sex.
Generally, while the numerical results differ, the patterns of R2 values are similar for total fat, vitamin C, carbohydrates, protein, fiber, total fruit, and whole grains. The patterns for dark green vegetables, red meat, and fish are similar to one another but very different from the others.
There are 2 perspectives to bring to these data. The first is to consider studies that use 24HRs only versus those that use 24HRs + FFQ. The second is to consider studies that use FFQ only versus those that use 24HRs + FFQ. We take each perspective in turn.
Marginal gain of adding FFQ to 24HRs
The first perspective is to ask whether supplementation of the 24HRs with the FFQ is useful. For total fat, vitamin C, carbohydrates, protein, fiber, total fruit, and whole grains, there are clear gains when two 24HRs are supplemented with the FFQ. For example, for total fat, the R2 changes from 0.419 to 0.590, the power from 0.63 to 0.78, and the relative required sample size (i.e., the size required with 24HRs relative to that required with 24HR and FFQ) from 199% to 142%. With four 24HRs, combination with the FFQ produces some gains, with the R2 changing from 0.59 to 0.68, the power from 0.78 to 0.83, and the relative required sample size from 142% to 122%.
However, for dark green vegetables, red meat, and fish, supplementation of 24HRs with the FFQ is vital. For example, for dark green vegetables, even with six 24HRs, supplementation with the FFQ produces strong gains in R2, power, and sample size.
Marginal gain of adding 24HRs to FFQ
For the second perspective, consider the comparison of the FFQ only with supplementation of the FFQ with 24HRs, and consider total fat, vitamin C, carbohydrates, protein, fiber, total fruit, and whole grains. It is clear from Figures 1–3 and Web Appendix 5 that supplementation with even two 24HRs is useful, with four 24HRs achieving most of the possible gains. Consider total fat as a representative example. The R2 values for FFQ only and FFQ plus two, four, and six 24HRs are 0.42, 0.59, 0.68, and 0.74, respectively. The power comparisons are 0.63, 0.78, 0.83, and 0.86, respectively. The relative required sample sizes (i.e., the size required for the FFQ relative to that required with 12 24HRs and the FFQ) are 201%, 142%, 122%, and 117%, respectively. Thus, for the foods and nutrients listed above, supplementation of the FFQ with two 24HRs is useful, and supplementation with four 24HRs achieves most of the possible gains.
However, for other food groups (i.e., dark green vegetables, red meat, and fish), we get quite different answers. For example, for dark green vegetables, compare the FFQ alone with the FFQ combined with six 24HRs. The R2 values are 0.56 and 0.66, the powers are 0.81 and 0.87, and the relative required sample sizes are 129% and 109%, respectively. Thus, for this episodically consumed food (and for red meat and fish), there is not much gain from supplementation with 24HRs.
Web Appendices 5–7 contain additional information—for example, for a given set of 24HRs, the gain in adding an FFQ or additional 24HR.
DISCUSSION
Our statistical model assumes that the 24HR gives an unbiased assessment of an individual’s usual intake and that its errors are independent of the FFQ; without such assumptions, it is impossible to model the usual intakes that are central to our analysis. Data from the National Cancer Institute’s Observing Protein and Energy Nutrition (OPEN) Study, which has reference biomarkers for protein, potassium, and energy intakes, showed that such assumptions are untrue for these nutrients (4, 5). However, the 24HR was substantially less biased than the FFQ and is used regularly in dietary surveillance (26). We also note that should the 24HR involve some bias for assessing certain dietary intakes, regression calibration would produce biased estimates of the risk parameter of interest. In univariate disease models, the bias would be multiplicative and therefore would not change the relative comparisons of the variability of the estimated risk parameters. However, the statistical powers and sample sizes necessary under different strategies would change. We estimated this change for energy-adjusted protein and potassium intakes in the OPEN Study for men and women separately. We applied regression calibration adjustment as described above and then estimated the R2 ratios in 2 ways: first, assuming that the 24HR is unbiased, and second, using the unbiased biomarkers. The results are displayed in Web Appendix 8. The R2 ratios are almost exactly the same for all nutrients but protein for men, indicating that although a biased 24HR may lead to biased estimates of relative risk, nevertheless the relative powers/sample sizes displayed in our tables are robust to possible biases in the 24HR.
While the relative comparison of variability, statistical powers, and necessary sample sizes seems robust to our modeling assumptions, this does not mean that regression calibration using a 24HR resolves the measurement error issue. While use of the 24HR is a step in the right direction and our results indicate how many such 24HRs are needed, it remains an interim approach until bona fide biomarkers become available for additional dietary components.
These findings provide insights for designing studies that include a measure of dietary intake, where the goal is to obtain the best possible estimate considering participant burden and cost. Recalls can now be inexpensively self-administered electronically, but how many we can reasonably expect participants to complete and with what level of quality remains uncertain. One study of volunteers showed a willingness to complete 8 or more nonconsecutive automated recalls, with a general but inconsistent decline in mean energy estimates with successive recalls (16). This decline in energy reporting has also been found using multiple consecutive days of food records (30, 31). To date, the Automated Self-Administered 24-Hour Recall is being used in more than 40 studies in multiple populations; results and experiences from these studies should elucidate issues of data quality, drop-off, and utility. Further studies are planned to compare the Automated Self-Administered 24-Hour Recall with interviewer-administered recalls and to validate the Automated Self-Administered 24-Hour Recall in a controlled feeding study and against recovery biomarkers. Finally, although electronic instruments are widely available, some burden exists for researchers who must set up their studies and contact, monitor, and support participants across assessments.
Our findings further illustrate previous findings (1–4) indicating that FFQs alone contain substantial measurement error which might hamper the ability to detect diet-disease associations. However, these findings also show that FFQs contribute important information in combination with 24HR data, especially for episodically consumed foods or nutrients. The critical question, however, is whether researchers can expect participants to complete an FFQ and 4–6 recalls. Is there a point at which the gain in accuracy is offset by the loss of participants due to excess burden? These are questions to be answered by the future studies of new dietary assessment technologies such as those previously mentioned. Such information will further assist in forming recommendations for measuring dietary intakes in future research.
Our findings may aid investigators in refining estimates of how many recalls to administer or whether or not to include an FFQ. For nutrients and foods consumed nearly daily by most people, such as fats or carbohydrates, one could argue that adding an FFQ to two 24HRs is worth the burden, but not for 4–6 24HRs, given the relatively small improvement expected. However, for an episodically consumed nutrient or food group like dark green vegetables, an FFQ alone is better than up to nine 24HRs, so there may be no need to administer any recalls. For cohort studies, however, investigators almost never limit the scope to selected foods or nutrients, suggesting the need to include both 24HRs and FFQs.
We have not addressed whether food records might substitute for recalls as the primary diet assessment instrument in large studies. Although records are known to be problematic in terms of reactivity, theoretically they do not suffer from the memory limitations of 24HRs (if completed throughout the reporting day as opposed to the end of a reporting day). The high costs of administering and coding food records pose a barrier to their use in large studies. However, investigators in 2 different cohort studies have successfully collected baseline food records, later selectively coding and analyzing them within a nested case-control design (8, 9). Both found statistically significant diet-disease relations with food records but not with an FFQ. While we have analyzed multiple 24HRs here, our statistical methods could be, and should be, applied to multiple food records. In addition, newer food record tools that include digital photography may greatly improve portion-size estimates and may better facilitate real-time recording. It remains unclear how the strengths, limitations, and biases of each of these tools will affect the bottom line in determining what is optimal in terms of quality, expense, practicality, and burden.
Supplementary Material
Acknowledgments
Author affiliations: Department of Statistics, College of Science, Texas A&M University, College Station, Texas (Raymond J. Carroll); Gertner Institute for Epidemiology, Tel Hashomer, Israel (Laurence S. Freedman); Division of Cancer Prevention, National Cancer Institute, Bethesda, Maryland (Douglas Midthune, Marina Shumakovich, Victor Kipnis); Applied Research Program, Division of Cancer Control and Population Sciences, National Cancer Institute, Bethesda, Maryland (Amy F. Subar); and Nutritional Epidemiology Branch, Division of Cancer Epidemiology and Genetics, National Cancer Institute, Bethesda, Maryland (Frances E. Thompson).
Dr. Raymond J. Carroll’s research was supported by a grant (R37-CA057030) from the National Cancer Institute. Dr. Carroll was also supported by Award KUS-CI-016-04 from the King Abdullah University of Science and Technology. Dr. Laurence S. Freedman was supported by the National Institutes of Health (under contract HHSN261200633000).
Conflict of interest: none declared.
Glossary
Abbreviations
- EATS
Eating at America’s Table Study
- FFQ
food frequency questionnaire
- 24HR
24-hour dietary recall
- MPED
My Pyramid Equivalents Database
- OPEN
Observing Protein and Energy Nutrition
APPENDIX
Relation of R2 and variability of the estimated risk parameter
We have . Thus, and
Let be the variance of E(T|C). Let π1 = Pr(D = 1). Based on a sample of size n, the supplementary material to the article by Kipnis et al. (26) shows that if c = {π1(1 − π1)}−1, then is approximately normally distributed with mean αT and Thus,
Power comparisons
The power of the test with Type I error 5% for testing whether αT = 0 is given as
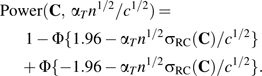 |
(3) |
To understand the effect on power of using the FFQ, multiple 24HRs, or both, we first take a reference design, namely 12 24HRs plus the FFQ, which we call Cref. Notice that in equation 3, the power depends only on and on , the latter of which is determined by the design. In the reference design, we set βref so that we achieve 90% power, i.e., solved 0.90 = Power(Cref, βref). Then, the power for any other combination C of FFQ and multiple 24HRs is Power(C, βref).
Sample size comparisons
We can also use equation 3 to compare the relative sample size needed to obtain a fixed power, say 90%. For any combination of FFQ and multiple 24HRs, find β so that 0.90 = Power(C, β). Then, the percentage increase or decrease for using this combination compared with the reference combination is simply
| (4) |
References
- 1.Subar AF, Kipnis V, Troiano RP, et al. Using intake biomarkers to evaluate the extent of dietary misreporting in a large sample of adults: The OPEN Study. Am J Epidemiol. 2003;158(1):1–13. doi: 10.1093/aje/kwg092. [DOI] [PubMed] [Google Scholar]
- 2.Kipnis V, Subar AF, Midthune D, et al. Structure of dietary measurement error: results of the OPEN biomarker study. Am J Epidemiol. 2003;158(1):14–21. doi: 10.1093/aje/kwg091. [DOI] [PubMed] [Google Scholar]
- 3.Neuhouser ML, Tinker L, Shaw PA, et al. Use of recovery biomarkers to calibrate nutrient consumption self-reports in the Women’s Health Initiative. Am J Epidemiol. 2008;167(10):1247–1259. doi: 10.1093/aje/kwn026. [DOI] [PubMed] [Google Scholar]
- 4.Schatzkin A, Kipnis V, Carroll RJ, et al. A comparison of a food frequency questionnaire with a 24-hour recall for use in an epidemiological cohort study: results from the biomarker-based Observing Protein and Energy Nutrition (OPEN) Study. Int J Epidemiol. 2003;32(6):1054–1062. doi: 10.1093/ije/dyg264. [DOI] [PubMed] [Google Scholar]
- 5.Freedman LS, Schatzkin A, Midthune D, et al. Dealing with dietary measurement error in nutritional cohort studies. J Natl Cancer Inst. 2011;103(14):1086–1092. doi: 10.1093/jnci/djr189. [DOI] [PMC free article] [PubMed] [Google Scholar]
- 6.Kolar AS, Patterson RE, White E, et al. A practical method for collecting 3-day food records in a large cohort. Epidemiology. 2005;16(4):579–583. doi: 10.1097/01.ede.0000165363.27323.ac. [DOI] [PubMed] [Google Scholar]
- 7.Kwan ML, Kushi LH, Song J, et al. A practical method for collecting food record data in a prospective cohort study of breast cancer survivors. Am J Epidemiol. 2010;172(11):1315–1323. doi: 10.1093/aje/kwq284. [DOI] [PMC free article] [PubMed] [Google Scholar]
- 8.Bingham SA, Luben R, Welch A, et al. Are imprecise methods obscuring a relation between fat and breast cancer? Lancet. 2003;362(9379):212–214. doi: 10.1016/S0140-6736(03)13913-X. [DOI] [PubMed] [Google Scholar]
- 9.Freedman LS, Potischman N, Kipnis V, et al. A comparison of two dietary instruments for evaluating the fat–breast cancer relationship. Int J Epidemiol. 2006;35(4):1011–1021. doi: 10.1093/ije/dyl085. [DOI] [PubMed] [Google Scholar]
- 10.Six BL, Schap TE, Zhu FM, et al. Evidence-based development of a mobile telephone food record. J Am Diet Assoc. 2010;110(1):74–79. doi: 10.1016/j.jada.2009.10.010. [DOI] [PMC free article] [PubMed] [Google Scholar]
- 11.Weiss R, Stumbo PJ, Divakaran A. Automatic food documentation and volume computation using digital imaging and electronic transmission. J Am Diet Assoc. 2010;110(1):42–44. doi: 10.1016/j.jada.2009.10.011. [DOI] [PMC free article] [PubMed] [Google Scholar]
- 12.Sun M, Fernstrom JD, Jia W, et al. A wearable electronic system for objective dietary assessment. J Am Diet Assoc. 2010;110(1):45–47. doi: 10.1016/j.jada.2009.10.013. [DOI] [PMC free article] [PubMed] [Google Scholar]
- 13.Subar AF, Thompson FE, Potischman N, et al. Formative research of a quick list for an automated self-administered 24-hour dietary recall. J Am Diet Assoc. 2007;107(6):1002–1007. doi: 10.1016/j.jada.2007.03.007. [DOI] [PubMed] [Google Scholar]
- 14.Subar AF, Crafts J, Zimmerman TP, et al. Assessment of the accuracy of portion size reports using computer-based food photographs aids in the development of an automated self-administered 24-hour recall. J Am Diet Assoc. 2010;110(1):55–64. doi: 10.1016/j.jada.2009.10.007. [DOI] [PMC free article] [PubMed] [Google Scholar]
- 15.Zimmerman TP, Hull SG, McNutt S, et al. Challenges in converting an interviewer-administered food probe database to self-administration in the National Cancer Institute Automated Self-administered 24-Hour Recall (ASA24) J Food Compost Anal. 2009;22(suppl 1):S48–S51. doi: 10.1016/j.jfca.2009.02.003. [DOI] [PMC free article] [PubMed] [Google Scholar]
- 16.Arab L, Wesseling-Perry K, Jardack P, et al. Eight self-administered 24-hour dietary recalls using the Internet are feasible in African Americans and whites: the Energetics Study. J Am Diet Assoc. 2010;110(6):857–864. doi: 10.1016/j.jada.2010.03.024. [DOI] [PMC free article] [PubMed] [Google Scholar]
- 17.Baranowski T, Beltran A, Martin S, et al. Tests of the accuracy and speed of categorizing foods into child vs professional categories using two methods of browsing with children. J Am Diet Assoc. 2010;110(1):91–94. doi: 10.1016/j.jada.2009.10.006. [DOI] [PMC free article] [PubMed] [Google Scholar]
- 18.Subar AF, Thompson FE, Kipnis V, et al. Comparative validation of the Block, Willett, and National Cancer Institute food frequency questionnaires: the Eating at America’s Table Study. Am J Epidemiol. 2001;154(12):1089–1099. doi: 10.1093/aje/154.12.1089. [DOI] [PubMed] [Google Scholar]
- 19.Agricultural Research Service, US Department of Agriculture. Design and Operation: the Continuing Survey of Food Intakes by Individuals and the Diet and Health Knowledge Survey, 1994–1996. Washington, DC: US Department of Agriculture; 1997. [Google Scholar]
- 20.Bowman SA, Friday JE, Moshfegh A. MyPyramid Equivalents Database, 2.0 for USDA Survey Foods, 2003–2004: Documentation and User Guide. Beltsville, MD: Beltsville Human Nutrition Research Center, Agricultural Research Service, US Department of Agriculture; 2008. ( http://www.ars.usda.gov/SP2UserFiles/Place/12355000/pdf/mped/mped2_doc.pdf). (Accessed December 20, 2011) [Google Scholar]
- 21.Subar AF, Midthune D, Kulldorff M, et al. Evaluation of alternative approaches to assign nutrient values to food groups in food frequency questionnaires. Am J Epidemiol. 2000;152(3):279–286. doi: 10.1093/aje/152.3.279. [DOI] [PubMed] [Google Scholar]
- 22.Prentice RL. Covariate measurement errors and parameter estimation in a failure time regression model. Biometrika. 1982;69(2):331–342. [Google Scholar]
- 23.Rosner B, Willett WC, Spiegelman D. Correction of logistic regression relative risk estimates and confidence intervals for systematic within-person measurement error. Stat Med. 1989;8(9):1051–1069. doi: 10.1002/sim.4780080905. [DOI] [PubMed] [Google Scholar]
- 24.Carroll RJ, Stefanski LA. Approximate quasilikelihood estimation in models with surrogate predictors. J Am Stat Assoc. 1990;85(411):652–663. [Google Scholar]
- 25.Carroll RJ, Ruppert D, Stefanski LA, et al. Measurement Error in Nonlinear Models: A Modern Perspective. New York, NY: Chapman & Hall, Inc; 2006. [Google Scholar]
- 26.Kipnis V, Midthune D, Buckman DW, et al. Modeling data with excess zeros and measurement error: application to evaluating relationships between episodically consumed foods and health outcomes. Biometrics. 2009;65(4):1003–1010. doi: 10.1111/j.1541-0420.2009.01223.x. [DOI] [PMC free article] [PubMed] [Google Scholar]
- 27.Freedman LS, Guenther PM, Dodd KW, et al. The population distribution of ratios of usual intakes of dietary components that are consumed every day can be estimated from repeated 24-hour recalls. J Nutr. 2010;140(1):111–116. doi: 10.3945/jn.109.110254. [DOI] [PMC free article] [PubMed] [Google Scholar]
- 28.Freedman LS, Guenther PM, Krebs-Smith SM, et al. A population’s distribution of Healthy Eating Index-2005 component scores can be estimated when more than one 24-hour recall is available. J Nutr. 2010;140(8):1529–1534. doi: 10.3945/jn.110.124594. [DOI] [PMC free article] [PubMed] [Google Scholar]
- 29.Dodd KW, Guenther PM, Freedman LS, et al. Statistical methods for estimating usual intake of nutrients and foods: a review of the theory. J Am Diet Assoc. 2006;106(10):1640–1650. doi: 10.1016/j.jada.2006.07.011. [DOI] [PubMed] [Google Scholar]
- 30.Gersovitz M, Madden JP, Smiciklas-Wright H. Validity of the 24-hr. dietary recall and seven-day record for group comparisons. J Am Diet Assoc. 1978;73(1):48–55. [PubMed] [Google Scholar]
- 31.Rebro SM, Patterson RE, Kristal AR, et al. The effect of keeping food records on eating patterns. J Am Diet Assoc. 1998;98(10):1163–1165. doi: 10.1016/S0002-8223(98)00269-7. [DOI] [PubMed] [Google Scholar]
Associated Data
This section collects any data citations, data availability statements, or supplementary materials included in this article.