

Abstract
Dynamic RNA molecules carry out essential processes in the cell including translation and splicing. Base-pair interactions stabilize RNA into relatively rigid structures, while flexible non-base-paired regions allow RNA to undergo conformational changes required for function. To advance our understanding of RNA folding and dynamics it is critical to know the flexibility of these un-base-paired regions and how it depends on counterions. Yet, information about nucleic acid polymer properties is mainly derived from studies of ssDNA. Here we measure the persistence lengths (lp) of ssRNA. We observe valence and ionic strength-dependent differences in lp in a direct comparison between 40-mers of deoxythymidylate (dT40) and uridylate (rU40) measured using the powerful combination of SAXS and smFRET. We also show that nucleic acid flexibility is influenced by local environment (an adjoining double helix). Our results illustrate the complex interplay between conformation and ion environment that modulates nucleic acid function in vivo.
Keywords: single molecule FRET, small angle X-ray scattering, worm-like chain, ion–nucleic acid interactions
Nucleic acids in the cell are dynamic and undergo structural changes as they transmit and process genetic information. Dynamic processes related to biological function (e.g., transcription for DNA and recognition and folding for RNA) involve non-base-paired regions that confer flexibility to the overall structure. For RNAs like riboswitches that exchange between multiple structures in equilibrium (1), conformational disorder is often an intrinsic property of the molecule and important for biological function. Even relatively stable molecules like catalytic introns and transfer RNA must pass through a disordered phase while folding. Thus, progress toward a mechanistic understanding of RNA folding and dynamics will require detailed knowledge of nucleic acid chain flexibility and its dependence on base content, solution conditions, and molecular context.
In light of its importance to biology, it is surprising that RNA flexibility has not been studied in as much detail as DNA flexibility. Despite the chemical similarity of the RNA and DNA backbone, there is ample evidence from X-ray crystallography that the identity of the sugar (ribose vs. deoxy-ribose) affects backbone conformations (2). However, researchers have used the properties of DNA to understand RNA folding (3) because corresponding information for RNA was lacking. This difficulty motivates our present efforts to measure and directly compare the flexibilities of single-stranded nucleic acids (ssRNA and ssDNA).
In the cell, RNA and DNA interact with cations that screen the negatively charged phosphate backbone. Both diffuse and specifically bound ions are important for RNA folding (4), and divalent ions are almost always required to stabilize RNA tertiary structures (5–8). A full mechanistic description of these ion effects is complicated by the fact that ions can interact with RNA differently during various stages of folding (9, 10). The interactions between ions and ordered nucleic acid structures have been characterized theoretically and experimentally (e.g., refs. 11–16). However, a comparable analysis for the flexible and disordered regions is hampered by the lack of detailed knowledge of backbone conformations in solution and how these depend on base content, sugar type, and salt ions present.
Previous measurements of flexible single-stranded nucleic acids using fluorescence correlation spectroscopy (FCS) (17), single molecule Förster resonance energy transfer (smFRET) (18, 19), and force spectroscopy (20–23) have not provided a consensus picture of backbone conformations. These studies use a variety of nucleic acid constructs (of varying composition and length, with or without molecular handles or fluorescent tags) and interpret data with different models and starting assumptions. Equilibrium structural measurements of disordered macromolecules are inherently problematic when one tries to describe a large ensemble of structures with just a few experimental variables. This difficulty is found in the protein folding literature, where small angle X-ray scattering (SAXS) and smFRET measurements of denatured state collapse appear irreconcilable (24–26). This highlights the need for studies of disordered macromolecules that not only apply multiple complementary techniques to the same system but, more importantly, interpret these results using the same models and assumptions.
The worm-like chain (WLC) model (27) is a commonly used model providing convenient analytical functions that relate experimental observables like smFRET efficiencies (28) and SAXS curves (29) to underlying polymer properties. In this model, the polymer is described as a chain of fixed length (L) that is continuously flexible. The stiffness of the chain is parameterized by its persistence length (lp). This is the characteristic length scale over which the chain maintains a certain direction. Various polyelectrolyte theories in the context of the WLC have been developed (30–33), but in general they describe the measured persistence length lp as the sum of two components: (i) an intrinsic stiffness due to chain properties (l0) and (ii) electrostatic repulsion within the chain (lel). In this report, the term “flexibility” will refer to the apparent persistence length lp, which is a sum of the intrinsic (l0) and the electrostatic (lel) components (lp = l0 + lel). Our choice of the WLC model to describe ssDNA and ssRNA was motivated not only by the presence of tractable analytical relations but also by its extensive use in previous fluorescence-based studies of ssDNA (17–19), which allows us to put our findings in the context of previous studies.
Here, we provide a direct comparison of the properties of ssDNA and ssRNA in solution. The powerful combination of SAXS and smFRET reveals important structural information about dT40 and rU40, nucleic acid chains that undergo minimal stacking interactions. The FRET efficiency and the full SAXS curve are consistent with the WLC model for flexible polymers. We show that ssRNA and ssDNA chains differ in both flexibility and spatial extent. This difference is likely to influence their molecular recognition and folding properties and has the potential to further our understanding of the different roles played by DNA and RNA in cells. By using smFRET over a wide range of Mg2+ and Na+ concentrations, we find that the apparent charge screening efficiency of Mg2+ is anomalously large compared to Na+ in both ssRNA and ssDNA; comparable to previously measured ratios for double-stranded DNA (34). The strong interaction between Mg2+ and unfolded nucleic acids challenges our understanding of how ions influence the folding process.
Results
Compaction of dT40 and rU40 in MgCl2 and NaCl Revealed by smFRET.
To compare the flexibilities of dT40 and rU40, we measured the FRET-averaged end-to-end distance,  , at varying concentrations of NaCl using smFRET for freely diffusing molecules. The efficiency of energy transfer (EFRET) between Cy3 and Cy5 attached to the 3′ and 5′ ends of the nucleic acid chains was measured and converted to
  using experimentally measured values of Förster radius R0 (see Materials and Methods for details). FRET efficiency (EFRET) histograms from smFRET of dT40 and rU40 at all conditions contained one peak, indicating that conformational fluctuations take place on time scales much faster than the dwell time of the molecule in the observation volume (approximately 500 μs). This is consistent with other studies directly measuring the end-to-end contact rates in poly-dT (35).
As expected,  values of both dT40 (filled circles) and rU40 (unfilled circles) decreased with increased salt concentration as excess cations reduced repulsion along the negatively charged backbone (Fig. 1A).
  of both nucleic acids were indistinguishable at NaCl concentrations below 400 mM, but above 400 mM dT40 has a smaller
  than rU40. Assuming that lel goes to zero at high ionic strengths, the observed divergence of end-to-end distance in high salt concentrations indicates differences in the intrinsic flexibilities (l0) of dT40 and rU40.
Fig. 1.

The FRET-averaged end-to-end distance,  was calculated from measured values of the Förster radius R0 and the average FRET efficiencies EFRET for dT40 (filled) and rU40 (unfilled) in NaCl (Left) and MgCl2 (Right). Error bars are standard errors from combined uncertainties in R0 and EFRET. The decrease in end-to-end distance is expected as excess cations screen the negatively charged nucleic acid backbone, resulting in greater chain flexibility at high salt. While rU40 and dT40 are the same within error up to approximately 200 mM NaCl, they diverge at high salt, with dT40 appearing more compact. Similar trends are observed in Mg (Right).
To compare the charge screening efficiency of monovalent and divalent cations, we also measured  of dT40 and rU40 in the presence of increasing concentrations of MgCl2, as shown in Fig. 1B. Similar to its behavior in NaCl,
  of both dT40 and rU40 decreased as the concentration of MgCl2 increased. At the same ionic strength, both dT40 and rU40 had a smaller
  in Mg2+ than in Na+, indicating that the nucleic acids were more collapsed in Mg2+ than in Na+.
We investigated the effect of local environment on the flexibility of the single-stranded nucleic acid by measuring  of dT40 with an 18-mer double-stranded helix attached to one end (dT40-duplex; see inset of Fig. 2) at different NaCl concentrations. Compared to the single-stranded dT40, the presence of a helix at one end of the dT40 chain results in a larger
  . This indicates that the conformation of the nucleic acid chain is very sensitive to the local environment and the presence of a helix can cause the dT40 chain to appear more extended.
Fig. 2.

The presence of an attached duplex changes the measured flexibility of ssDNA. The 40-mer construct with (dT40-duplex, triangles) and without (dT40, circles) an attached 18-bp duplex DNA exhibit different smFRET-averaged end-to-end distances,  , at all NaCl concentrations measured. This indicates that the duplex excludes the single-stranded chain from its vicinity and may explain the discrepancy between our smFRET measurements of freely diffusing dT40 and previous studies using tethered DNA that report more extended chains.
Determination of WLC Model Parameters for dT40 and rU40 Using smFRET and SAXS data.
While it is clear from smFRET measurements that dT40 and rU40 have different properties and that Mg2+ is more effective at charge screening than Na+ at the same ionic strength, further interpretation of the FRET data requires a model for the end-to-end distance distribution. The WLC model uses two parameters to specify this distribution: (i) the contour length, L, and (ii) the persistence length lp. The fact that smFRET measures only one parameter (the FRET efficiency) means that additional information is required to define the polymer properties. For the same reason, the FRET efficiency cannot be used to determine whether WLC is an appropriate model. To address both concerns, we additionally performed SAXS measurements of dT40 and rU40 at 100 mM NaCl and asked whether the WLC model could account for the entire scattering curve in addition to the smFRET data.
The SAXS and smFRET data at 100mM NaCl were fit simultaneously to the WLC model for each nucleic acid using nonlinear optimization. Semianalytical methods were used to calculate the FRET efficiency (19) and scattering curve (29) from model parameters (see Materials and Methods). The WLC scattering curves are in excellent agreement with the SAXS data while predicting the FRET data within the experimental uncertainty (Fig. 3A). The values of L and lp that allowed the WLC model to fit the experimental data to at least 95% confidence are shown by the shaded ellipses in Fig. 3B. These acceptable values for dT40 and rU40 are represented by nonoverlapping regions in L - lp space, confirming that rU and dT have significantly different flexibilities despite having similar  at low ionic strength.
Fig. 3.

(A) SAXS curves for 75 μM dT40 (circles) and rU40 (triangles) in 100 mM NaCl are shown together with a WLC model for the scattering (solid lines) that optimizes the fit to SAXS data and smFRET data ( for both rU and dT). Experimental uncertainties were used as weights in the fit. The best-fit values of L and lp predict
  values of 68.0 Å for dT and 67.2 Å for rU. The WLC scattering curves include an overall scale factor and an additional free parameter, Rcs, to correct for finite molecular cross-section (see Materials and Methods) equal to 4.2 Å for rU and 3.7 Å for dT. In the inset (B), the persistence length lp and the contour length L of each WLC are shown as symbols with ellipses that enclose the 95% confidence interval. The nonoverlapping ellipses show that dT40 and rU40 are described by WLCs with significantly different properties: dT40 has a longer L and a shorter lp than rU40. The cartoon depictions of ssDNA (C) and ssRNA (D) illustrate this difference: the RNA chain is drawn with a shorter distance between monomers and a less flexible backbone.
The Ion-Dependent Flexibilities of rU and dT.
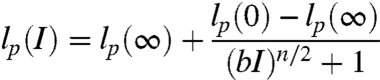
The WLC model with best-fit contour lengths, L = 196.4 Å and L = 225.6 Å for rU40 and dT40, respectively, was used to convert  (Fig. 1) to lp over a wide range of ionic conditions corrected for activity (36) in Fig. 4. The ionic strength (I) dependence of lp of each nucleic acid is well described by a phenomenologically derived function,
 |
[1] |
The equation satisfies the requirements of (i) a power-law limiting behavior at high ionic strength (I≫b-1) of lp(I) - lp(∞) ∼ I-n/2 predicted from polyelectrolyte theories where the electrostatic contribution to persistence length lel depends on the Debye screening length κ-1 ∼ I-1/2 as lel ∼ κ-n and (ii) a finite persistence length in no excess salt. The parameter, b, represents the charge screening efficiency and is equal to the inverse of the ionic strength at the midpoint between the most extended and compact states of the molecule. We fit our measured values of  to Eq. 1 to obtain b, n, lp(∞), and lp(0) in both Na+ and Mg2+. We also imposed the condition that lp(∞) and lp(0) values for rU40 or dT40 had to be the same in both salts but could vary between the nucleic acids. These results are shown in Fig. 4.
Fig. 4.

The ionic strength dependence of the persistence length (lp) for dT40 (Left) and rU40 (Right) is different in the presence of monovalent NaCl (filled symbols) and divalent MgCl2 (unfilled symbols). The x-axis is the activity corrected ionic strength and is represented on a logarithmic scale. Solid lines indicate fits to a phenomenological model for the ionic strength dependence (see Eq. 1). For dT40: bNa+ = 5.83 ± 0.53 M-1, bMg2+ = 168 ± 23 M-1, lp(∞) = 7.5 ± 0.5 Å, lp(0) = 20.9 ± 0.5 Å . For rU40: bNa+ = 6.86 ± 0.71 M-1, bMg2+ = 264 ± 30 M-1, lp(∞) = 10.1 ± 0.6 Å, lp(0) = 25.2 ± 0.4 Å. The scaling exponent, n, is shown in the figure.
Discussion
Using two complementary methods, SAXS and smFRET, we observe that dT40 and rU40 have significantly different conformations in solution. This is evident from the smFRET data at high ionic strengths, where electrostatic repulsion is expected to be mostly screened by the ions and thus  reflects the intrinsic backbone flexibility. This difference between rU and dT can also be seen when SAXS and smFRET data for the two nucleic acids in 100 mM NaCl are used to constrain the WLC model. In this case, RNA and DNA are best described by two significantly different worm-like chains, as illustrated in Fig. 3.
Our finding that rU40 has a shorter L and longer lp is consistent with how chemical differences between the nucleic acids are known to affect backbone conformations. Sugar pucker can influence the interphosphate distance between adjacent bases, with C′3 endo producing a more compressed backbone than C′2 endo (37). NMR studies have shown that the sugar pucker in poly(dT) is predominantly in the C′2 endo state (38) while poly(rU) is a 44∶56 mixture of C′2 endo and C′3 endo (39). Thus, we expect rU40 to have a shorter contour length. Also, while rU40 is known to undergo the least stacking among the ribonucleotides, there is some evidence that rU40 does in fact take part in some base stacking (39, 40). We believe that base stacking in poly(rU) but not in poly(dT) may cause rU40 to be more rigid than dT40. Ultimately, both sugar pucker and base stacking effects have the consequence of making rU40 shorter and stiffer than dT40.
Published literature on the flexibilities of ssDNA and ssRNA reveals a rather large range of persistence lengths that span 10–60 Å, measured using different techniques under a variety of conditions (17, 18, 41, 42). While our measurements of lp (11–22 Å for dT40) fall within this range, they are on the low end even when compared to similar studies using smFRET. Perhaps most meaningful is a comparison to ref. 19, a work that not only measured the EFRET of dT40 tethered to a glass surface at the same ionic strengths using smFRET but also used a similar WLC analysis. Interestingly, the authors found that lp was 15–30 Å between 0 and 2 M NaCl, which is consistently approximately 50% higher than our values over the entire range of ionic strength. Our measurements of dT40-duplex show why this difference might arise (Fig. 2). The presence of a highly charged duplex nearby, like the double-stranded tether used to immobilize the ssDNA, can affect the  measured. The strong electrostatic repulsion from the duplex could reduce the space available to the single strand by electrostatic excluded volume (13) or by stiffening the chain in the vicinity of the duplex. Our measurements of dT40, unencumbered by the repulsion of the duplex, find a shorter lp, a lower
  , and a more compact chain. Interestingly, our values for dT40-duplex do not completely recover the values observed in ref. 19, indicating that surface effects may also play a role. Our results indicate that the effect of the tether, and possibly that of the glass surface nearby, can have a strong effect on chain properties, and they highlight the extra care that experimenters should take when interpreting results from tethered molecules. The observation that polymer conformations can be perturbed by adjoining duplexes also has implications for our understanding of biologically relevant nucleic acids, which are often made up of interspersed regions of unpaired and paired bases.
The differences in chain conformations in the presence of Na+ or Mg2+ can be explained in terms of nucleic acid–ion interactions. For both RNA and DNA, we find that Mg2+ is approximately 20–40 times more efficient at charge screening than Na+ in terms of ionic strength (60–120 times in terms of cation concentration). This relative screening efficiency agrees well with the approximately 17–83 times observed in single molecule force spectroscopy of chemically denatured ssDNA (21), although it disagrees with predictions from Debye–Hückel (DH) theory that screening efficiency should be determined solely by ionic strength. We have also previously measured the repulsion between 25 bp duplex DNA in Na+ and Mg2+and found that 3 mM MgCl2 had the equivalent screening effect as 150 mM NaCl (34), which yields an ionic strength ratio of approximately 17.
Polyelectrolyte theories for charged WLCs in salt solutions predict a general power-law dependence of the electrostatic component of the persistence length on the Debye screening factor. The value of the scaling exponent, n, varies from 1 to 2 depending on the assumptions of the model. Theoretical work from Ha and Thirumalai (32) shows unambiguously which scaling theories apply depending on the relative length scales in the problem (l0 and the charge spacing, d). Assuming l0 = lp(∞) and d = L/40, ssDNA and ssRNA should behave like flexible polyelectrolytes with electrostatic persistence lengths given by the Odijk–Skolnick–Fixman (OSF) (30, 31) theory (n = 2) above approximately 60 mM ionic strength. We observe a crossover to power-law scaling around this point for NaCl (i.e., 1/d). The predicted power-law exponent of n = 2 agrees with our data for dT40 in NaCl (n = 2.01 ± 0.17) but differs for rU in NaCl (n = 1.62 ± 0.13) and for dT and rU in MgCl2 (n = 1.52 ± 0.22 and n = 1.43 ± 0.14, respectively).
The non-OSF scaling of rU40 in NaCl, and of both nucleic acids in MgCl2, may indicate that more complex ion–nucleic acid interactions are important for charge screening in these systems. The OSF theory is based on the DH approximation for electrostatic interactions. This approximation breaks down when high charge densities and discrete ion effects become important. Netz and Orland (43) go beyond DH theory and show that salt-dependent charge renormalization can lead to an apparent scaling exponent that becomes less ideal (smaller) for chains with higher linear charge density. Intriguingly, we observe n < 2 for rU but not for dT, a trend that is consistent with the charge renormalization theory given our measurement of a shorter phosphate distance in rU. Divalent ions are also expected to show a stronger charge renormalization effect than monovalent ions. Accordingly, we observe a decrease in n in the presence of Mg2+ for both nucleic acids. While this intruiging result agrees with intuition from theory, it is worth noting that apparent n < 2 scaling can also be caused by excluded volume effects and finite chain length (44). Thus, elucidation of the precise mechanism of electrostatic relaxation of rU and dT will require further study.
To parameterize the equilibrium distribution of chain conformations, we relied exclusively on the WLC model. In this study, the use of WLC is justified by the excellent agreement with experimental SAXS curves in 100 mM NaCl and corresponding FRET data for both dT40 and rU40. One weakness of WLC is its neglect of excluded volume effects that can influence chain dimensions, particularly for longer chains. FCS measurements of poly(dT) up to 100 nucleotides show non-Gaussian scaling in 10 mM NaCl (17). Furthermore, excluded volume considerations were essential in interpreting the force-extension behavior of comparatively long ssDNA at low ionic strengths (45). An analytical approach that combined electrostatics and excluded volume was successful in describing FRET data from charged proteins in denaturing salts (46). Atomistic modeling of highly charged, disordered proteins in monovalent salt has also shown good agreement with FCS data (47). We anticipate that both analytical and atomistic techniques will improve modeling of biologically relevant ssRNA and ssDNA. Complementary techniques including SAXS and smFRET will be invaluable in this effort to build better models going forward.
Conclusions
A combination of SAXS and smFRET revealed conformational differences between model single-stranded nucleic acids lacking secondary structure (dT40 and rU40). In 100 mM NaCl, we showed that while rU40 and dT40 resemble WLCs, rU40 has shorter contour length (L) and longer persistence length (lp) than dT40. Applying this model to smFRET data, we find that rU40 has longer lp than dT40 in Mg2+ and Na+ at all ionic strengths measured. Furthermore, for both nucleic acids, we find that one needs 20–40 times lower ionic strength of MgCl2 than NaCl to achieve the same chain compaction. Similarly, we probed the effect of the local environment on chain flexibility, showing that the presence of a flanking double-stranded helix affects the conformation of the single-stranded region. This has implications for biologically relevant nucleic acids with interspersed regions of paired and unpaired bases. In the future, this work will be extended by introducing different bases or mixed sequences to understand the effect of base stacking on chain flexibility. The difference in lp between ssRNA and ssDNA and the dramatic ion dependence of conformation are likely to affect folding and interactions with binding partners in the cell.
Materials and Methods
Preparation of RNA and DNA Samples.
All nucleic acid samples were synthesized and HPLC purified (Integrated DNA Technologies Inc.). For smFRET experiments, dT40 and rU40 were also labeled by the vendor with Cy3 and Cy5 fluorophores on the 3′ and 5′ ends respectively (Cy3-dT40-Cy5 and Cy3-rU40-Cy5). For experiments on the effect of an attached double helix, two separate strands (3′-ACCGCTGCCGTCGCTCCG-Cy5-5′ and 3′-Cy3-dT40-CGGAGCGACGGCAGCGGT-5′) were mixed in 1∶1 ratio in pH 8 20 mM Tris buffer and annealed for 2 min at 95 °C (dT40-duplex). For SAXS experiments, dT40 and rU40 were resuspended in TE buffer at pH 7.5. Samples were buffer exchanged against 1 mM Na-MOPS at pH 7.0 with 100 mM NaCl. The concentration of nucleic acids in each sample was determined using absorption at 260 nm (Cary 50, Varian Inc.), and a concentration series (30, 75, and 150 μM) was made by dilution.
SmFRET experiments were performed in eight-chambered coverglass slides (Labtek, Nunc) that had been preincubated with 0.1% bovine serum albumin (BSA) solution for at least 2 h and then washed with deionized water to remove the unbound BSA. SmFRET experiments were conducted with varying amounts of NaCl and MgCl2, while the concentrations of the nucleic acids used were approximately 100 pM to ensure that at most only one molecule was in the focal volume at any time.
Single Molecule FRET for Freely Diffusing Molecules.
FRET measurements were performed in a standard confocal setup. Briefly, a 532-nm continuous wave laser is directed through a beam expander into an Olympus IX71 inverted microscope. A 60x UPlan-Apochromat objective focuses the beam down to a tight focal spot in the Nunc-tek sample chamber. The fluorescence is collected back from the same objective and separated from the excitation beam by a 550 LP filter. The donor and acceptor fluorescence were further separated by a 660-LP filter, and 570/40- and 670/40-LP filters in the donor and acceptor channels, respectively, were put in to reduce cross talk and scatter of laser excitation light. Donor and acceptor fluorescence were separately collected through two 50-μm single-mode optical fibers from OZ Optics and detected by two single photon counting avalanche photodiodes from Perkin–Elmer Inc. (AQ-SPCM). A Flex-2kD correlator card (Correlator.com) in the Photon Counting mode samples the photon counts at 25-ns intervals and sends the data to a computer to be saved. Photon traces of each sample were recorded in 30 1-min segments for a total of 30 min.
Photon traces were analyzed by a MATLAB algorithm written in-house. Briefly, photon counts in the donor, acceptor and total (sum of donor and acceptor) channels were binned into 1-ms time bins, with the size of the bins selected to be longer than the average residence time of a molecule in the focal volume (approximately 500 μs). Individual molecules diffusing through the focal volume then appear as spikes in the intensity trace over time. To identify a single-molecule event and eliminate events due to donor-labeled-only molecules, bins were only selected when the donor, acceptor, and total photon counts individually exceeded a threshold set for each of the channels. Corrections for background, fluorescence bleedthrough, differences in quantum yields, and detector efficiencies were performed before the apparent FRET efficiency Eapp was calculated. A population histogram of Eapp values was then fit with a Gaussian distribution so that the peak position of the histogram yielded the average Eapp value.
Measurement of the Förster Radii for Cy3-Cy5 Labeled rU and dT.
In order to make quantitative calculations of the separation between the 3′ and 5′ ends by FRET ( ), we have to accurately measure the Förster radius R0 (48) of the Cy3-Cy5 pair. It is possible that the photophysical properties of Cy3 and Cy5 are different when they are attached to different nucleic acids (dT vs. rU), giving rise to different R0 in ssDNA and ssRNA, and hence a different calculated
  . To verify that this was not the case, we measured R0 using singly labeled dT10 and rU10. The quantum yields of the Cy3-labeled nucleotides were measured against a Rhodamine 101 calibration standard. The quantum yields and the spectral overlap of the fluorophores were measured on a spectrophotometer (CaryWinUV, Agilent Technologies) and a fluorimeter (PTI Inc.). We observed that while there were no differences in the spectral overlap of the two fluorophores when labeled to different nucleic acids, Cy3-rU10 (QY = 0.181 ± 0.011) had a lower quantum yield than Cy3-dT10 (QY = 0.205 ± 0.006). Because R0 depends on QY1/6, this resulted in a less than 3% difference in R0 between ssDNA and ssRNA. We used our experimentally derived R0 values of 56.4 ± 0.3 Å for dT40 and 55.0 ± 0.6 Å for rU40 in all our calculations of
  .
.
SAXS Experiment and Data Reduction.
SAXS data were acquired at the Cornell High Energy Synchrotron Source (CHESS) C1 beamline at 15.1 keV with a sample-detector distance of approximately 1 m. The DNA/RNA and background (dialysis buffer) samples were held at 22 ± 1 °C in a 3-mm path length cell with Si3N4 windows. For each sample, 8 exposures of 10 s duration were recorded using a fiber-coupled CCD (49) and normalized by the incident intensity measured with a He ion chamber just before the sample. Images were azimuthally averaged and checked for time-dependent changes that might indicate radiation damage. Scattering angle was converted to momentum transfer (q = 4π sin(2θ/2)/λ) using the diffraction ring from a Silver stearate standard. For each image, the standard errors in intensity, ΔI(qi), were estimated using the standard deviation σi among the Ni pixels in each qi bin as  (for our detector geometry, Ni≥100 with 120 bins). Errors were propagated through subsequent averaging, buffer subtraction, and scaling operations.
Because single-stranded DNA is an extended, highly charged molecule, careful attention was paid to interparticle interference effects resulting from electrostatic repulsion. For data taken in each solution condition, SAXS curves at three DNA concentrations were matched at high q (0.1 ≤ q ≤ 0.35 Å-1) where interparticle interference effects are small and the low q (q < 0.1 Å-1) region was compared. Interparticle interference was found to be negligible (within error) at a concentration of 75 μM for both RNA and DNA in 100 mM NaCl.
Simultaneous SAXS-smFRET Fit to the WLC model.
X-ray scattering curves were generated from the WLC model without excluded volume effects using a semianalytical form factor, IWLC(q,L,lp) (29). To account for the finite thickness of the nucleic acid, the scattering function was modified by a cross-sectional scattering factor and is given by:  where
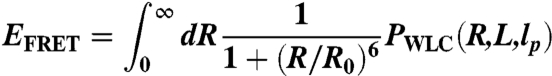
where  is the mean squared radius of gyration of the cross section. WLC parameters L and lp were converted into FRET efficiency using the theoretical end-to-end distance distribution function, PWLC(R,L,lp), (19, 28)
 |
[2] |
and the FRET-averaged end-to-end distance was calculated using  .
.
In order to fit SAXS and smFRET data simultaneously to the WLC model, we minimized a combined χ2 function consisting of the SAXS curve and FRET efficiency with weights given by our best estimate of experimental uncertainties. For SAXS, the ΔI(qi) were propagated through the data reduction procedure, and for smFRET, an uncertainty of 2.2% was consistent with the standard deviation between independent measurements. The best-fit parameters lp, Rcs, L, and I0 were found using nonlinear least squares (NLINFIT function in MATLAB). Confidence intervals were calculated from the estimated covariance matrix (50).
Acknowledgments.
We thank Joshua M. Tokuda, Syed S. Ahsan, Joshua M. Blose, Li Li, Chris D. Jones, Ken D. Finkelstein, and the Cornell High Energy Synchrotron Source (CHESS) staff for experimental assistance. This research is supported by National Institutes of Health (NIH) Grants R01-GM085062 and T32-GM008267 and the Cornell Nanobiotechnology Center. CHESS is supported by the National Science Foundation (NSF) and NIH/National Institute of General Medical Sciences under NSF award DMR-0225180.
Footnotes
The authors declare no conflict of interest.
References
- 1.Mandal M, Breaker RR. Gene regulation by riboswitches. Nat Rev Mol Cell Biol. 2004;5:451–463. doi: 10.1038/nrm1403. [DOI] [PubMed] [Google Scholar]
- 2.Murray LJW, Arendall WB, Richardson DC, Richardson JS. RNA backbone is rotameric. Proc Natl Acad Sci USA. 2003;100:13904–13909. doi: 10.1073/pnas.1835769100. [DOI] [PMC free article] [PubMed] [Google Scholar]
- 3.Schlatterer JC, et al. Hinge stiffness is a barrier to RNA folding. J Mol Biol. 2008;379:859–870. doi: 10.1016/j.jmb.2008.04.013. [DOI] [PMC free article] [PubMed] [Google Scholar]
- 4.Draper DE. A guide to ions and RNA structure. RNA. 2004;10:335–343. doi: 10.1261/rna.5205404. [DOI] [PMC free article] [PubMed] [Google Scholar]
- 5.Tinoco I, Jr, Bustamante C. How RNA folds. J Mol Biol. 1999;293:271–281. doi: 10.1006/jmbi.1999.3001. [DOI] [PubMed] [Google Scholar]
- 6.Cole PE, Crothers DM, Yang SK. Conformational changes of transfer ribonucleic acid—equilibrium phase diagrams. Biochemistry. 1972;11:4358–4368. doi: 10.1021/bi00773a024. [DOI] [PubMed] [Google Scholar]
- 7.Pyle AM. Ribozymes—a distinct class of metalloenzymes. Science. 1993;261:709–714. doi: 10.1126/science.7688142. [DOI] [PubMed] [Google Scholar]
- 8.Cate JH, et al. Crystal structure of a group I ribozyme domain: Principles of RNA packing. Science. 1996;273:1678–1685. doi: 10.1126/science.273.5282.1678. [DOI] [PubMed] [Google Scholar]
- 9.Draper DE. RNA folding: Thermodynamic and molecular descriptions of the roles of ions. Biophys J. 2008;95:5489–5495. doi: 10.1529/biophysj.108.131813. [DOI] [PMC free article] [PubMed] [Google Scholar]
- 10.Woodson SA. Metal ions and RNA folding: A highly charged topic with a dynamic future. Curr Opin Chem Biol. 2005;9:104–109. doi: 10.1016/j.cbpa.2005.02.004. [DOI] [PubMed] [Google Scholar]
- 11.Pabit SA, et al. Both helix topology and counterion distribution contribute to the more effective charge screening in dsRNA compared with dsDNA. Nucleic Acids Res. 2009;37:3887–3896. doi: 10.1093/nar/gkp257. [DOI] [PMC free article] [PubMed] [Google Scholar]
- 12.Kirmizialtin S, Elber R. Computational exploration of mobile ion distributions around RNA duplex. J Phys Chem B. 2010;114:8207–0220. doi: 10.1021/jp911992t. [DOI] [PMC free article] [PubMed] [Google Scholar]
- 13.Bai Y, et al. Critical assessment of nucleic acid electrostatics via experimental and computational investigation of an unfolded state ensemble. J Am Chem Soc. 2008;130:12334–12341. doi: 10.1021/ja800854u. [DOI] [PMC free article] [PubMed] [Google Scholar]
- 14.Tan ZJ, Chen SJ. Salt contribution to RNA tertiary structure folding stability. Biophys J. 2011;101:176–187. doi: 10.1016/j.bpj.2011.05.050. [DOI] [PMC free article] [PubMed] [Google Scholar]
- 15.Wong GCL, and Pollack L. Electrostatics of strongly charged biological polymers: Ion-mediated interactions and self-organization in nucleic acids and proteins. Annu Rev Phys Chem. 2010;61:171–189. doi: 10.1146/annurev.physchem.58.032806.104436. [DOI] [PubMed] [Google Scholar]
- 16.Chen AA, Draper DE, Pappu RV. Molecular simulation studies of monovalent counterion-mediated interactions in a model RNA kissing loop. J Mol Biol. 2009;390:805–819. doi: 10.1016/j.jmb.2009.05.071. [DOI] [PMC free article] [PubMed] [Google Scholar]
- 17.Doose S, Barsch H, Sauer M. Polymer properties of polythymine as revealed by translational diffusion. Biophys J. 2007;93:1224–1234. doi: 10.1529/biophysj.107.107342. [DOI] [PMC free article] [PubMed] [Google Scholar]
- 18.Laurence TA, Kong XX, Jager M, Weiss S. Probing structural heterogeneities and fluctuations of nucleic acids and denatured proteins. Proc Natl Acad Sci USA. 2005;102:17348–17353. doi: 10.1073/pnas.0508584102. [DOI] [PMC free article] [PubMed] [Google Scholar]
- 19.Murphy MC, Rasnik I, Cheng W, Lohman TM, Ha TJ. Probing single-stranded DNA conformational flexibility using fluorescence spectroscopy. Biophys J. 2004;86:2530–2537. doi: 10.1016/S0006-3495(04)74308-8. [DOI] [PMC free article] [PubMed] [Google Scholar]
- 20.Dressinges MN, et al. Stretching single stranded DNA, a model polyelectrolyte. Phys Rev Lett. 2002;89:248102. doi: 10.1103/PhysRevLett.89.248102. [DOI] [PubMed] [Google Scholar]
- 21.McIntosh DB, Saleh OA. Salt species-dependent electrostatic effects on ssDNA elasticity. Macromolecules. 2011;44:2328–2333. [Google Scholar]
- 22.Seol Y, Skinner GM, Visscher K. Elastic properties of a single-stranded charged homopolymeric ribonucleotide. Phys Rev Lett. 2004;93:118102. doi: 10.1103/PhysRevLett.93.118102. [DOI] [PubMed] [Google Scholar]
- 23.Seol Y, Skinner GM, Visscher K, Buhot A, Halperin A. Stretching of homopolymeric RNA reveals single-stranded helices and base-stacking. Phys Rev Lett. 2007;98:158103. doi: 10.1103/PhysRevLett.98.158103. [DOI] [PubMed] [Google Scholar]
- 24.Plaxco KW, Millett IS, Segel DJ, Doniach S, Baker D. Chain collapse can occur concomitantly with the rate-limiting step in protein folding. Nat Struct Biol. 1999;6:554–556. doi: 10.1038/9329. [DOI] [PubMed] [Google Scholar]
- 25.Jacob J, Krantz B, Dothager RS, Thiyagarajan P, Sosnick TR. Early collapse is not an obligate step in protein folding. J Mol Biol. 2004;338:369–382. doi: 10.1016/j.jmb.2004.02.065. [DOI] [PubMed] [Google Scholar]
- 26.Merchant KA, Best RB, Louis JM, Gopich IV, Eaton WA. Characterizing the unfolded states of proteins using single-molecule FRET spectroscopy and molecular simulations. Proc Natl Acad Sci USA. 2007;104:1528–1533. doi: 10.1073/pnas.0607097104. [DOI] [PMC free article] [PubMed] [Google Scholar]
- 27.Kratky O, Porod G. Röntgenuntersuchung aufgelöster Fadenmoleküle (X-ray investigation of dissolved chain molecules) Recueil des Travaux Chimiques des Pays-Bas. 1949;68:1106–1122. (German) [Google Scholar]
- 28.Thirumalai D, Ha BY. In: Theoretical and Mathematical Models in Polymer Research: Modern Methods in Polymer Research and Technology. Grosberg AY, editor. Boston: Academic Press; 1998. pp. 1–36. [Google Scholar]
- 29.Pedersen JS, Schurtenberger P. Scattering functions of semiflexible polymers with and without excluded volume effects. Macromolecules. 1996;29:7602–7612. [Google Scholar]
- 30.Odijk T. Polyelectrolytes near the rod limit. J Polym Sci B Polym Phys. 1977;15:477–483. [Google Scholar]
- 31.Skolnick J, Fixman M. Electrostatic persistence length of a wormlike polyelectrolyte. Macromolecules. 1977;10:944–948. [Google Scholar]
- 32.Ha BY, Thirumalai D. Electrostatic persistence length of a polyelectrolyte chain. Macromolecules. 1995;28:577–581. [Google Scholar]
- 33.Muthukumar M. Theory of counter-ion condensation on flexible polyelectrolytes: Adsorption mechanism. J Chem Phys. 2004;120:9343–9350. doi: 10.1063/1.1701839. [DOI] [PubMed] [Google Scholar]
- 34.Qiu X, et al. Inter-DNA attraction mediated by divalent counterions. Phys Rev Lett. 2007;99:038104. doi: 10.1103/PhysRevLett.99.038104. [DOI] [PubMed] [Google Scholar]
- 35.Kim J, Doose S, Neuweiler H, Sauer M. The initial step of DNA hairpin folding: a kinetic analysis using fluorescence correlation spectroscopy. Nucleic Acids Res. 2006;34:2516–2527. doi: 10.1093/nar/gkl221. [DOI] [PMC free article] [PubMed] [Google Scholar]
- 36.Haynes WM. CRC Handbook of Chemistry and Physics. 92nd Ed. Boca Raton, FL: CRC Press; 2011. [Google Scholar]
- 37.Olson WK, Flory PJ. Spatial configurations of polynucleotide chains. I. Steric interactions in polyribonucleotides: A virtual bond model. Biopolymers. 1972;11:1–23. doi: 10.1002/bip.1972.360110102. [DOI] [PubMed] [Google Scholar]
- 38.Cheng DM, Dhingra MM, Sarman RH. Spatial configuration of deoxyribotrinucleoside diphosphates in aqueous solution. Nucleic Acids Res. 1978;5:4399–4416. doi: 10.1093/nar/5.11.4399. [DOI] [PMC free article] [PubMed] [Google Scholar]
- 39.Lee CH, Ezra FS, Kondo NS, Sarma RH, Danyluk SS. Conformational properties of dinucleoside monophosphates in solution—dipurines and dipyrimidines. Biochemistry. 1976;15:3627–3638. doi: 10.1021/bi00661a034. [DOI] [PubMed] [Google Scholar]
- 40.Young PR, Kallenbach NR. Secondary structure in polyuridylic acid—non-classical hydrogen-bonding and the function of the ribose 2′-hydroxyl group. J Mol Biol. 1978;126:467–479. doi: 10.1016/0022-2836(78)90053-0. [DOI] [PubMed] [Google Scholar]
- 41.Tinland B, Pluen A, Sturm J, Weill B. Persistence length of single-stranded DNA. Macromolecules. 1997;30:5763–5765. [Google Scholar]
- 42.Mills JB, Vacano E, Hagerman PJ. Flexibility of single-stranded DNA: Use of gapped duplex helices to determine the persistence lengths of poly(dT) and poly(dA) J Mol Biol. 1999;285:245–257. doi: 10.1006/jmbi.1998.2287. [DOI] [PubMed] [Google Scholar]
- 43.Netz RR, Orland H. Field theory for charged fluids and colloids. Europhys Lett. 1999;45:726–732. [Google Scholar]
- 44.Manghi M, Netz RR. Variational theory for a single polyelectrolyte chain revisited. Eur Phys J E Soft Matter. 2004;14:67–77. doi: 10.1140/epje/i2004-10007-3. [DOI] [PubMed] [Google Scholar]
- 45.Saleh OA, McIntosh DB, Pincus P, Ribeck N. Nonlinear low-force elasticity of single-stranded DNA molecules. Phys Rev Lett. 2009;102:68301. doi: 10.1103/PhysRevLett.102.068301. [DOI] [PubMed] [Google Scholar]
- 46.Müller-Späth S, et al. Charge interactions can dominate the dimensions of intrinsically disordered proteins. Proc Natl Acad Sci USA. 2010;107:14609–14614. doi: 10.1073/pnas.1001743107. [DOI] [PMC free article] [PubMed] [Google Scholar]
- 47.Mao AH, Crick SL, Vitalis A, Chicoine CL, Pappu RV. Net charge per residue modulates conformational ensembles of intrinsically disordered proteins. Proc Natl Acad Sci USA. 2010;107:8183–8188. doi: 10.1073/pnas.0911107107. [DOI] [PMC free article] [PubMed] [Google Scholar]
- 48.Stryer L, Haugland RP. Energy transfer: A spectroscopic ruler. Proc Natl Acad Sci USA. 1967;58:719–726. doi: 10.1073/pnas.58.2.719. [DOI] [PMC free article] [PubMed] [Google Scholar]
- 49.Tate MW, et al. A large-format high-resolution area X-ray detector based on a fiber-optically bonded charge-coupled device (CCD) J Appl Crystallogr. 1995;28:196–205. [Google Scholar]
- 50.Press WH, Teukolsky SA, Vetterling WT, Flannery BP. Numerical Recipes 3rd Edition: The Art of Scientific Computing. New York: Cambridge Univ Press; 2007. [Google Scholar]