Abstract
We show in climate model experiments that large-scale afforestation in northern mid-latitudes warms the Northern Hemisphere and alters global circulation patterns. An expansion of dark forests increases the absorption of solar energy and increases surface temperature, particularly in regions where the land surface is unable to compensate with latent heat flux due to water limitation. Atmospheric circulation redistributes the anomalous energy absorbed in the northern hemisphere, in particular toward the south, through altering the Hadley circulation, resulting in the northward displacement of the tropical rain bands. Precipitation decreases over parts of the Amazon basin affecting productivity and increases over the Sahel and Sahara regions in Africa. We find that the response of climate to afforestation in mid-latitudes is determined by the amount of soil moisture available to plants with the greatest warming found in water-limited regions. Mid-latitude afforestation is found to have a small impact on modeled global temperatures and on global CO2, but regional heating from the increase in forest cover is capable of driving unintended changes in circulation and precipitation. The ability of vegetation to affect remote circulation has implications for strategies for climate mitigation.
Keywords: ecoclimate, ecosystem-climate interactions, energy budget, land use change, land cover change
Afforestation has been proposed as a tool for climate change mitigation because the growth of forests on previously unforested land results in a net uptake and storage of carbon from the atmosphere which, it is assumed, will slow global warming. The expansion of forest plantations for biofuel production has been proposed as well and is a candidate land cover scenario for specifying representative concentration pathways in the IPCC AR5 protocol (1). However, the role of mid-latitude forests in climate remains poorly constrained (2). To understand the role of mid-latitude forests in the global coupled ecosystem-climate system, or ecoclimate, we must understand both the role of trees in local climate as well as how the Earth responds to forcing in the mid-latitudes.
Forests and Climate
Forests have lower albedos, higher productivity, and higher transpiration rates than grasslands, croplands, or the tundra. In northern high latitudes, an increase in tree cover warms the local climate due to a lower albedo and consequent enhanced absorption of solar radiation, particularly when leaves cover snow (e.g., 3, 4) and due to enhanced greenhouse effect from increases in water vapor from transpiration (5). In the tropics, where the surface is warm and relatively dark, and there is abundant water vapor, the impact of increasing forest cover on shortwave and longwave radiation is small compared to the enhanced latent heat loss, keeping temperatures moderate and precipitation rates high by recycling water from the surface back to the atmosphere (c.f. 2, 6, 7). The local impact of tree cover in mid-latitudes is less well constrained. Changes in both radiative balance and latent heat loss compete to control the local surface temperature response and models disagree on the net effect of increasing tree cover in mid-latitudes (2).
In addition to the biophysical effects of vegetation on local climate (e.g., 3, 8), larger-scale effects are possible through biogeochemical feedbacks (c.f. 9). Changes in carbon inventory and carbon fluxes associated with changes in vegetation cover modify the global atmospheric CO2 concentration. Indeed, the cumulative CO2 emission associated with land cover change in the past 200 years is estimated as approximately half the cumulative fossil fuel CO2 emission (10), though this number is poorly constrained. Previous studies have found the biogeophysical and biogeochemical effects of changes in forest cover on near-surface air temperature to be of similar size globally (11–13). While changes in albedo and surface latent heat fluxes have direct effects locally, atmospheric CO2 is well mixed throughout the atmosphere and has a global impact. In this paper we show that regional impacts can also have global impacts when changes in forest cover result in a gradient in temperature that drives changes in circulation, and thus precipitation, despite small changes in mean global temperature.
Mid-Latitude Forcing and Circulation.
There is emerging evidence in the literature for a mid-latitude control on the tropical Hadley circulation (e.g., 14, 15), specifically with regard to shifting the latitudinal position of the Intertropical Convergence Zone (ITCZ). For example, in a modeling study in which the ocean is thermodynamically interactive with the atmosphere ref. 14 found that extratropical cooling induced by land and sea ice cover associated with the Last Glacial climate cooled the entire Northern Hemisphere and shifted the ITCZ southward. Theoretical work with an interactive ocean model again indicates that this tropical response is driven by increased cross-equatorial atmospheric energy transport requirements, requiring an altered Hadley circulation (16). In particular, this mechanism has been invoked to explain the circulation response to anthropogenic aerosol forcing of the Northern Hemisphere in recent decades (17, 18). We propose here that changes in mid-latitude forest cover are capable of initiating a similar shift in the Hadley circulation, and thus precipitation, through changing the atmospheric energy budget of the Northern Hemisphere.
In this study we investigate the impact of large-scale changes in mid-latitude deciduous tree cover and identify processes that control the interaction between ecosystems and climate. We propose here a mechanism where an expansion of mid-latitude forest relative to today would cause a northward shift in the general circulation of the tropics that alters tropical precipitation patterns and tropical productivity.
Climate Effects of Afforestation in the Mid-Latitudes
To investigate the role of vegetation changes in mid-latitudes, we use the National Center for Atmospheric Research (NCAR) Community Atmosphere and Land models with an interactive carbon cycle and an interactive slab ocean (CAM 3.0-CLM 3.5-CASA’) (19–21). The CASA’ carbon cycle model represents a full terrestrial carbon cycle with growth, mortality, and decay—and hence of leaf area and carbon storage in above- and below-ground pools. Vegetation function is not prescribed and, under unsuitable growing conditions, plants diminish to a minimum leaf area. Vegetation responds to climate through changing stomatal conductance, leaf area, and mass, which feeds back on the atmosphere through changes in albedo and transpiration. The ocean is represented by a slab ocean model with interactive sea surface temperatures as other studies have shown that thermodynamic interaction between sea surface temperatures and the atmosphere is necessary for allowing shifts in large-scale circulation and precipitation. For further details see Materials and Methods.
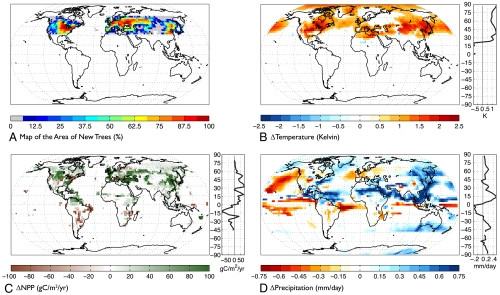
Our experiment imposes a change to the distribution of trees and grasses; all other aspects of the land model are left unmodified compared to the control run (CON, for “control”). In the experiment (TREE), all mid-latitude area in the map of present day vegetation between 30 °N and 60 °N currently occupied by either C3 grasses or agriculture is converted to broad-leaf deciduous trees and all previously designated vegetation is left unmodified, as are glaciers and lakes (Fig. 1A). The converted area totals 18,000,000 km2 and comprises 19.2% of all surface area (land and ocean) between 30 °N and 60 °N. The model is run to equilibrium (see Materials and Methods). Anomalies, represented by Δϕ are calculated as the difference in climate variable ϕ between an experiment with afforestation in mid-latitudes and present day vegetation (experiment minus control, TREE-CON).
Figure 1.
(A) Map of the area of new deciduous trees in the afforestation experiment (TREE) in units of percent of gridcell. New vegetation is added on C3 grasslands and cultivated land from the control run between 30 °N and 60 °N. The total area converted is 1.8 × 10⁷ km2. The anomaly in annually averaged (B) near-surface air temperature (ΔT) in Kelvin, (C) net primary productivity over land (Δ NPP) in gC/m2/yr, and (D) precipitation in mm/day for a model experiment where trees are introduced as in A (TREE-CON). The zonal mean profile of each variable is shown in a line plot to the left of each map. Values which do not pass a significance test at 95% confidence have been omitted.
This particular conversion, from grass and crops to forest, is used to simulate the reforestation of current grasslands and agricultural regions. The afforestation is extreme and not intended to represent a predicted scenario but rather to investigate how much of a change in climate is possible due to changes in mid-latitude forest cover given the current configuration of continents. The experimental design gives us an opportunity to identify the mechanisms controlling the interaction between climate and mid-latitude forests, particularly changes in atmospheric circulation, and to put upper bounds on the climate impact of afforestation in northern mid-latitudes. We have also completed additional sensitivity studies where only agricultural lands are converted to forest and find similar spatial patterns of the climate response with a proportionally smaller magnitude of change. This paper follows on the work of other studies looking at the climate impacts of both regional and global afforestation and deforestation (e.g., 11–13, 22 and others). We particularly focus here on the mechanisms through which the coupled ecosystem-climate system, or ecoclimate, responds to changes in mid-latitude tree cover and the implications for locations remote to those directly modified.
Direct Effects of Afforestation.
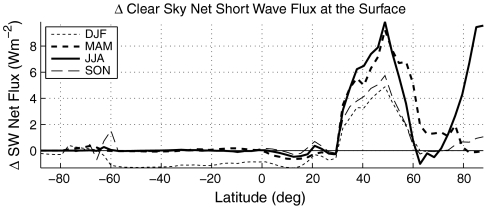
Afforestation leads to darker surfaces (Fig. 2 and Table S1) and higher near-surface air temperatures north of 30 °N (Fig. 1B). The primary change in the surface energy budget is an increase in the solar radiation absorbed at the surface. The albedo difference is evident in all seasons (Fig. 2), indicating that it is not entirely due to snow masking by trees but instead due to the specified difference in the albedo between grasses and trees. The largest Δ of absorbed solar radiation at the surface in mid-latitudes occurs during the summer and fall over land but there are also albedo changes over the ocean, and thus changes in the absorbed solar radiation, associated with a decrease in sea ice area in the summer (Fig. 2). Note that this differs from earlier work on the expansion of deciduous trees in the Arctic (5) where the greenhouse effect from transpiration was a comparable source of warming to surface albedo changes. Cloud radiative forcing is a weak positive feedback, increasing the net radiation at the top of the atmosphere into the earth by 0.44 W m-2, or approximately 9% relative to the changes due to vegetation. The cloud radiative forcing over the mid-latitudes stems from a decrease in cloud cover at all vertical levels (by 2%), but with a larger decrease at low levels (by 4.5%), and is three-quarters due to shortwave forcing and one-quarter due to longwave forcing.
Figure 2.
Zonal ΔSW absorbed. A zonally averaged profile of Δ short wave radiation absorbed at the surface during clear sky conditions in Wm-2 due afforestation in northern mid-latitudes. The anomaly compares a case where northern mid-latitudes are afforested as in Fig. 1A with the control (TREE-CON).
At equilibrium, water vapor increases over the Northern Hemisphere mid-latitudes by 6.9% in the annual mean, leading to enhanced downward longwave radiation. This increase in water vapor is consistent with the increase in temperature of 0.93 °C and the expected Clausius–Clapeyron relationship of an approximate 7% increase in water vapor per degree of warming. Precipitation and evaporation in the mid-latitudes both increase, but evaporation increases more than precipitation resulting in an export of 1.1 kg/s of water from the region. The increase in evaporation comes two-thirds from the land (22.7 kg/s) and one-third from the ocean (10.4 kg/s). The enhanced solar absorption from the change in albedo and downward longwave radiation from changes in water vapor are balanced at the surface by latent heat flux, sensible heat flux, and an increase in longwave radiation upward. The upward longwave flux has a quartic dependence on surface temperature, while the partitioning between latent and sensible heat fluxes varies with temperature and moisture status. Latent heat loss from the surface cools the near-surface air, while sensible heat fluxes directly heat the atmosphere above the surface.
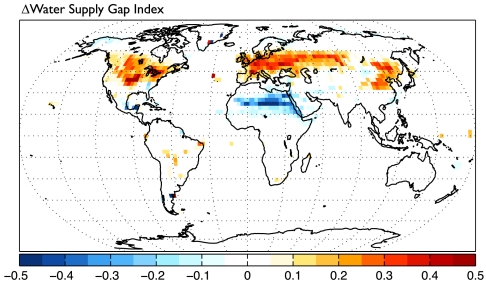
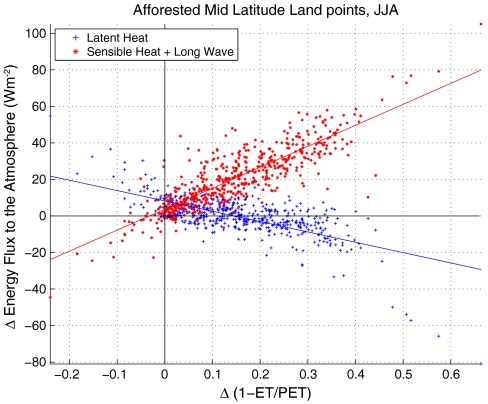
More solar radiation is absorbed in the afforested experiment than in the control. This energy must be balanced at the surface by changes in the other energy fluxes: latent heat, sensible heat, and longwave. Given sufficient available water, a change in latent heat flux dominates the heat loss from the surface. A metric of water supply versus demand helps to identify where latent heat fluxes are limited in a relative sense. We use one minus the ratio between the actual evapotranspiration to the potential evapotranspiration (1 - ET/PET) as a metric of the inability of the surface to meet the water demands of the atmosphere or the water supply gap. It is an index of relative soil water deficit but not necessarily of biological water stress. As the water supply gap measures inability of the surface to meet the water demands of the atmosphere, locations with a positive water supply gap can be considered atmospherically water-limited regions. The water supply gap primarily widens in afforested regions in the summer (Fig. 3) indicating relatively drier conditions. Some dry regions are unable to support trees; however, total leaf area index is uncorrelated with the changes in dryness due to afforestation as measured by a widening water supply gap (r = 0.07, p = 0.12). This is, in part, due to the fact that the change in water supply gap does not consider the initial availability of water in a given location and therefore indicates drying but not necessarily conditions too dry for trees. In locations where the water supply gap widens, the additional energy absorbed at the surface by the dark forest cannot be removed as latent heat flux, the surface temperature increases (by 0.62 °C in the Northern Hemisphere annual mean), and the absorbed solar energy is released by sensible heat fluxes and longwave energy fluxes (Fig. 4).
Figure 3.
Δ water supply gap index. Map of the Δ water supply gap index, which measures the ability of the land surface to meet evaporative demand of the atmosphere. A narrowing water supply gap (cool colors) indicates sufficient water and widening water supply gap (warm colors) indicates that water is limited. The water supply gap is only defined over land and values that do not pass a significance test at 95% confidence have been omitted. The anomaly compares a case where northern mid-latitudes are afforested as in Fig. 1A with the control (TREE-CON).
Figure 4.
Water supply gap vs. surface energy terms. The Δ water supply gap (Δ(1 - ET/PET)) is plotted against the outgoing surface energy fluxes over afforested points for June-July-August (JJA). The sum of terms that lead to surface warming plotted in red (Δ sensible heat fluxes plus Δ net longwave radiation at the surface) and the term that leads to cooling plotted in blue (Δ latent heat fluxes). The best fit line is plotted for the warming terms in red (slope = 114.8 Wm-2, p < 0.01, r2 = 0.7) and the cooling terms in blue (slope = -56.6 Wm-2, p < 0.01, r2 = 0.46). The anomaly compares a case where northern mid-latitudes are afforested as in Fig. 1A with the control (TREE-CON).
The availability of soil moisture to support transpiration dominates the local energy balance. In afforested areas with abundant soil moisture, the enhanced latent heat loss can ameliorate the warming from the enhanced solar absorption and net longwave radiation. Without sufficient water, energy must be removed by sensible heat and longwave upwelling (Fig. 4), both resulting in near-surface warming. In fact, the greatest warming is found where the water supply gap widens. Mid-latitude locations with a widening water supply gap have an increase in summer temperature 2 ° higher than the increase in temperature over locations with a narrowing water supply gap (Δ T of 3.5, and 1.5 °C respectively for JJA). The water supply gap itself is closely related to the surface energy budget components (c.f. Fig. 4) rather than the temperature response itself. Therefore, the correspondence between the two demonstrates that the temperature response is driven by changes in the surface energy budget terms. Regions with a widening water supply gap result in hotter and drier conditions and dominate the afforested regions in our simulation. It is thus the soil moisture available to plants that determines the response of climate to afforestation in mid-latitudes. The dependence of the warming response to soil moisture status may help to explain the divergence in the impact of mid-latitude forests across models, as the representation of soil moisture varies widely (23).
Large-Scale Circulation Effects.
Afforestation in the mid-latitudes results not only in the warming of the Northern Hemisphere in our experiments but also in a northward shift of precipitation belts, particularly over the Pacific Ocean, but also over the Atlantic Ocean and South America (Fig. 1D). The most notable changes in precipitation over land are the northward shift of precipitation over Brazil, including a drying of the southern edge of the Amazon forest and the increase in precipitation in the Sahel region of Africa.
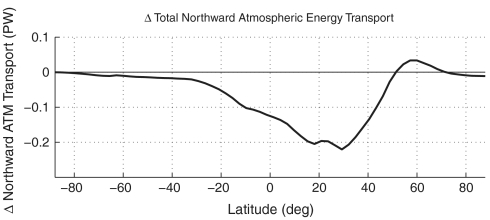
In the mean climate state, the ITCZ demarcates the border between the two cells of the Hadley circulation. Energy is transported across the equator by the strong cell on the winter side of the Hadley circulation and associated eddies. Extratropical forcing has been shown to move the location of the ITCZ toward the warmer hemisphere resulting in an increase in cross-equatorial flux of energy to restore energy balance. An emerging literature argues that changes in the energy budget of the mid-latitudes, such as that imposed in our afforestation experiment, will lead to tropical circulation changes (e.g., 14, 16, 18, 24). To estimate the shift in the Hadley circulation associated with mid-latitude afforestation we calculate the total northward transport of energy from the top of atmosphere net radiative flux (Fig. 5). This change in energy transport is a diagnostic of changes in the circulation that does not depend directly on the location of the ITCZ, although they are associated. In our experiment, changes in energy transport occur entirely within the atmosphere as we employ a slab ocean model with fixed oceanic heat transport. The total northward atmospheric energy transport at the equator of 1.21 petawatts (PW) in the control case is reduced by 0.17 PW with afforestation—a 13% change (p < 0.001), confirming that the circulation is indeed redistributing the anomalous energy southward even though surface temperatures in the Southern Hemisphere do not increase (Fig. 1B).
Figure 5.
Anomalous northward atmospheric energy transport. Zonally averaged latitudinal profile of the anomalous northward energy transport by the atmosphere comparing a case where trees are added to the northern mid-latitudes as in Fig. 1A with the control (TREE-CON).
Shifts in the Hadley circulation and the ITCZ, resulting from the increase in mid-latitude forests and Northern Hemisphere temperature, change patterns not only of precipitation but also of terrestrial productivity. Over South America, the precipitation maximum shifts northward, drying the southern edge of the Amazon forest and causing a decrease in productivity (Fig. 1 C and D). Over Africa, the increase in precipitation over the Sahara and upper Sahel regions creates wetter conditions but does not result in an increase in productivity in this model experiment with prescribed land cover. The water is instead released directly as ground evaporation, and no change in the carbon balance is observed. We find it notable that extratropical changes in forest cover are able to affect tropical carbon cycling in addition to global circulation.
Implications for Future Afforestation
We expect an increase in carbon storage on land with the shift from grass and crops to forest due to the associated increase in residence time of carbon in the terrestrial system (wood lives longer and takes relatively longer to decay than grass). In our partially coupled carbon-climate model experiments we find that the land takes up 270 peta-g of carbon (PgC) across the afforested locations at equilibrium. This is a combination of uptake by above ground carbon of 155 PgC and below-ground carbon by 112 PgC. Although afforestation dominates the global carbon budget change, the carbon balance of regions remote to the afforested locations is also affected. In boreal regions (north of 60 °N), 28 PgC is lost from below-ground carbon pools as higher temperatures accelerate decomposition. The loss is 3 PgC from unmodified regions in mid-latitudes and 9 PgC from the tropics. The net carbon sequestration by the global biosphere with our large-scale afforestation is 228 PgC.
From this net uptake of carbon by the biosphere we can estimate a change in global mean temperature. However, the carbon gained on land will be partially compensated by a release of CO2 from the oceans as atmospheric CO2 decreases. At equilibrium the oceanic release is estimated to be between approximately 60% and 85% of that removed by the biosphere (25, 26). The relative time scale over which carbon is taken up by the terrestrial biosphere is on order decades to centuries while the release from the ocean takes place over a range of time scales from decades to approximately 1,000 years. These time scales are not explicitly represented by our modeling approach and so we report here the equilibrium effect of mid-latitude afforestation on global atmospheric CO2 concentrations. Accounting for the response of both land and ocean carbon cycles we estimate a net decrease in atmospheric CO2 concentration of 16–46 ppm and a corresponding decrease of 0.2 to 0.7 °C globally. The global mean warming associated with only the biogeophysical impacts of afforestation results in an increase of 0.3 °C. Taken together, the combination of biogeophysical and biogeochemical effects leads to a net change in global temperature of −0.4 to 0.1 °C globally.
We thus find that mid-latitude afforestation on the large scale prescribed in our experiments has a small impact on global temperatures and on global CO2: The direct warming and the CO2 cooling are both within natural variability of globally averaged temperatures and nearly cancel out. The regional impacts, however, are substantial. We also find that the soil moisture available to plants determines the response of climate to afforestation in mid-latitudes with the greatest warming found in water-limited regions. Our results illustrate that afforestation contributes to changes in temperature and energy gradients that alter circulation and rainfall patterns irrespective of changes in global temperature. Changes in circulation driven by afforestation alter precipitation and productivity in regions remote to the new forest—we see drying and a loss in productivity over the Amazon forest in response to changes in mid-latitude forest cover. Afforestation may thus have unintended impacts on the supply of freshwater and terrestrial productivity in places far from the afforested areas.
Materials and Methods
This study uses the NCAR Community Atmosphere and Land models (19) with the CASA’ interactive carbon cycle (20) and an interactive slab ocean (21) (CAM 3.0-CLM 3.5-CASA’). The slab ocean representation keeps lateral heat transport within the ocean fixed while allowing sea surface temperatures to change. This ocean representation provides more variability than a fixed surface temperature boundary condition while remaining computationally inexpensive compared to a full dynamical ocean. Interaction between sea surface temperatures and the atmosphere is necessary for allowing shifts in large-scale circulation and precipitation.
The model runs are integrated for 120 years, and the results presented are averages of the last 100 years. The spin-up time of 20 years is sufficient to bring climate variables (temperature, precipitation, sea ice cover, snow cover, soil moisture, etc.) into equilibrium. CO2 is held fixed at 355 ppm. The spatial resolution of the model is T42, which corresponds to approximately 2.8° by 2.8° gridcells. We estimate a lagged autocorrelation of two years or less for all variables and have used a conservative estimate of 50 ° of freedom for each 100-year period. Significance is reported as p-values where a p-value of 0.05 indicates that we reject the null hypothesis that the anomaly is zero with 95% confidence. The terrestrial carbon cycle is run to equilibrium by accelerating the turnover times of pools with time scales longer than four years. The equilibrium mass of these pools are then proportionally adjusted to find the equilibrium state of the carbon cycle.
The radiative effects of changes to the carbon budget are calculated converting each 2 PgC released globally to 1 ppm of atmospheric CO2. Radiative forcing of CO2 is calculated as in ref. 27 as well as following ref. 28. Both methods give similar results within the confidence of our estimate. Climate sensitivity is assumed to fall within the range of 2–4 ° for a doubling of CO2 and is used to convert radiative forcing in Wm-2 to changes in global temperature.
Supplementary Material
Acknowledgments.
We would like to acknowledge Gordon Bonan and Samuel Levis for assisting us with model setup. Zan Stine provided comments on this manuscript, Shih-Yu Lee and Andrew Friedman provided helpful discussions, and two anonymous reviewers provided helpful and constructive comments. We acknowledge National Science Foundation Award ATM-0628678 to the University of California, Berkeley. J.C.H.C. acknowledges funding by the Office of Science (Biological and Environmental Research), U.S. Department of Energy (award number DE-FG02-08ER64588). This work was partially conducted while A.L.S.S. was a Giorgio Ruffolo Fellow in the Sustainability Science Program at Harvard University, for which support from Italy’s Ministry for Environment, Land and Sea is gratefully acknowledged.
Footnotes
The authors declare no conflict of interest.
This article contains supporting information online at www.pnas.org/lookup/suppl/doi:10.1073/pnas.1116706108/-/DCSupplemental.
References
- 1.Moss RH, et al. The next generation of scenarios for climate change research and assessment. Nature. 2010;463:747–756. doi: 10.1038/nature08823. [DOI] [PubMed] [Google Scholar]
- 2.Bonan GB. Forests and climate change: Forcings, feedbacks, and the climate benefits of forests. Science. 2008;320:1444–1449. doi: 10.1126/science.1155121. [DOI] [PubMed] [Google Scholar]
- 3.Bonan GB, Pollard D, Thompson SL. Effects of boreal forest vegetation on global climate. Nature. 1992;359:716–718. [Google Scholar]
- 4.Foley JA, Kutzbach J, Coe MT, Levis S. Feedbacks between climate and boreal forests during the Holocene Epoch. Nature. 1994;371:52–54. [Google Scholar]
- 5.Swann AL, Fung IY, Levis S, Bonan GB, Doney SC. Arctic vegetation amplify high-latitude warming through the greenhouse effect. Proc Natl Acad Sci USA. 2010;107:1295–1300. doi: 10.1073/pnas.0913846107. [DOI] [PMC free article] [PubMed] [Google Scholar]
- 6.Snyder P, Delire C, Foley J. Evaluating the influence of different vegetation biomes on the global climate. Clim Dynam. 2004;23:279–302. [Google Scholar]
- 7.Henderson-Sellers A, et al. Tropical deforestation—modeling local-scale to regional-scale climate change. J Geophys Res. 1993;98:7289–7315. [Google Scholar]
- 8.Chapin F, et al. Arctic and boreal ecosystems of western North America as components of the climate system. Glob Change Biol. 2000;6:211–223. doi: 10.1046/j.1365-2486.2000.06022.x. [DOI] [PubMed] [Google Scholar]
- 9.Sellers P, et al. Comparison of radiative and physiological effects of doubled atmospheric CO2 on climate. Science. 1996;271:1402–1406. [Google Scholar]
- 10.Houghton RA. Balancing the global carbon budget. Annu Rev Earth Planet Sci. 2007;35:313–347. [Google Scholar]
- 11.Bala G, et al. Combined climate and carbon-cycle effects of large-scale deforestation. Proc Natl Acad Sci USA. 2007;104:6550. doi: 10.1073/pnas.0608998104. [DOI] [PMC free article] [PubMed] [Google Scholar]
- 12.Bathiany S, Claussen M, Brovkin V, Raddatz T, Gayler V. Combined biogeophysical and biogeochemical effects of large-scale forest cover changes in the MPI earth system model. Biogeosciences. 2010;7:1383–1399. [Google Scholar]
- 13.Kleidon A, Fraedrich K, Heimann M. A green planet versus a desert world: Estimating the maximum effect of vegetation on the land surface climate. Clim Change. 2000;44:471–493. [Google Scholar]
- 14.Chiang J, Bitz C. Influence of high latitude ice cover on the marine Intertropical Convergence Zone. Clim Dynam. 2005;25:477–496. [Google Scholar]
- 15.Broccoli A, Dahl K, Stouffer R. Response of the ITCZ to Northern Hemisphere cooling. Geophys Res Lett. 2006;33:L01702. [Google Scholar]
- 16.Kang SM, Frierson DMW, Held IM. The tropical response to extratropical thermal forcing in an idealized GCM: The importance of radiative feedbacks and convective parameterization. J Atmos Sci. 2009;66:2812–2827. [Google Scholar]
- 17.Rotstayn L, Ryan B, Penner J. Precipitation changes in a GCM resulting from the indirect effects of anthropogenic aerosols. Geophys Res Lett. 2000;27:3045–3048. [Google Scholar]
- 18.Yoshimori M, Broccoli AJ. Equilibrium response of an atmosphere-mixed layer ocean model to different radiative forcing agents: Global and zonal mean response. J Clim. 2008;21:4399–4423. [Google Scholar]
- 19.Collins W, et al. The formulation and atmospheric simulation of the Community Atmosphere Model version 3 (CAM3) J Clim. 2006;19:2144–2161. [Google Scholar]
- 20.Doney SC, Lindsay K, Fung I, John J. variability in a stable, 1000-yr global coupled climate-carbon cycle simulation. J Clim. 2006;19:3033–3054. [Google Scholar]
- 21.Kiehl J, Shields C, Hack J, Collins W. The climate sensitivity of the Community Climate System Model version 3 (CCSM3) J Clim. 2006;19:2584–2596. [Google Scholar]
- 22.Gibbard S, Caldeira K, Bala G, Phillips TJ, Wickett M. Climate effects of global land cover change. Geophys Res Lett. 2005;32:1–4. [Google Scholar]
- 23.Meehl G, et al. In: Global climate Projections in Climate Change 2007: The Physical Science Basis. Contribution of Working Group I to the Fourth Assessment Report of the Intergovernmental Panel on Climate Change. Solomon S, editor. Cambridge, UK: Cambridge Univ Press; 2007. pp. 747–845. [Google Scholar]
- 24.Kang SM, Held IM, Frierson DMW, Zhao M. The response of the ITCZ to extratropical thermal forcing: Idealized slab-ocean experiments with a GCM. J Clim. 2008;21:3521–3532. [Google Scholar]
- 25.Archer D, et al. Atmospheric lifetime of fossil fuel carbon dioxide. Annu Rev Earth Planet Sci. 2009;37:117–134. [Google Scholar]
- 26.Broecker W, Takahashi T, Simpson H, Peng T. Fate of fossil-fuel carbon-dioxide and the global carbon budget. Science. 1979;206:409–418. doi: 10.1126/science.206.4417.409. [DOI] [PubMed] [Google Scholar]
- 27.Hansen J, et al. Climate forcings in the Industrial era. Proc Natl Acad Sci USA. 1998;95:12753–12758. doi: 10.1073/pnas.95.22.12753. [DOI] [PMC free article] [PubMed] [Google Scholar]
- 28.Myhre G, Highwood E, Shine K, Stordal F. New estimates of radiative forcing due to well mixed greenhouse gases. Geophys Res Lett. 1998;25:2715–2718. [Google Scholar]
Associated Data
This section collects any data citations, data availability statements, or supplementary materials included in this article.


