

Abstract
Cells adjust gene expression profiles in response to environmental and physiological changes through a series of signal transduction pathways. Upon activation or deactivation, the terminal regulators bind to or dissociate from DNA, respectively, and modulate transcriptional activities on particular promoters. Traditionally, individual reporter genes have been used to detect the activity of the transcription factors. This approach works well for simple, non-overlapping transcription pathways. For complex transcriptional networks, more sophisticated tools are required to deconvolute the contribution of each regulator. Here, we demonstrate the utility of network component analysis in determining multiple transcription factor activities based on transcriptome profiles and available connectivity information regarding network connectivity. We used Escherichia coli carbon source transition from glucose to acetate as a model system. Key results from this analysis were either consistent with physiology or verified by using independent measurements.
Bacteria respond to environmental changes through a variety of sensor proteins, which eventually relay the signals to corresponding DNA binding proteins to modulate transcription. The DNA binding transcription regulators, or transcription factors (TFs), typically require posttranscriptional modification or ligand binding to assume an active conformation, which may bind to DNA and either positively or negatively regulate transcription. Here, the activity of a TF is defined as the concentration of its subpopulation capable of DNA binding. The collective activities of TFs can thus be regarded as the physiological state of the cell. Determining these TF activities (TFAs) allows better understanding of how cells respond to changes in the environment. Careful experimental studies in the past few decades have identified conditions that perturb each individual TF independent of others. Although such ideal conditions allowed useful characterization of molecular mechanisms, most environmental perturbations are complex and are likely to provoke multiple regulatory systems simultaneously. Without a proper method of decomposing the regulatory signals, it is difficult to investigate how microorganisms coordinate various regulatory pathways upon an environmental challenge.
Here, we report the use of network component analysis (NCA) recently developed in our group (1) to determine the dynamics of the activities of various TFs during a physiological process. This approach uses both DNA microarray data and partial information regarding the membership of regulons as defined by each TF in question. It contrasts with other approaches, such as singular value decomposition (2) or independent component analysis (3), in that it does not depend on orthogonality and statistical independence. Rather, it uses biological information regarding regulatory network topology, even when the topology is incompletely defined. Furthermore, NCA differs from model-based parameter estimation (4) because it allows deconvolution of multiple regulatory pathways.
We use the Escherichia coli transition from glucose to acetate media as an example. When switching from a glycolytic condition to a gluconeogenic condition with acetate as the sole carbon source, E. coli is known to induce a significant change in metabolic genes (5). In particular, the glyoxylate shunt (ace-BAK), the tricarboxylic acid (TCA) cycle, and the acetate uptake gene (acs) are up-regulated along with other genes under catabolite repression (6). The gene expression pattern has been studied by comparing the balanced growth culture in glucose and acetate media (6). However, how the cell coordinates the transition from one condition to the other during the adaptation phase has not been characterized. This adaptation phase provides an excellent case to demonstrate the utility of NCA. In addition, we validate the results of NCA by comparing the predicted TFA of a regulator, catabolite repressor protein (CRP), with the measured cAMP concentrations.
Materials and Methods
Strain and Culture Conditions. E. coli BW25113 [F-(araD-araB)lacZ4787lacIq-4000 LAM-rph-1 (rhaD-rhaB) hsdR514] was used for transcriptome analysis. Cells were grown in M9 minimum medium (7) containing either 0.5% (wt/vol) glucose or 0.25% (wt/vol) acetate. In transition experiments, cells were grown to OD600 of 0.5–0.6 in M9 glucose medium, chilled quickly in ethanol/dry ice bath, harvested by centrifugation at 8,000 rpm at 4°C, then washed once at 4°C with 0.25% M9 acetate. A portion of the cells were harvested as reference samples, and the remaining cells were poured into 0.25% M9 acetate medium prewarmed to 37°C with a starting OD600 of ≈0.2. Time-course samples were collected at specified times by quickly chilling in ethanol/dry ice bath and harvested by centrifugation at 8,000 rpm at 4°C. All time-course samples were kept in RNAlater (Qiagen, Valencia, CA) at –80°C for RNA purification at a later time.
DNA Microarray Experiments. Total RNA of ≈1 × 10⁹ cells was purified by hot phenol extraction followed by purification using the RNeasy midi kit (Qiagen) following the manufacturer's instructions. cDNA labeling and hybridization were performed according to protocols as described (6). DNA microarray slides containing all E. coli ORFs were made in our laboratory (6), and the images were scanned by using a Versarray ChipReader high-resolution (5 μm) scanner (Bio-Rad) at two excitation wavelengths (532 and 635 nm). Each slide contained two spots of the same probe, each sample was hybridized to two slides, and the time-course experiments were replicated up to three times. The two images scanned with the wavelengths of Cy3 and Cy5 were analyzed by using the image analysis software imagene (Biodiscovery, Marina Del Rey, CA). The software package lcdna, developed in our laboratory (8), was used to assess the statistical confidence intervals of gene expression. The analysis accounts for slide-to-slide and experiment-to-experiment variations by using both technical and biological repeats. A Markov chain Monte Carlo simulation was used to determine the parameters in a Bayesian hierarchical model.
Intracellular cAMP Assay. The samples for intracellular cAMP measurement were taken and prepared for assay as described (9). Ten milliliters of E. coli culture was harvested and filtered through 0.45-μm membrane filters (Millipore) at each time point. The filtered samples were quickly dipped into 7 ml of ice-cold 60% ethanol solution and stored at –20°C before assay. The concentrations of intracellular cAMP were determined with an enzyme-linked immunoassay (Biotrak cAMP EIA system, Amersham Biosciences).
NCA. As shown in Fig. 1, NCA takes advantage of the connectivity information to decompose DNA microarray data to determine both TFA and the control strength (CS) of each regulatory pair. The relationship between TFAs and gene expression levels was approximated by a log-linear model of the type:
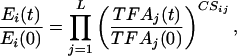 |
[1] |
where Ei(t) is the gene expression level, TFAj(t), j = 1,..., L is a set of transcriptional regulator activities, and CSij represents the CS of TF j on gene i. The above equation can be written in the following matrix form after taking the logarithm
 |
[2] |
where the elements Erij(t) = Eij(t)/Eij(0) and TFArkj(t) = TFAkj(t)/TFAkj(0) are the relative gene expression levels and TFAs. The rows of [Er] (size: N × M) and [TFAr] (size: L × M) are the time courses of relative gene expression levels and TFAs, respectively, and [CS] (size: N × L) is the matrix with elements CSik. In the above equation, log[Er] is obtained from DNA microarray data, and both [CS] and [TFA] are unknown variables to be determined. Several linear decompositions of the matrix log [Er] have been used in the study of gene expression array, such as singular value decomposition (2) and independent component analysis (3). Although these decomposition techniques have strong statistical foundations, their molecular basis is difficult to pinpoint.
Fig. 1.

(A) A bipartite network illustrating the static relationship between TFs and the genes they control. (B) The quantitative and dynamic TF gene network reconstructed by applying the NCA method. The activated form of a TF has its own dynamics, making the activity of a TFA a separate quantity from the expression level of its parent gene. The color of the edges indicates the polarity (red, negative; blue, positive) of the connection, and the thickness indicates the magnitude of the effect of a TF on each gene. (C) Method for quantitative reconstruction. The connectivity information between TFs and genes (Left) is used to construct an initial CS matrix, which is tested to verify whether it satisfies the criteria required by NCA. The zeroes in the initial CS matrix are used as constraints when deconvolving microarray data (Right) to obtain TFAs and CSs with the NCA technique.
The solution obtained by NCA is based not on any hypothesis of relationship between the TFAs, but on the structure of [CS], namely, the connectivity structure of the network linking TFs and genes. Specifically, such constraints involve, for example, setting to zero the elements CSij when gene i is not regulated by TFAj, but can also include constraints on the polarity of the regulation (induction or repression). We demonstrated (1) that if the underlying transcriptional network satisfies the following properties, such decomposition becomes unique up to some normalization factors:
The connectivity matrix [CS] must have full-column rank.
When a node in the regulatory layer is removed along with all of the output nodes connected to it, the resulting network must be characterized by a connectivity matrix that still has full-column rank.
The log [TFAr] matrix must have full row rank. In other words, each regulatory signal cannot be expressed as a linear combination of the other regulatory signals. This criterion requires M > L as a necessary but not sufficient condition.
To test whether the given network satisfies the above NCA criteria, an initial [CS] matrix is constructed by assigning random numbers to the nonzero entries of the [CS] matrix and fixing the zero entries based on the network topology. The initial [CS] matrix must have full-column rank (criterion i). For each TF, by deleting the corresponding column and rows corresponding to nonzero elements in that column, the resulting reduced matrix should still have full-column rank (criterion ii). If not, this TF is not identifiable with NCA. Criterion iii cannot be tested a priori, but it demands that the number of time points (M) is greater than the number of TFs (L). Biological repeats of time points can be included in the matrix [Er] to increase M. Because of the noise of the data, the resulting TFAr matrix almost always satisfies criterion iii when M > L.
Once the above three criteria are satisfied, we proceed by minimizing the following objective function:
 |
[3] |
where N0 is the topology defined by the network connectivity pattern. If a TF-gene pair is not linked in the connectivity diagram, then the corresponding CS value is constrained to zero during the decomposition. Otherwise, it is optimized through the decomposition process. The objective function in Eq. 3 is equivalent to a constrained maximum-likelihood procedure in the presence of Gaussian noise. Because, in general, multiple instances of the measurement data are not available, we assess the variability of our estimates by using a bootstrap procedure (1). The actual estimation of [TFAr] and [CS] is performed by using a two-step least-squares algorithm, which exploits the biconvexity properties of linear decompositions.
The CS values for each TF across all of the genes are normalized so that the mean absolute values of the nonzero CSs are equal to the number of controlled genes. After normalization, the CS values satisfy the following property:
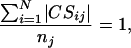 |
[4] |
where nj is the number of genes regulated by TFj. With this normalization, the CS values represent the relative CS for the same regulator on different genes. In addition, after normalization, the activity for the jth TF at time k is the average absolute effect on all of the genes it controls.
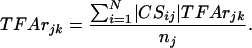 |
[5] |
Here, both CSij and TFArjk are normalized values. Because TFA is always discussed as ratios with respect to the initial reference state, we simplify the discussion in the following by using TFA to prepresent TFAr. A Matlab module for NCA analysis is available at www.seas.ucla.edu/~liaoj.
Results and Discussion
Applicability of NCA to E. coli. We recognize that transcriptional activities are regulated by a set of DNA-binding TFs, whose activities are modulated via posttranslational modification or ligand binding. Therefore, the transcriptome dynamics can be largely represented by the dynamics of TFAs. In the simplest case, if a gene is controlled by only one TF, it can be used as a reporter. However, a large number of genes are controlled by multiple TFs. Therefore, it is difficult to obtain TF information from these transcriptome profiles. NCA offers an opportunity to determine the contribution of each TF to each gene, provided that the connectivity of TF to the genes is known and satisfies the NCA criteria. Although the connectivity between transcription factors and genes in E. coli is incomplete, currently available information was obtained from RegulonDB (10), which included 120 regulatory proteins and 833 genes. Some corrections were made according to literature data, and the final connectivity database used in this work is shown at www.seas.ucla.edu/~liaoj/.
Typically, physiological perturbations impact only a subset of the TFs, causing the differential expression of a subset of genes. Given the incomplete connectivity information currently available for E. coli, we tested whether subnetworks satisfy the NCA criteria. Thus, a given number of TFs was randomly chosen from E. coli together with the genes they controlled to form random subnetworks. The initial CS matrices were constructed by using the known connectivity information between TF and genes. These matrices were tested for conformity to the NCA criteria. Results show that 70% of the TFs in any subnetworks randomly selected are NCA identifiable (Fig. 2). A similar test for Saccharomyces cerevisiae shows that >95% of TFs in random subnetworks are NCA identifable (data not shown).
Fig. 2.

Identifiability of random subnetworks in E. coli. Randomly chosen TFs and the genes they control are used to construct subnetworks, using the known connectivity information between TF and genes. These subnetworks were tested for conformity to the NCA criteria. Results show that the TF networks randomly selected are ≈70% identifiable, based on the NCA method.
A common problem is caused by occasional cases where the gene membership of a particular regulon is a subset of another. Thus, the NCA criterion ii cannot be satisfied, and the TFA of the subregulon cannot be identified. This situation arises when a TF is known to regulate only a specific operon. For example, LacI is known to regulate only the lac operon, whereas the lac operon is also regulated by CRP. Thus, LacI forms a regulon that is a subset of CRP. Fortunately, these cases are relatively simple, and the activity of these TFs can be directly determined through other means. To circumvent this problem in NCA, a reduced set of the transcription network should be constructed by deleting the TF (e.g., LacI) and their regulon membership (lacZYA), which cause rank deficiency. It is also possible that as the connectivity information becomes more complete (as in the case of S. cerevisiae), fewer TFs will form regulons that are subsets of others.
Gene Expression Profiles During E. coli Carbon Source Transition. To apply NCA to E. coli, temporal gene expression profiles of E. coli BW25113 during transition from glucose to acetate as the sole carbon source was detected by using DNA microarrays. Samples were taken at 5, 15, 30, and 60 min, and every hour until6hafter transition. Each time point was compared against the reference sample taken immediately before transition.
During this transition, no growth was observed within the first 2–3 h (Fig. 3A). However, transcriptional regulation was highly active during the first hour with 337 genes significantly upregulated at least 2-fold and 416 genes down-regulated at least 2-fold. The genes that are essential for acetate metabolism include acs, which is responsible for acetate uptake, aceBAK, which codes for the glyoxylate shunt genes, the TCA cycle genes, and the gluconeogenic gene, pckA. These genes were all upregulated, but at different time scales (Fig. 3B). Within the first 5 min, acs and pckA were induced as the first response to this carbon source switch. The TCA cycle genes (e.g., sucABCD, lpdA, gltA, mdh, and icdA) were down-regulated within the first 30 min before they were up-regulated again at 1–2 h. The rapid induction of acs was consistent with the literature (11); however, the initial down-regulation of TCA cycle genes was unexpected. The glyoxylate shunt genes were induced at ≈1 h after transition, before the TCA cycle genes came out of the initial repressed state at ≈2 h. Furthermore, an overall down-regulation of the amino acid (with the exception of cystein) and nucleotide biosynthesis pathway genes was observed, consistent with the initial growth arrest upon transitioning from glucose to acetate.
Fig. 3.

(A) Growth curve of E. coli BW25113 after transition from glucose to acetate media. (B) Gene expression profiles of key genes for acetate metabolism.
NCA of the Transcriptome Data. Among the genes in the connectivity database (www.seas.ucla.edu/~liaoj), 296 of them were shown to be perturbed during transition from glucose to acetate growth. The initial connectivity matrix was constructed by using random numbers as an initial guess of the nonzero CS values. This matrix was tested by using the NCA criteria. The final data set for NCA analysis contained 100 genes and 16 TFs. The data matrix has 25 time points that included repeated data points. Thus the dimension of the data matrix was (100 × 25). The data matrix was decomposed according to Eq. 2, and the resulting [CS] and [TFA] matrices were normalized according to Eqs. 4 and 5. The TFA for the same time points were then averaged to obtain the final time courses.
For regulators that require modification, the TFA represents either a ligand-bound or phosphorylated form of the TF. Among the regulators, CRP, FadR, IclR, and Cra (FruR) were known to participate in this carbon source transition. CRP requires the binding of the signal metabolite, cAMP, for activation. The TFA profile of CRP represents the time course of the CRP–cAMP complex. It peaked within the first hour of transition then tapers off slowly, consistent with the finding that the intracellular concentration of cAMP is increased in the absence of glucose (12, 13).
IclR is a repressor of the glyoxylate shunt genes, which are required for growth in acetate. This regulator is thought to require an unknown binding partner for its repression activity. Thus, the TFA of IclR represents the level of the IclR–ligand complex, which exerts a negative effect on the genes it controls. According to the NCA results (Fig. 4), the activity of IclR decreased after transition, and thus the genes it controlled were derepressed. Similarly, the activity of FadR, a regulator involved in fatty acid degradation, and an activator of IclR were decreased initially. Cra has been proposed to participate in carbon source regulation. In the absence of the suggested effectors, fructose 1 phosphate or fructose 1,6 bisphosphate, it activated ppsA. Its TFA profile was consistent with the expression profile of ppsA.
Fig. 4.

The dynamics of the TFA for 16 transcriptional regulators during glucose to acetate transition in E. coli. The activities for transcription regulators provide indications of the levels of their active forms, such as phosphor-ArcA, cAMP–CRP complex, and tryptophan–TrpR complex, which may either repress or activate transcription. The solid line is the average TFA, and the shaded areas span two standard deviations (these statistics were estimated by using a bootstrap technique).
An unapparent participant during this transition was ArcA, which was transiently activated (through phosphorylation) during the initial period. The activated ArcA can serve as both a positive and negative regulator, depending on the specific promoter. ArcA has been shown to be activated during growth arrest and its activation has been proposed as a means to reduce the damaging effects of oxygen radical species (14). In accordance with this theory, our results showed that ArcA was activated initially because of the reduced need for respiration during growth arrest in the transition period. As growth resumed, ArcA activity was reduced to allow the cell to resume aerobic growth.
Overall, consistent with the reduced need of building blocks during transition from glucose to acetate, activities of TFs that were involved in biosynthesis were behaving accordingly. The leu operon activator, LeuO, was inactivated during the growth arrest. The aromatic amino acid biosynthesis pathway repressors, TrpR and TyrR, were activated during this transition. TrpR binds to its ligand, tryptophan, for activation, whereas TyrR requires any of the aromatic amino acids for activation depending on the target. During the growth arrest, there was an apparent surplus of the aromatic amino acids, thus the two repressors involved in amino acid biosynthesis were activated to repress the biosynthetic genes. PurR is the repressor for the nucleotide biosynthesis genes using hypoxanthine or guanine as corepressors. It exhibited a sharp peak in activity initially, indicative of a reduced need for purine biosynthesis during growth arrest. The initial activation of PurR was slowly alleviated, suggesting that the need for nucleotide biosynthesis increased as growth resumed. One exception to the general reduction of biosynthesis was indicated by CysB, the activator for the synthetic genes of cysteine and uptake genes of sulfur sources. CysB is also known to be involved in glyoxylate assimilation and to be active under catabolite-derepressed conditions by exerting its effect on adenylate cyclase through influencing the phosphotransferase system-regulatory apparatus (15). Therefore the activation of CysB may help the cells to adapt to the new environmental condition after the carbon source transition from glucose to acetate.
The global regulatory protein, Lrp, participates in coping with changes in the nutritional conditions by regulating genes involved in amino acid biosynthesis, transport, and degradation (16, 17). Lrp exhibits its effect on operons through various modes of action. Depending on the target operon, Lrp can be activated with or without the binding of leucine. The TFA of Lrp represents its overall impact on its membership genes. For example, as a growth lag was first observed during glucose to acetate transition, Lrp repressed genes involved in the branched chain amino acid transport (e.g., livJ and livKHMGF) likely caused by reduced need.
Verification of TFA by cAMP Measurement. Most of the TFAs are difficult to measure directly. However, CRP activity can be deduced from the cAMP level, which can be measured. To verify the TFA estimates of CRP, we measured the intracellular concentration of cAMP during the transition. Indeed, the time course of cAMP (Fig. 5) ratios showed the same trend of CRP activity, providing evidence in support of the NCA analysis. In particular, the peak (5 min) to valley (4 h) difference in cAMP was the same as that of CRP activity. The agreement between the time course of cAMP and the estimated TFA of CRP is a positive confirmation to the NCA methodology and the CRP connectivity used in the analysis.
Fig. 5.

The ratios of the intracellular cAMP concentration relative to the initial time point during the glucose to acetate transition. The similarity of this profile to the TFA of CRP helps to confirm the NCA approach.
Conclusion
DNA microarray has been successfully used as a tool in the study of differential gene expression changes in various conditions (6, 18–24). However, without the proper mathematical and statistical tools, it is difficult to decipher the complex physiological responses to these environmental perturbations from these gene expression studies (25). The recently developed mathematical method, NCA, was successfully applied to E. coli during carbon source transition to obtain the TFAs for several important TFs. The physiological significance of several TFAs was consistent with known physiology and the TFA profile for CRP was experimentally validated by the cAMP levels.
The applicability of NCA mainly depends on the availability of sufficiently accurate TFs binding information. In most organisms, the connectivity information is currently unavailable. However, for well studied organisms such as E. coli and S. cerevisiae, significant amounts of connectivity information have been accumulated and more are being discovered (26–29). In addition, various computational and experimental methods have been developed (30–33) to allow the determination of such connectivity information for less-characterized organisms. It is expected that such data will increase significantly in the near future. If reasonably accurate connectivity information is available, TFAs determined by NCA provide additional insight to interpret the transcriptome data. On the other hand, questionable and incomplete connectivity information will remain common. Because NCA derives the TFAs based on multiple genes, it is relatively insensitive to small errors. However, large amounts of error in connectivity may lead to TFA profiles that are inconsistent with other existing physiological data, and thus provide a means to check the accuracy of connectivity information.
Acknowledgments
This work is supported by a Defense Advanced Research Planning Agency Bio-Computation grant, National Science Foundation Grants BES-0120359 and DGE9987641, and the Center for Cell Mimetic Space Exploration, National Aeronautics and Space Administration University Research, Engineering, and Technology Institute, under Award NCC 2-1364.
This paper was submitted directly (Track II) to the PNAS office.
Abbreviations: TF, transcription factor; TFA, TF activity; NCA, network component analysis; TCA, tricarboxylic acid; CRP, catabolite repressor protein; CS, control strength.
References
- 1.Liao, J. C., Boscolo, R., Yang, Y. L., Tran, L. M., Sabatti, C. & Roychowdhury, V. (2003) Proc. Natl. Acad. Sci. USA 100, 15522–15527. [DOI] [PMC free article] [PubMed] [Google Scholar]
- 2.Alter, O., Brown, P. O. & Botstein, D. (2000) Proc. Natl. Acad. Sci. USA 97, 10101–10106. [DOI] [PMC free article] [PubMed] [Google Scholar]
- 3.Liebermeister, W. (2002) Bioinformatics 18, 51–60. [DOI] [PubMed] [Google Scholar]
- 4.Ronen, M., Rosenberg, R., Shraiman, B. I. & Alon, U. (2002) Proc. Natl. Acad. Sci. USA 99, 10555–10560. [DOI] [PMC free article] [PubMed] [Google Scholar]
- 5.Cozzone, A. J. (1998) Annu. Rev. Microbiol. 52, 127–164. [DOI] [PubMed] [Google Scholar]
- 6.Oh, M. K., Rohlin, L., Kao, K. C. & Liao, J. C. (2002) J. Biol. Chem. 277, 13175–13183. [DOI] [PubMed] [Google Scholar]
- 7.Miller, J. H. (1992) A Short Course in Bacterial Genetics: A Laboratory Manual and Handbook for Escherichia coli and Related Bacteria (Cold Spring Harbor Lab. Press, Plainview, NY).
- 8.Tseng, G. C., Oh, M. K., Rohlin, L., Liao, J. C. & Wong, W. H. (2001) Nucleic Acids Res. 29, 2549–2557. [DOI] [PMC free article] [PubMed] [Google Scholar]
- 9.Death, A. & Ferenci, T. (1994) J. Bacteriol. 176, 5101–5107. [DOI] [PMC free article] [PubMed] [Google Scholar]
- 10.Salgado, H., Santos-Zavaleta, A., Gama-Castro, S., Millan-Zarate, D., Diaz-Peredo, E., Sanchez-Solano, F., Perez-Rueda, E., Bonavides-Martinez, C. & Collado-Vides, J. (2001) Nucleic Acids Res. 29, 72–74. [DOI] [PMC free article] [PubMed] [Google Scholar]
- 11.Kumari, S., Beatty, C. M., Browning, D. F., Busby, S. J. W., Simel, E. J., Hovel-Miner, G. & Wolfe, A. J. (2000) J. Bacteriol. 182, 4173–4179. [DOI] [PMC free article] [PubMed] [Google Scholar]
- 12.Notley, L. & Ferenci, T. (1995) Mol. Microbiol. 16, 121–129. [DOI] [PubMed] [Google Scholar]
- 13.Makman, R. S. & Sutherland, E. W. (1965) J. Biol. Chem. 240, 1309–1314. [PubMed] [Google Scholar]
- 14.Nystrom, T., Larsson, C. & Gustafsson, L. (1996) EMBO J. 15, 3219–3228. [PMC free article] [PubMed] [Google Scholar]
- 15.Quan, J. A., Schneider, B. L., Paulsen, I. T., Yamada, M., Kredich, N. M. & Saier, M. H., Jr. (2002) Microbiology 148, 123–131. [DOI] [PubMed] [Google Scholar]
- 16.Calvo, J. M. & Matthews, R. G. (1994) Microbiol. Rev. 58, 466–490. [DOI] [PMC free article] [PubMed] [Google Scholar]
- 17.Newman, E. B., Lin, R. T. & D'Ari, R. (1996) in Escherichia coli and Salmonella typhimuriium: Cellular and Molecular Biology (Am. Soc. Microbiol., Washington, DC), pp. 1513–1525.
- 18.Gonzalez, R., Tao, H., Shanmugam, K. T., York, S. W. & Ingram, L. O. (2002) Biotechnol. Prog. 18, 6–20. [DOI] [PubMed] [Google Scholar]
- 19.Tao, H., Bausch, C., Richmond, C., Blattner, F. R. & Conway, T. (1999) J. Bacteriol. 181, 6425–6440. [DOI] [PMC free article] [PubMed] [Google Scholar]
- 20.Gasch, A. P., Spellman, P. T., Kao, C. M., Carmel-Harel, O., Eisen, M. B., Storz, G., Botstein, D. & Brown, P. O. (2000) Mol. Biol. Cell 11, 4241–4257. [DOI] [PMC free article] [PubMed] [Google Scholar]
- 21.Khodursky, A. B., Peter, B. J., Cozzarelli, N. R., Botstein, D., Brown, P. O. & Yanofsky, C. (2000) Proc. Natl. Acad. Sci. USA 97, 12170–12175. [DOI] [PMC free article] [PubMed] [Google Scholar]
- 22.Zimmer, D. P., Soupene, E., Lee, H. L., Wendisch, V. F., Khodursky, A. B., Peter, B. J., Bender, R. A. & Kustu, S. (2000) Proc. Natl. Acad. Sci. USA 97, 14674–14679. [DOI] [PMC free article] [PubMed] [Google Scholar]
- 23.Richmond, C. S., Glasner, J. D., Mau, R., Jin, H. & Blattner, F. R. (1999) Nucleic Acids Res. 27, 3821–3835. [DOI] [PMC free article] [PubMed] [Google Scholar]
- 24.Oh, M. K. & Liao, J. C. (2000) Biotechnol. Prog. 16, 278–286. [DOI] [PubMed] [Google Scholar]
- 25.Alm, E. & Arkin, A. P. (2003) Curr. Opin. Struct. Biol. 13, 193–202. [DOI] [PubMed] [Google Scholar]
- 26.Courcelle, J., Khodursky, A., Peter, B., Brown, P. O. & Hanawalt, P. C. (2001) Genetics 158, 41–64. [DOI] [PMC free article] [PubMed] [Google Scholar]
- 27.Oshima, T., Aiba, H., Masuda, Y., Kanaya, S., Sugiura, M., Wanner, B. L., Mori, H. & Mizuno, T. (2002) Mol. Microbiol. 46, 281–291. [DOI] [PubMed] [Google Scholar]
- 28.Lee, T. I., Rinaldi, N. J., Robert, F., Odom, D. T., Bar-Joseph, Z., Gerber, G. K., Hannett, N. M., Harbison, C. T., Thompson, C. M., Simon, I., et al. (2002) Science 298, 799–804. [DOI] [PubMed] [Google Scholar]
- 29.Robison, K., McGuire, A. M. & Church, G. M. (1998) J. Mol. Biol. 284, 241–254. [DOI] [PubMed] [Google Scholar]
- 30.Tegner, J., Yeung, M. K., Hasty, J. & Collins, J. J. (2003) Proc. Natl. Acad. Sci. USA 100, 5944–5949. [DOI] [PMC free article] [PubMed] [Google Scholar]
- 31.Gardner, T. S., di Bernardo, D., Lorenz, D. & Collins, J. J. (2003) Science 301, 102–105. [DOI] [PubMed] [Google Scholar]
- 32.Bussemaker, H. J., Li, H. & Siggia, E. D. (2000) Proc. Natl. Acad. Sci. USA 97, 10096–10100. [DOI] [PMC free article] [PubMed] [Google Scholar]
- 33.Bussemaker, H. J., Li, H. & Siggia, E. D. (2000) Proc. Int. Conf. Intell. Syst. Mol. Biol. 8, 67–74. [PubMed] [Google Scholar]