

The anisotropy of nuclear spin interactions results in a unique mapping of structure to the resonance frequencies and splittings observed in NMR spectra. Single crystals provide definitive examples in solid-state NMR spectroscopy1 However, it is the determination of molecular structure from experimentally measured spectral parameters2 that is paramount, and it is this process that is complicated by angular ambiguities resulting from the symmetry properties of dipole–dipole and chemical shift interactions.3 This situation has been substantially improved by the recognition of distinctive wheel-like patterns4,5 in two-dimensional 1H–15N heteronuclear dipolar/15N chemical shift PISEMA (polarization inversion spin-exchange at the magic angle) spectra6 of helical membrane proteins in highly aligned lipid bilayer samples.7 Further, information inherent in anisotropic spectral features can be used to short-circuit the traditional steps of resolution, measurement, and sequential assignment of resonances in protein structure determination.8 Weakly aligned samples of proteins display these same effects, primarily as residual dipolar couplings (RDCs), in solution NMR spectra.9 This communication introduces one-dimensional dipolar waves as an extension of two-dimensional PISA (polarity index slant angle) wheels to map protein structure in NMR spectra of both highly and weakly aligned samples. It has been well demonstrated that the RDCs aid in the refinement of structures of proteins in solution10–12 as well as for the de novo determination of protein folds.13–15 In refinement, these measurements supplement an already large number of chemical shifts, approximate distance measurements, and dihedral angle restraints. For the determination of a backbone fold using only RDCs, a large number of measurements (>5 per residue) is a limiting prerequisite.16 Among the principal advantages of anisotropic spectral parameters in solution NMR spectroscopy is that they report on the global orientations of separate domains of a protein and of individual bonds relative to a reference frame, which reflects the preferred alignment of the molecule in the magnetic field.17 This does not preclude their utility in characterizing local backbone structure, as has been applied in solid-state NMR of oriented proteins for some time.3,18–21
Spectral simulations indicate that the periodicity inherent in secondary structure elements can be used as an index of their topology.4,5 Figure 1A displays classical two-dimensional PISA wheels of an α-helix at four different slant angles relative to the z axis of the oriented molecular frame of reference. Figure 1B illustrates the periodic wavelike variations of the magnitudes of the static heteronuclear dipolar couplings as a function of residue number in the absence of chemical shift effects. At slant angles >40°, the absence of information about signs of the couplings affects the wave patterns. The corresponding properties of the RDCs in solution NMR spectra of weakly aligned helices for two different rhombicity values are shown in Figure 1, C and D. The striking similarities among the patterns of variation of the dipolar couplings in Figure 1 represent a convergence of solid-state and solution NMR approaches to structure determination.
Figure 1.

Simulated 1H–15N heteronuclear dipolar couplings for an 18-residue ideal (Φ = −65°, Ψ = −40°) α-helix for slant angles of 0°, 30°, 60°, and 90°. (A) PISA wheels for a fully aligned protein showing the dipolar couplings as a function of 15N chemical shift. (B) dipolar waves showing the static dipolar couplings of the PISA wheels as a function of residue position. (C and D) dipolar waves showing the residual dipolar couplings of a weakly aligned protein as a function of residue position in helices with average slant angles in the oriented frame C. Rhombicity of 0.25 D. Rhombicity of 0.6. The magnitude of the alignment Da contributes to scaling of the values in C and D.
The observation of the simple recognizable spectral features shown in Figure 1 enables the direct determination of the relative orientations of helices in a common frame. When the 1H–15N RDCs can be fit to a sinusoid of periodicity ~3.6 characteristic of an α-helix, the average value of DNH restricts the possible orientations of the helix to [θav, φav] as given by
where Da and R are the axial and rhombic components of the alignment tensor of the molecule.22 Because the NH bonds in an α-helix are distributed on a cone with axis θav, φav with an aperture angle δ (=15.8°), θ oscillates periodically from θav + δ to θav − δ and similarly for φ. The sinusoid itself is parametrized as a function of position (x) along the helix (ρ = 2πx/3.6) by
One sequential or a few residue-type assignments can determine the relative phase of Dhel(ρ), and a fit of the “experimental” sinusoid then yields values for θav, φav, Da, and R. Ambiguities caused by the inherent 4-fold degeneracy of the solutions can be resolved by comparison to a second dataset for a different orientation.23 The polarity index (rotation) of the helix can be determined from the value of ρ at each residue as well. While similar in some respects to the order matrix analysis for domain orientation, this approach takes advantage of the noncollinearity of the helix axis and the NH bonds in α-helices,15,24 Further simplifications result when Da and R can be estimated by alternative methods. The periodic nature of these patterns lends itself to Fourier analysis.
An experimental dataset of 1H–15N RDCs is shown in Figure 2 for MNK1, the first metal-binding domain of the Cu-transporting ATPase involved in Menkes disease.25 The structure shown in Figure 3 was determined in aqueous solution without the use of RDC constraints.25 As shown in Figure 3, the two regions of the protein (residues 18–28 and 61–71) with RDCs that oscillate with a periodicity of 3.6 correspond to the two helices in the protein with an RMSD of 1.8 Hz in both cases. By contrast, the best-fitting sinusoid of periodicity 3.6 for residues 43–53 has an RMSD of 11.3 Hz. The two helices have different average RDCs, and their oscillations have different amplitudes, reflecting differences in the orientations of the helices in the common frame of reference. The orientations of the helices determined from the data in Figure 3, A and B, are shown in Figure 3D, and they are similar to those in the NOE-based protein structure in Figure 3C. The individually fitted values of Da and R for helices 1 and 2 of 7.91 and 8.37 Hz and 0.56 and 0.59, respectively, are similar to those (8.35 Hz and 0.59) obtained from a global fit of the average structure to the entire NMR dataset with MODULE.26
Figure 2.
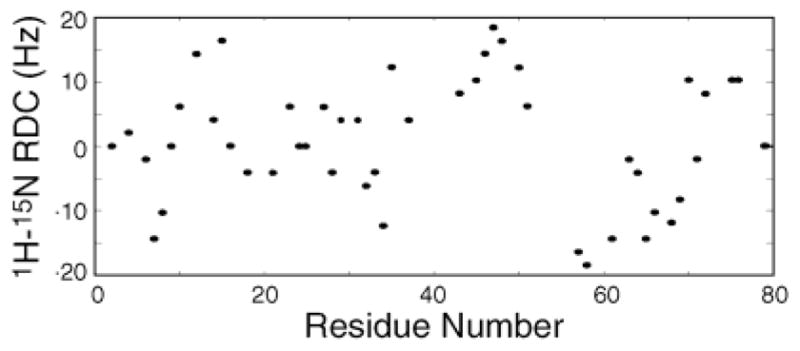
Experimental 1H–15N residual dipolar couplings for the 79-residue protein MNK1. RDCs were measured by comparing 1H–15N couplings measured in isotropic solution and in the presence of magnetically aligned Pf1 bacteriophage.
Figure 3.

Experimental 1H–15N residual dipolar couplings for the (A) first helix and (B) second helix of MNK1 show the best-fitting sinusoid. The average solution NMR structure (C) is shown in the oriented frame compared to (D) orientations of the two helices obtained by the fitting algorithm. The average solution NMR structure (C) is shown in the oriented frame compared to (D) orientations of the two helices obtained by the fitting algorithm.
Dipolar waves are present in many of the experimental RDC datasets archived in BioMagResBank27 and we have found that fits of these data faithfully reproduce the lengths and orientations of the helices in the proteins. A particularly valuable application of dipolar waves is to the determination of the orientations of helices in membrane proteins that are weakly aligned in lipid micelles.28,29 Extensions to other types of secondary structure are feasible. Approaches based on orientational constraints lend themselves to high-throughput structure determination because of their effectiveness with limited resonance assignments and the possibility of simultaneously assigning and measuring structural parameters.
Acknowledgments
We thank A. Nevzorov and G. Melacini for many helpful discussions. This research was supported by Grants PO1GM56538, R37GM24266, RO1GM29754, and RO1CA82864 from the National Institutes of Health, and the Biomedical Technology Resource for Solid-State NMR of Proteins supported by Grant P41RR09789.
References
- 1.Pausak S, Pines A, Waugh JS. J Chem Phys. 1973;59:599–612. [Google Scholar]
- 2.Waugh JS. Proc Natl Acad Sci USA. 1976;78:1894–1897. [Google Scholar]
- 3.Opella SJ, Stewart PL, Valentine KG. Q Rev Biophys. 1987;19:7–49. doi: 10.1017/s0033583500004017. [DOI] [PubMed] [Google Scholar]
- 4.Marassi FM, Opella SJ. J Magn Reson. 2000;144:150–155. doi: 10.1006/jmre.2000.2035. [DOI] [PMC free article] [PubMed] [Google Scholar]
- 5.Wang J, Denny J, Tian C, Kim S, Mo Y, Kovacs F, Song Z, Nishimura K, Gan Z, Fu R, Quine JR, Cross TA. J Magn Reson. 2000;144:162–167. doi: 10.1006/jmre.2000.2037. [DOI] [PubMed] [Google Scholar]
- 6.Wu CH, Ramamoorthy A, Opella SJ. J Magn Reson A. 1994;108:270–272. [Google Scholar]
- 7.Marassi FM, Ramamoorthy A, Opella SJ. Proc Natl Acad Sci USA. 1997;84:8551–8556. doi: 10.1073/pnas.94.16.8551. [DOI] [PMC free article] [PubMed] [Google Scholar]
- 8.Tian F, Valafar H, Prestegard JH. J Am Chem Soc. 2001;123:11791–11796. doi: 10.1021/ja011806h. [DOI] [PubMed] [Google Scholar]
- 9.For a review, see: Bax A, Kontaxis G, Tjandra N. Methods Enzymol. 2001;330:127–172. doi: 10.1016/s0076-6879(01)39313-8.
- 10.Clore GM, Gronenborn AM. Proc Natl Acad Sci USA. 1998;95:5891–5898. doi: 10.1073/pnas.95.11.5891. [DOI] [PMC free article] [PubMed] [Google Scholar]
- 11.Tolman JR, Flanagan JM, Kennedy MA, Prestegard JH. Proc Natl Acad Sci USA. 1995;92:9279–9283. doi: 10.1073/pnas.92.20.9279. [DOI] [PMC free article] [PubMed] [Google Scholar]
- 12.Mueller GA, Choy WY, Yang D, Forman-Kay JD, Venters RA, Kay LE. J Mol Biol. 2000;300:197–212. doi: 10.1006/jmbi.2000.3842. [DOI] [PubMed] [Google Scholar]
- 13.Hus JC, Marion D, Blackledge M. J Mol Biol. 2000;298:927–936. doi: 10.1006/jmbi.2000.3714. [DOI] [PubMed] [Google Scholar]
- 14.Delaglio F, Kontaxis G, Bax A. J Am Chem Soc. 2000;122:2142–2143. [Google Scholar]; Zweckstetter M, Bax A. J Am Chem Soc. 2001;123:9490–9491. doi: 10.1021/ja016496h. [DOI] [PubMed] [Google Scholar]
- 15.Fowler CA, Tian F, Al-Hashimi HM, Prestegard JHJ. Mol Biol. 2000;304:447–460. doi: 10.1006/jmbi.2000.4199. [DOI] [PubMed] [Google Scholar]; Losonsczi JA, Andrec M, Fischer MWF, Prestegard JH. J Magn Reson. 1999;138:334–342. doi: 10.1006/jmre.1999.1754. [DOI] [PubMed] [Google Scholar]
- 16.Hus JC, Marion D, Blackledge M. J Am Chem Soc. 2001;123:1541–1542. doi: 10.1021/ja005590f. [DOI] [PubMed] [Google Scholar]
- 17.Skrynnikov NR, Goto NK, Yang D, Choy WY, Tolman JR, Mueller GA, Kay LE. J Mol Biol. 1999;295:1265–1273. doi: 10.1006/jmbi.1999.3430. [DOI] [PubMed] [Google Scholar]
- 18.Cross TA, Opella SJ. J Mol Biol. 1985;182:367–381. doi: 10.1016/0022-2836(85)90197-4. [DOI] [PubMed] [Google Scholar]
- 19.Ketchem RR, Hu W, Cross TA. Science. 1993;261:1457–1460. doi: 10.1126/science.7690158. [DOI] [PubMed] [Google Scholar]
- 20.Opella SJ, Marassi FM, Gesell JJ, Valente AP, Kim Y, Oblatt-Montal M, Montal M. Nat Struct Biol. 1999;6:374–379. doi: 10.1038/7610. [DOI] [PMC free article] [PubMed] [Google Scholar]
- 21.Wang J, Kim S, Kovacs F, Cross TA. Protein Sci. 2001;10:2241. doi: 10.1110/ps.17901. [DOI] [PMC free article] [PubMed] [Google Scholar]
- 22.Clore GM, Gronenborn AM, Tjandra N. J Magn Res. 1998;131:159–162. doi: 10.1006/jmre.1997.1345. [DOI] [PubMed] [Google Scholar]
- 23.Al-Hashimi HM, Valafar H, Terrell M, Zartler ER, Eidness MK, Prestegard JH. J Magn Reson. 2000;143:402–406. doi: 10.1006/jmre.2000.2049. [DOI] [PubMed] [Google Scholar]
- 24.Fischer MWF, Losonsczi JA, Weaver JL, Prestegard JH. Biochemistry. 1999;38:9013–9022. doi: 10.1021/bi9905213. [DOI] [PubMed] [Google Scholar]
- 25.PDB structure 1KVI.
- 26.Dosset P, Hus JC, Marion D, Blackledge M. J Biomol NMR. 2001;20:223–231. doi: 10.1023/a:1011206132740. [DOI] [PubMed] [Google Scholar]
- 27.http://www.bmrb.wisc.edu/.
- 28.Ma C, Opella SJ. J Magn Reson. 2000;146:381–384. doi: 10.1006/jmre.2000.2172. [DOI] [PubMed] [Google Scholar]; Veglia G, Opella SJ. J Am Chem Soc. 2000;122:11733–11734. [Google Scholar]
- 29.Chou JJ, Kaufman JD, Stahl SJ, Wingfield PT, Bax A. J Am Chem Soc. 2002;124:2450–2451. doi: 10.1021/ja017875d. [DOI] [PubMed] [Google Scholar]